. 2021 Feb 2;118(5):e2010243118.
doi: 10.1073/pnas.2010243118.

Arabidopsis cell wall composition determines disease resistance specificity and fitness

Affiliations

Arabidopsis cell wall composition determines disease resistance specificity and fitness

Antonio Molina et al. Proc Natl Acad Sci U S A. .

Abstract

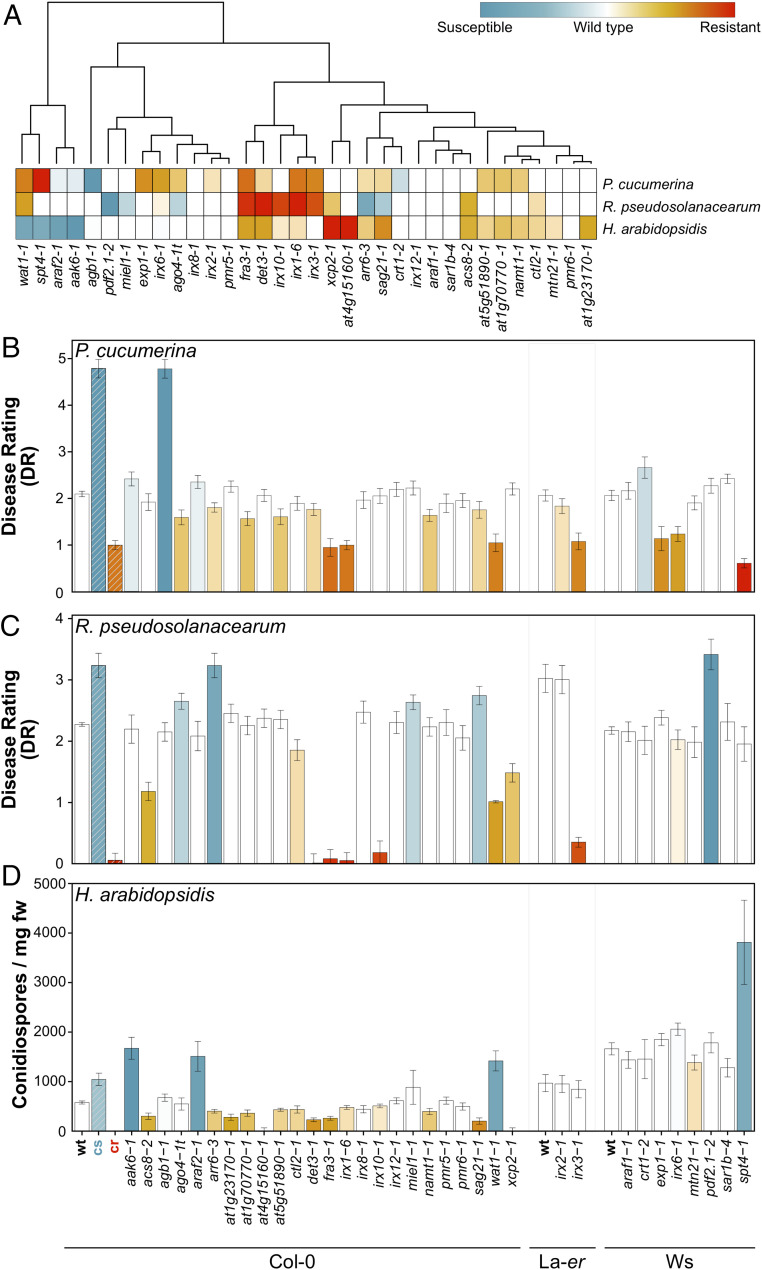
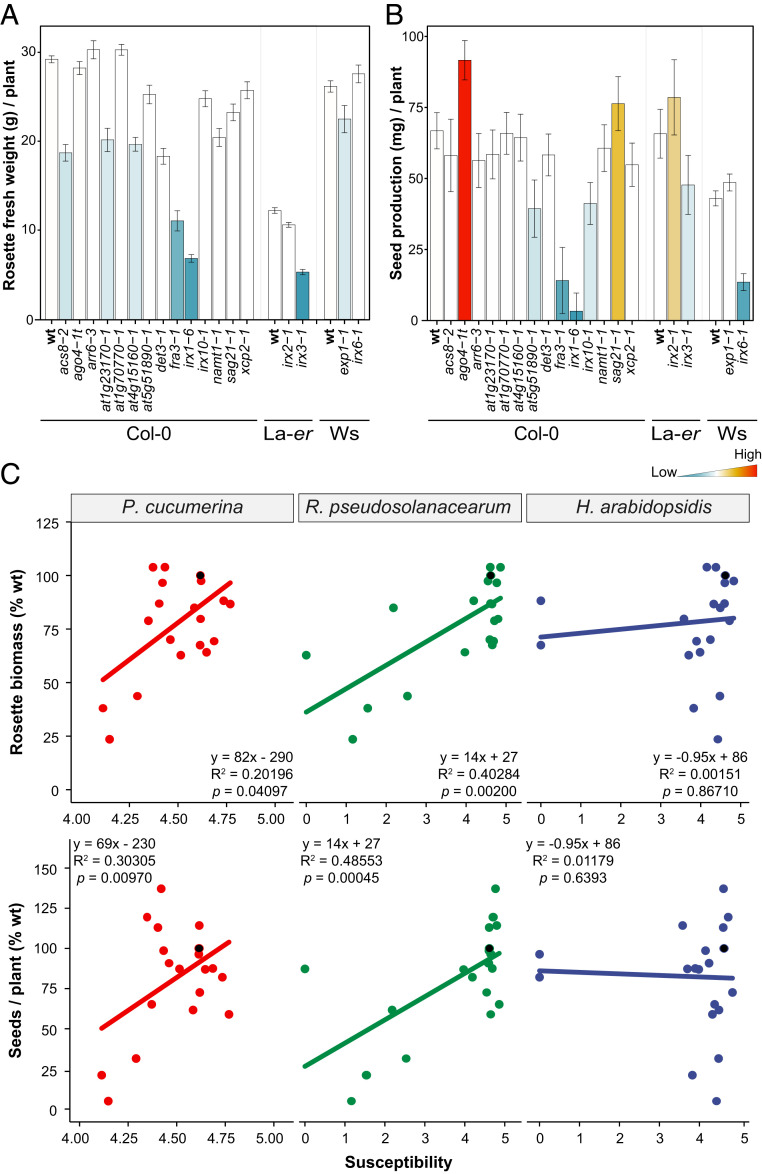
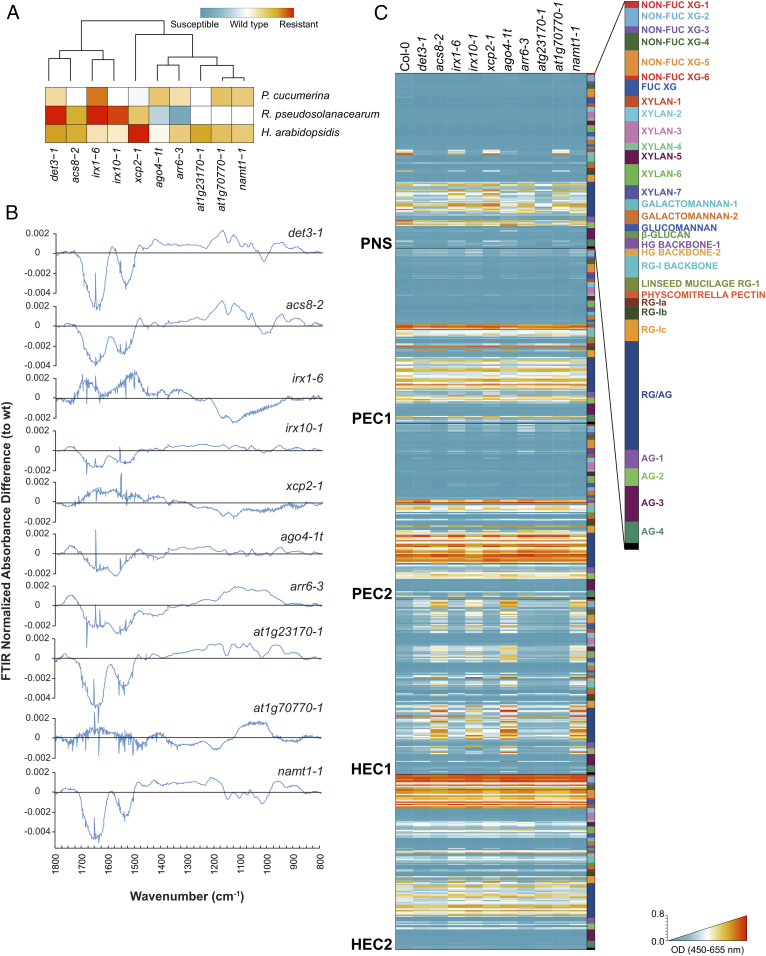
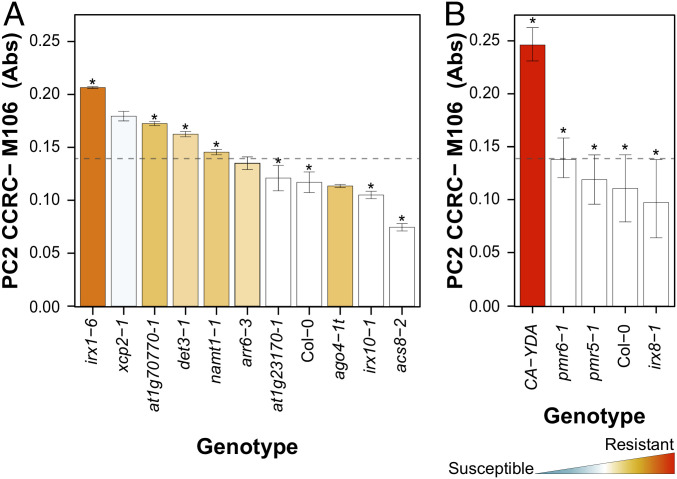
Plant cell walls are complex structures subject to dynamic remodeling in response to developmental and environmental cues and play essential functions in disease resistance responses. We tested the specific contribution of plant cell walls to immunity by determining the susceptibility of a set of Arabidopsis cell wall mutants (cwm) to pathogens with different parasitic styles: a vascular bacterium, a necrotrophic fungus, and a biotrophic oomycete. Remarkably, most cwm mutants tested (29/34; 85.3%) showed alterations in their resistance responses to at least one of these pathogens in comparison to wild-type plants, illustrating the relevance of wall composition in determining disease-resistance phenotypes. We found that the enhanced resistance of cwm plants to the necrotrophic and vascular pathogens negatively impacted cwm fitness traits, such as biomass and seed yield. Enhanced resistance of cwm plants is not only mediated by canonical immune pathways, like those modulated by phytohormones or microbe-associated molecular patterns, which are not deregulated in the cwm tested. Pectin-enriched wall fractions isolated from cwm plants triggered immune responses in wild-type plants, suggesting that wall-mediated defensive pathways might contribute to cwm resistance. Cell walls of cwm plants show a high diversity of composition alterations as revealed by glycome profiling that detect specific wall carbohydrate moieties. Mathematical analysis of glycome profiling data identified correlations between the amounts of specific wall carbohydrate moieties and disease resistance phenotypes of cwm plants. These data support the relevant and specific function of plant wall composition in plant immune response modulation and in balancing disease resistance/development trade-offs.

Keywords: cell wall; disease resistance; fitness; glycomics; immunity.


Conflict of interest statement

The authors declare no competing interest.

Figures

Fig. 1.
Fig. 1.
Arabidopsis cell wall mutants show alterations of their disease-resistance phenotypes in comparison to wild-type plants. (A) Clustering of disease-resistance phenotypes of Arabidopsis cell wall mutants to P. cucumerina (Pc), R. pseudosolanacearum (Rp), and H. arabidopsidis (Hpa). Clusters were computed using Euclidean distances using disease-resistance indexes relative to wild-type (wt) plants (DR for Pc and Rp; number of conidiospores per milligram of rosette fresh weight (mg fw) for Hpa). The color-coding of the corresponding columns/squares indicates the level of the resistance phenotype, from susceptible (blue) to resistant (red), that have been established for each pathogen tested. Colored squares/columns indicate values of significant differences compared with wt values (ANOVA nonbalanced analysis and Dunnett’s test, P ≤ 0.05). (B) DR (average ± SD) of cell wall mutants and wt plants (Col-0, La-er, and Ws backgrounds; n > 10) at 7 dpi with the necrotrophic fungus Pc. DR varies from 0 (noninfected plants) to 5 (dead plants). The irx1-6 and agb1-1 mutants were included as cr and cs, respectively. (C) DR (average ± SD) of wt and mutants (n > 10) at 8 dpi with bacterium Rp. DR varies between 0 (no symptoms) and 4 (dead plants). irx1-6 and arr6-3 mutants were included as cr and cs, respectively. (D) Number of conidiospore/milligram fresh weight in wt and mutant plants (average ± SD; n > 20) at 7 dpi with the oomycete Hpa. La-er and Col-0 wild-type ecotypes were included as cr for Col-0 and La-er/Ws mutant backgrounds, respectively, and NahG plants (Col-0), eds1-1 (Ws), and eds1-2 (Col-0) alleles were used as cs for Col-0, Ws, and La-er mutant backgrounds, respectively (SI Appendix, Fig. S3). Data in BD are from one representative experiment of the three performed that gave similar results. References and details of cwm mutants are listed in SI Appendix, Figs. S1 and S2, and the DR and conidiospore/mg fw values (average ± SD) are shown in SI Appendix, Fig. S3.
Fig. 2.
Fig. 2.
Arabidopsis cell wall mutants show associated resistance/fitness trade-offs. (A) Rosette fresh weight biomass (average g/plant ± SD) of 4-wk-old mutants and wild-type (wt) plants (Col-0, La-er, and Ws backgrounds). (B) Seed yield (average milligram/plant ± SD) of wt plants and mutants at the end of reproductive cycle. Data are the average of 10 plants. The column color indicates significant differences compared with wt values (ANOVA nonbalanced analysis and Dunnett’s test, P ≤ 0.05), with higher and lower values than wt indicated in red and blue, respectively. This is one representative experiment of the three performed that gave similar results. (C) Correlation analysis between biotic stress susceptibility to pathogens (Pc, Rp, and Hpa) and fitness parameters (seed yield and rosette biomass) of 18 cwm mutants and wt plants (Col-0, La-er, and Ws backgrounds). The average response information of each genotype (dot in the graph) is expressed in relation to that of the reference wt plant (black dot; value of 100% at the y-axes). Disease resistance susceptibility ratios were log-transformed, and accordingly, x-axes range from 0 (lower susceptibility) to 5 (greater susceptibility), with the wt plants situated at 4.72 = ln (1 + 100). A linear model was fitted for each combination and correlations determined. Fitted equations, R-squares, and P values are indicated in the insets of the graphs. The x-axes of the figures involving Pc are enlarged in the 4 to 5 range for better visualization.
Fig. 3.
Fig. 3.
Cell wall analyses by FTIR spectroscopy and glycome profiling of a core set of Arabidopsis cell wall mutants. (A) Selection of a core set of representative mutants with different levels of disease resistance to Pc, Rp, and Hpa. Clusters were computed by Euclidean distances using disease-resistance indexes relative to wild-type (wt) plants. (B) Cell wall FTIR difference spectra of mutants and wt plants (Col-0). The black line indicates wt values, and values over this line are differential FTIR spectra in the mutants tested. (C) Heatmaps of glycome profiling of cell wall extracts (PNS, PEC1, PEC2, HEC1, and HEC2) of cwm and wt (Col-0) rosette leaves of 25-d-old plants (see Dataset S1 for details). Heatmaps depict antibody binding strength based on optical density (OD) indicated as a color gradient ranging from blue (no binding) to red (strongest binding). The list of monoclonal antibodies used for glycome profiling of each fraction and wall structures recognized by them are indicated (Right) (see Dataset S1 for details). Data represent average values of two independent experiments (n > 10).
Fig. 4.
Fig. 4.
CRT analyses correlate wall composition and disease-resistance phenotypes of the Arabidopsis cell wall mutants. (A) Biological validation of CRT model for resistance to Pc with cell wall mutants from six different clusters (Fig. 3A). The absolute value (average ± SD) of the epitope signal detected by CCR-M106 antibody is shown. Columns are colored according to the resistance level of the corresponding mutant, from red (resistant) to blue (susceptible), in comparison with wild-type (wt) level of resistance (white column; ANOVA nonbalanced analysis, Dunnett’s test, P ≤ 0.05). The scale used is the same of that in Figs. 1 and 3A. The absorbance cutoff value for considering a mutant as resistant or susceptible/wt phenotype, as determined by CRT, is indicated by the dotted lines. The mutant genotypes which follow the CRT model are marked with an asterisk. (B) Biological validation of the CRT model with pmr5-1, pmr6-1, and irx8-1 mutants that do not show enhanced resistance to Pc and CA-YDA plants that show enhanced resistance to the fungus. All these mutants follow the absorbance cutoff value predicted by the CRT model, and, accordingly, they are marked with an asterisk.

Similar articles

Cited by

References

    1. Couto D., Zipfel C., Regulation of pattern recognition receptor signalling in plants. Nat. Rev. Immunol. 16, 537–552 (2016). - PubMed
    1. Pieterse C. M. J., Van der Does D., Zamioudis C., Leon-Reyes A., Van Wees S. C. M., Hormonal modulation of plant immunity. Annu. Rev. Cell Dev. Biol. 28, 489–521 (2012). - PubMed
    1. Shigenaga A. M., Berens M. L., Tsuda K., Argueso C. T., Towards engineering of hormonal crosstalk in plant immunity. Curr. Opin. Plant Biol. 38, 164–172 (2017). - PubMed
    1. Denancé N., Sánchez-Vallet A., Goffner D., Molina A., Disease resistance or growth: The role of plant hormones in balancing immune responses and fitness costs. Front. Plant Sci. 4, 155 (2013). - PMC - PubMed
    1. Miedes E., Vanholme R., Boerjan W., Molina A., The role of the secondary cell wall in plant resistance to pathogens. Front. Plant Sci. 5, 358 (2014). - PMC - PubMed

Publication types