

High-Density, Targeted Monitoring of Tyrosine Phosphorylation Reveals Activated Signaling Networks in Human Tumors
- PMID: 33509940
- PMCID: PMC8137532
- DOI: 10.1158/0008-5472.CAN-20-3804
High-Density, Targeted Monitoring of Tyrosine Phosphorylation Reveals Activated Signaling Networks in Human Tumors
Abstract
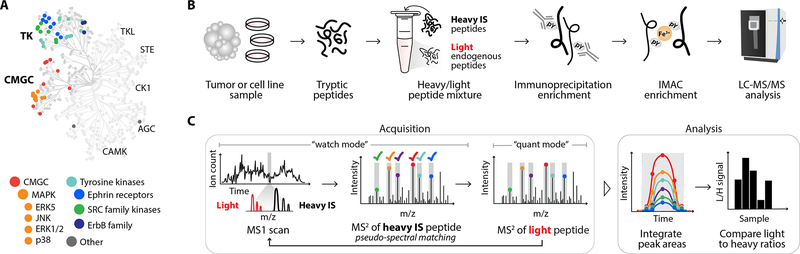
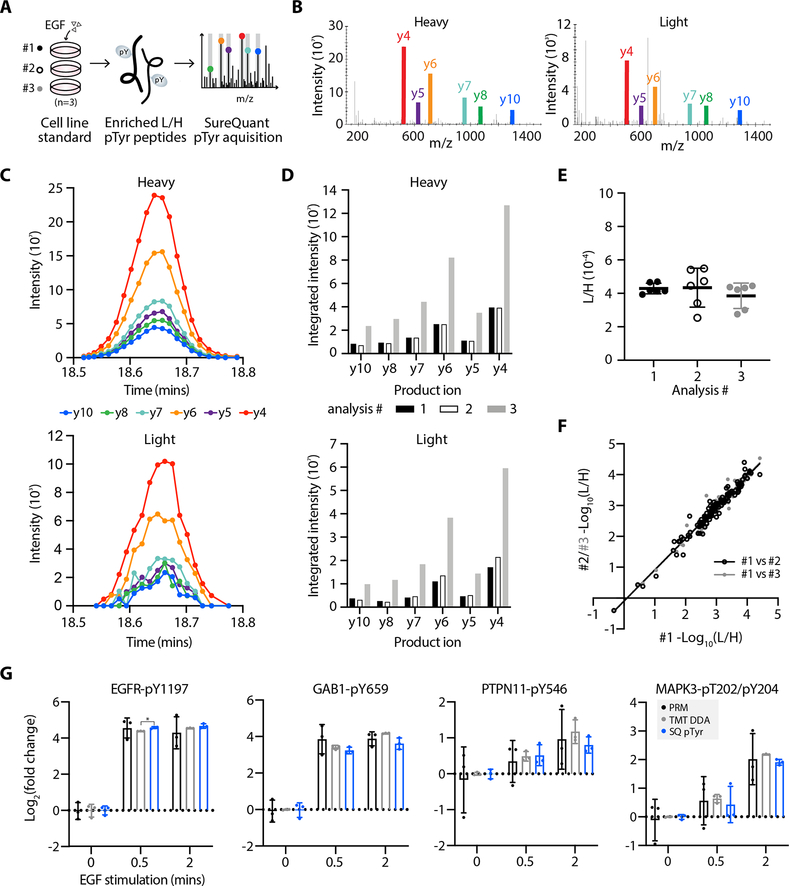
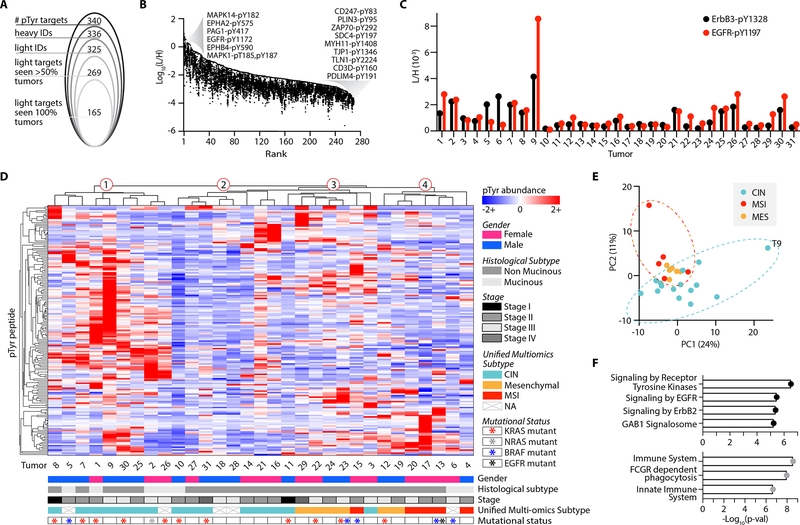
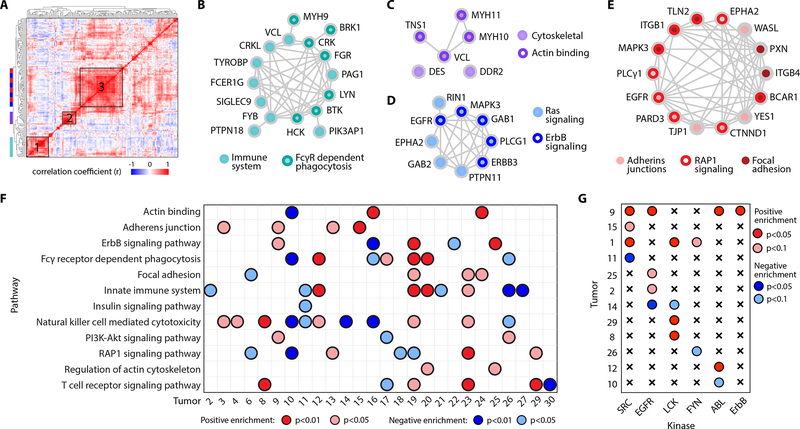
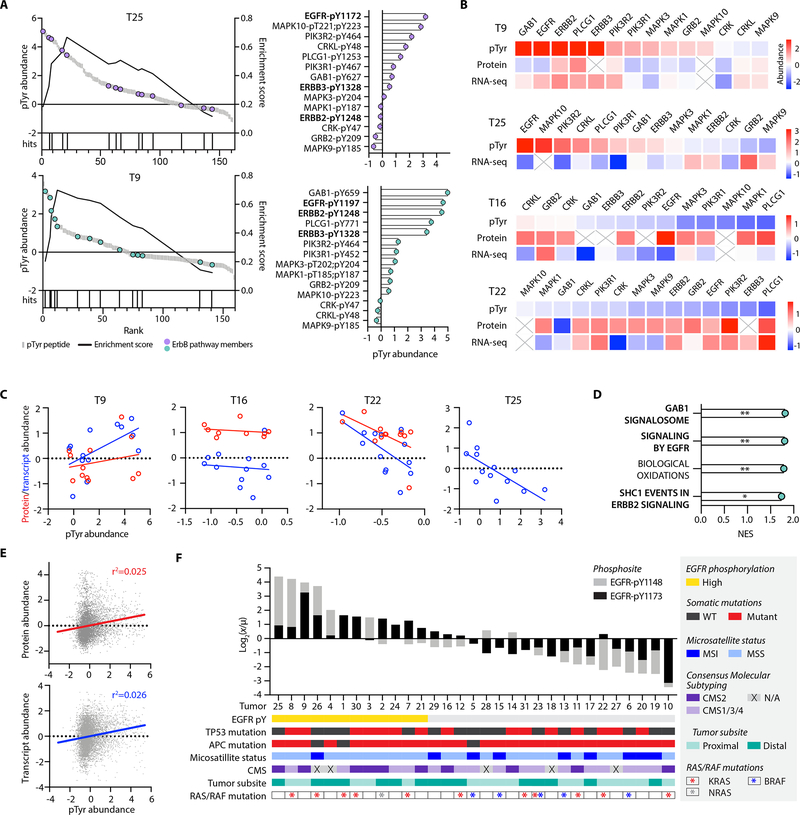
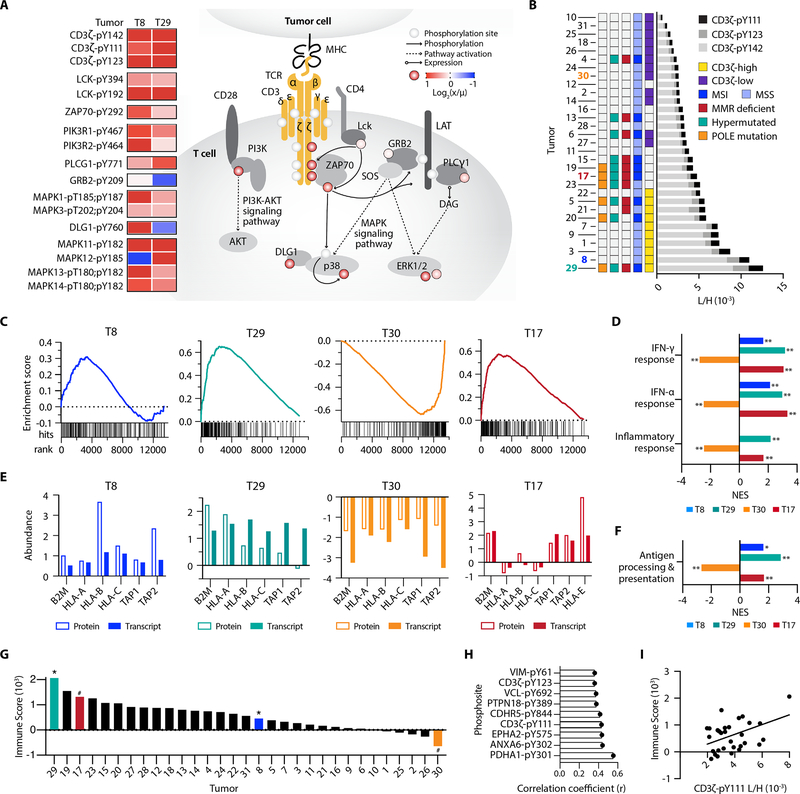
Tyrosine phosphorylation (pTyr) plays a pivotal role in signal transduction and is commonly dysregulated in cancer. As a result, profiling tumor pTyr levels may reveal therapeutic insights critical to combating disease. Existing discovery and targeted mass spectrometry-based methods used to monitor pTyr networks involve a tradeoff between broad coverage of the pTyr network, reproducibility in target identification across analyses, and accurate quantification. To address these limitations, we developed a targeted approach, termed "SureQuant pTyr," coupling low input pTyr enrichment with a panel of isotopically labeled internal standard peptides to guide data acquisition of low-abundance tyrosine phosphopeptides. SureQuant pTyr allowed for reliable quantification of several hundred commonly dysregulated pTyr targets with high quantitative accuracy, improving the robustness and usability of targeted mass spectrometry assays. We established the clinical applicability of SureQuant pTyr by profiling pTyr signaling levels in human colorectal tumors using minimal sample input, characterizing patient-specific oncogenic-driving mechanisms. While in some cases pTyr profiles aligned with previously reported proteomic, genomic, and transcriptomic molecular characterizations, we highlighted instances of new insights gained using pTyr characterization and emphasized the complementary nature of pTyr measurements with traditional biomarkers for improving patient stratification and identifying therapeutic targets. The turn-key nature of this approach opens the door to rapid and reproducible pTyr profiling in research and clinical settings alike and enables pTyr-based measurements for applications in precision medicine. SIGNIFICANCE: SureQuant pTyr is a mass spectrometry-based targeted method that enables sensitive and selective targeted quantitation of several hundred low-abundance tyrosine phosphorylated peptides commonly dysregulated in cancer, including oncogenic signaling networks.
©2021 American Association for Cancer Research.
Conflict of interest statement
COI: The authors declare no potential conflicts of interest.
Figures
Similar articles
-
Tandem Mass Tag Approach Utilizing Pervanadate BOOST Channels Delivers Deeper Quantitative Characterization of the Tyrosine Phosphoproteome.Mol Cell Proteomics. 2020 Apr;19(4):730-743. doi: 10.1074/mcp.TIR119.001865. Epub 2020 Feb 18. Mol Cell Proteomics. 2020. PMID: 32071147 Free PMC article.
-
One-Step SH2 Superbinder-Based Approach for Sensitive Analysis of Tyrosine Phosphoproteome.J Proteome Res. 2019 Apr 5;18(4):1870-1879. doi: 10.1021/acs.jproteome.9b00045. Epub 2019 Mar 25. J Proteome Res. 2019. PMID: 30875230
-
Quantitative Analysis of Tyrosine Phosphorylation from FFPE Tissues Reveals Patient-Specific Signaling Networks.Cancer Res. 2021 Jul 15;81(14):3930-3941. doi: 10.1158/0008-5472.CAN-21-0214. Epub 2021 May 20. Cancer Res. 2021. PMID: 34016623 Free PMC article.
-
MASS SPECTROMETRY-BASED MITOCHONDRIAL PROTEOMICS IN HUMAN OVARIAN CANCERS.Mass Spectrom Rev. 2020 Sep;39(5-6):471-498. doi: 10.1002/mas.21618. Epub 2020 Feb 4. Mass Spectrom Rev. 2020. PMID: 32020673 Review.
-
Application of targeted mass spectrometry in bottom-up proteomics for systems biology research.J Proteomics. 2018 Oct 30;189:75-90. doi: 10.1016/j.jprot.2018.02.008. Epub 2018 Feb 13. J Proteomics. 2018. PMID: 29452276 Free PMC article. Review.
Cited by
-
Urinary Proteomics for Discovery of Gastric Cancer Biomarkers to Enable Precision Clinical Oncology.OMICS. 2023 Aug;27(8):361-371. doi: 10.1089/omi.2023.0077. Epub 2023 Aug 9. OMICS. 2023. PMID: 37579183 Free PMC article.
-
Identifying individuals using proteomics: are we there yet?Front Mol Biosci. 2022 Nov 29;9:1062031. doi: 10.3389/fmolb.2022.1062031. eCollection 2022. Front Mol Biosci. 2022. PMID: 36523653 Free PMC article. Review.
-
Loss of Ten1 in mice induces telomere shortening and models human dyskeratosis congenita.Sci Adv. 2025 Apr 11;11(15):eadp8093. doi: 10.1126/sciadv.adp8093. Epub 2025 Apr 11. Sci Adv. 2025. PMID: 40215293 Free PMC article.
-
Automated proteomic sample preparation: The key component for high throughput and quantitative mass spectrometry analysis.Mass Spectrom Rev. 2023 Mar;42(2):873-886. doi: 10.1002/mas.21750. Epub 2021 Nov 16. Mass Spectrom Rev. 2023. PMID: 34786750 Free PMC article. Review.
-
Hybrid-DIA: intelligent data acquisition integrates targeted and discovery proteomics to analyze phospho-signaling in single spheroids.Nat Commun. 2023 Jun 16;14(1):3599. doi: 10.1038/s41467-023-39347-y. Nat Commun. 2023. PMID: 37328457 Free PMC article.
References
-
- White FM, Wolf-Yadlin A. Methods for the Analysis of Protein Phosphorylation–Mediated Cellular Signaling Networks. Annu Rev Anal Chem. Annual Reviews; 2016;9:295–315. - PubMed
Publication types
MeSH terms
Substances
Grants and funding
LinkOut - more resources
Full Text Sources
Other Literature Sources
Medical
Molecular Biology Databases
Research Materials
Miscellaneous
