. 2021 Feb 15;81(4):847-859.
doi: 10.1158/0008-5472.CAN-20-1822. Epub 2021 Jan 28.

3D Functional Genomics Screens Identify CREBBP as a Targetable Driver in Aggressive Triple-Negative Breast Cancer

Affiliations

3D Functional Genomics Screens Identify CREBBP as a Targetable Driver in Aggressive Triple-Negative Breast Cancer

Barrie Peck et al. Cancer Res. .

Abstract

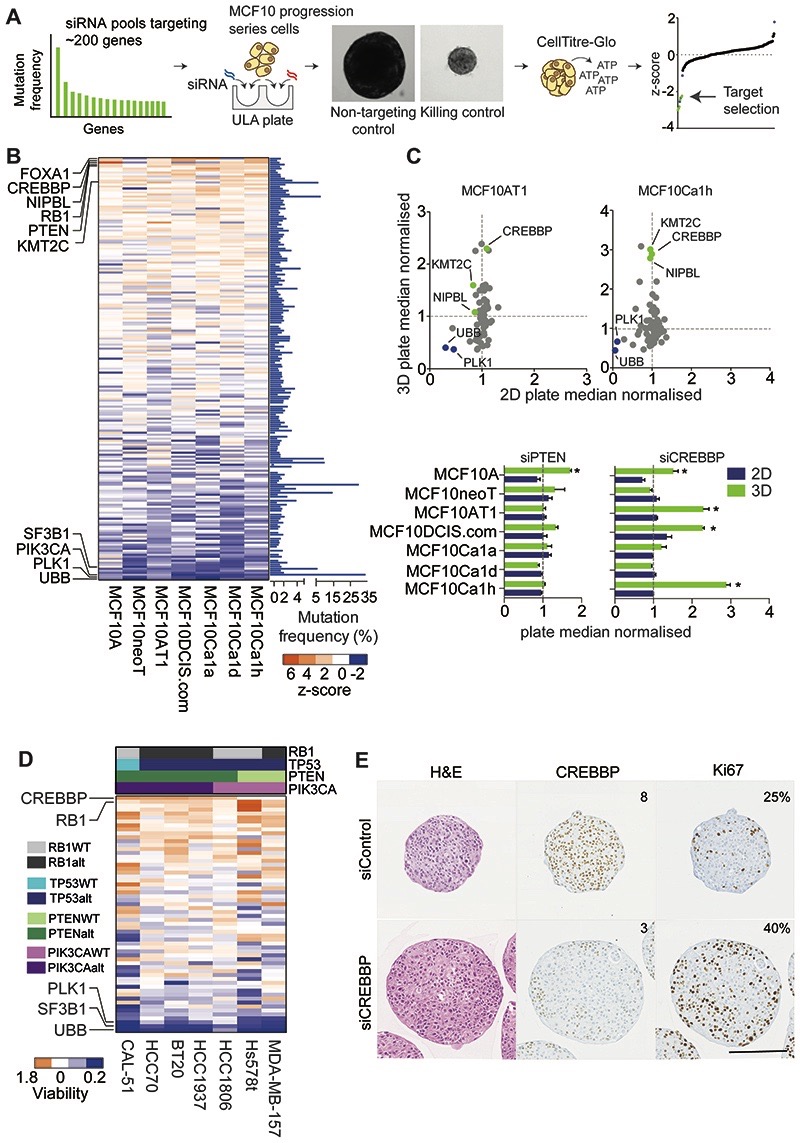
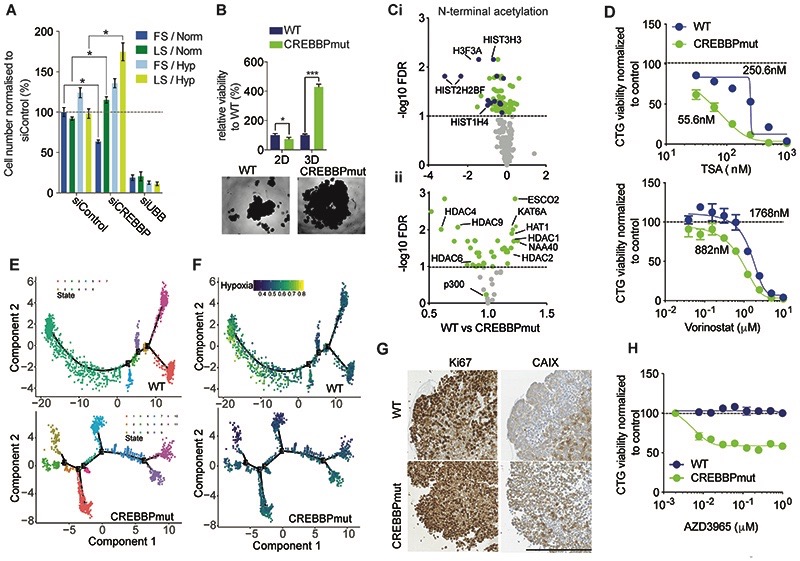
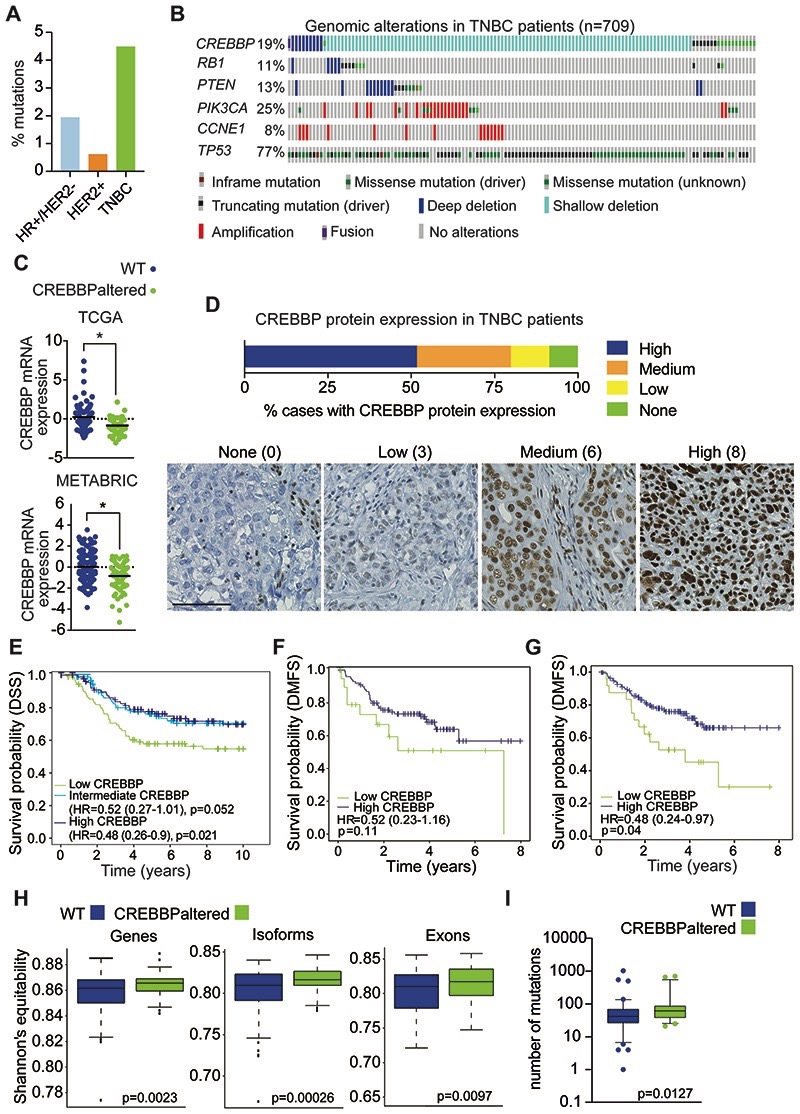
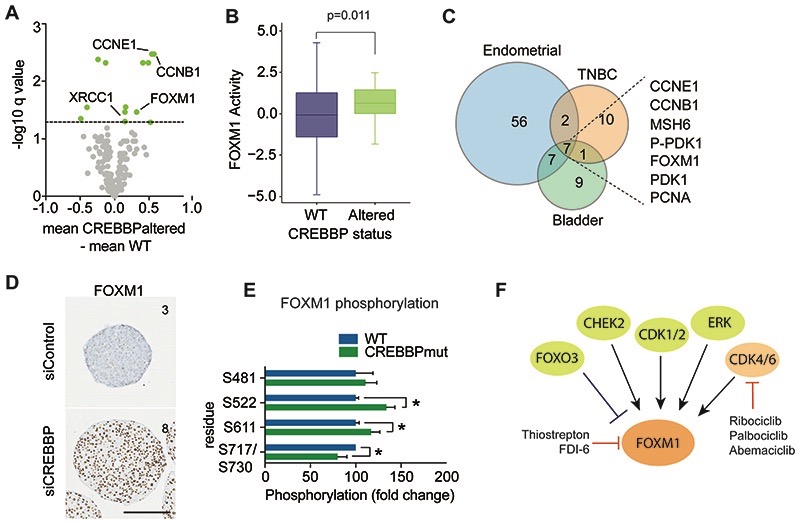
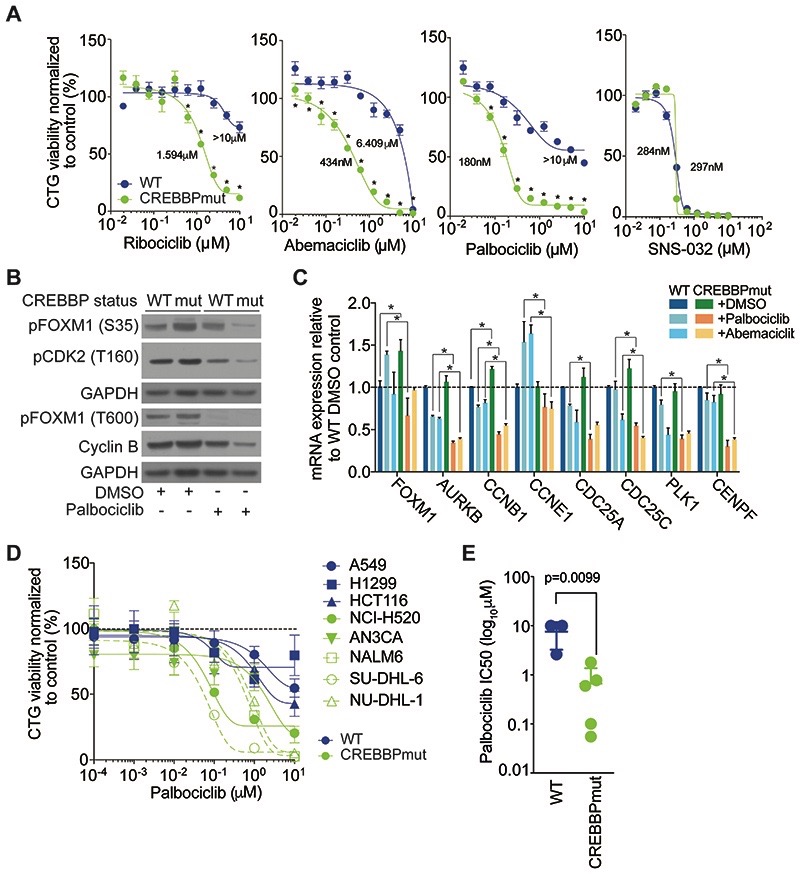
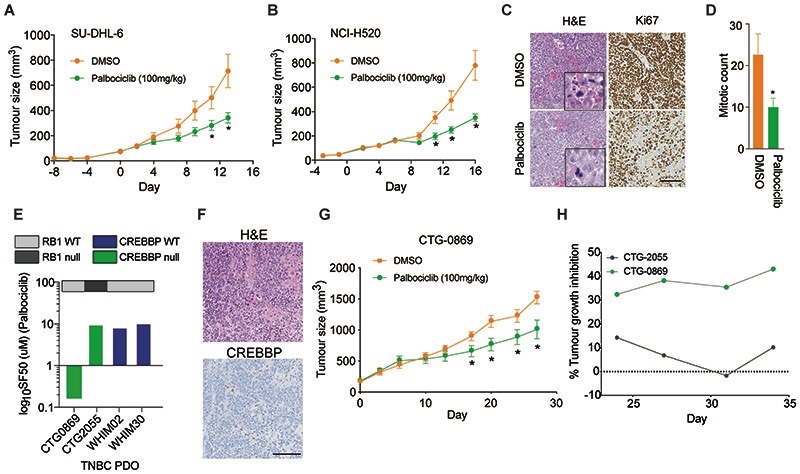
Triple-negative breast cancers (TNBC) are resistant to standard-of-care chemotherapy and lack known targetable driver gene alterations. Identification of novel drivers could aid the discovery of new treatment strategies for this hard-to-treat patient population, yet studies using high-throughput and accurate models to define the functions of driver genes in TNBC to date have been limited. Here, we employed unbiased functional genomics screening of the 200 most frequently mutated genes in breast cancer, using spheroid cultures to model in vivo-like conditions, and identified the histone acetyltransferase CREBBP as a novel tumor suppressor in TNBC. CREBBP protein expression in patient tumor samples was absent in 8% of TNBCs and at a high frequency in other tumors, including squamous lung cancer, where CREBBP-inactivating mutations are common. In TNBC, CREBBP alterations were associated with higher genomic heterogeneity and poorer patient survival and resulted in upregulation and dependency on a FOXM1 proliferative program. Targeting FOXM1-driven proliferation indirectly with clinical CDK4/6 inhibitors (CDK4/6i) selectively impaired growth in spheroids, cell line xenografts, and patient-derived models from multiple tumor types with CREBBP mutations or loss of protein expression. In conclusion, we have identified CREBBP as a novel driver in aggressive TNBC and identified an associated genetic vulnerability in tumor cells with alterations in CREBBP and provide a preclinical rationale for assessing CREBBP alterations as a biomarker of CDK4/6i response in a new patient population. SIGNIFICANCE: This study demonstrates that CREBBP genomic alterations drive aggressive TNBC, lung cancer, and lymphomas and may be selectively treated with clinical CDK4/6 inhibitors.


Conflict of interest statement

Disclosure of Potential Conflicts of Interest.

ANT has served on advisory boards for Pfizer. SPV is a Chief investigator on a number of clinical trials involving other compounds with Pfizer. LAM receives academic funding from Pfizer. No potential conflicts of interest were disclosed by the other authors.

Figures

Figure 1
Figure 1. A targeted functional genomics screen in cancer cell line spheroids identifies CREBBP as a tumour suppressor in TNBC.
(A) Schematic of reverse transfection protocol of spheroids ULA (ultra-low attachment plates). (B) Heatmap of the z scores of the MCF10 progression series screen silencing the most frequently mutated genes (n=199) in multicellular spheroids (3D cultures). Known killing controls (essential genes are highlighted (SF3B1, PLK1, UBB). (C) Scatter plot of the spheroid viability of the MCF10 progression series under 2D and 3D conditions with the top fifty siRNAs relative to non-targeting control siRNA (NTC), depicting CREBBP, KMT2C and NIPBL as 3D specific hits. Bar chart of plate median normalised values for depicted genes from are also shown. (D) Heatmap of the plate median normalised values of the validation screen of the spheroid viability of a panel of TNBC spheroids after siRNAs silencing of the top fifty genes identified from (B) Common genomic alterations in the cell lines are depicted. (E) Representative micrographs of H&E and CREBBP and Ki67 protein expression evaluated by immunohistochemistry from 7-day spheroids of MCF10DCIS.com. Text depicts Allred scores for CREBBP IHC and % Ki67 positive cells (Scale bar represents 200μm).
Figure 2
Figure 2. CREBBP loss promotes growth under nutrient stress and hypoxia and confers sensitivity to HDAC and MCT-1 inhibition.
(A) Barchart depicting normalised cell viability assessed with Cell Titre Glo of MCF10AT1 cells that were grown in 2D under differing serum (Full/10% and Low/1% FBS) and oxygen (Normoxia/20% and Hypoxia/1% O2) and in combination for four days. siUBB was used as a positive cell killing control. (B) Bar chart representing isogenic HAP1 cell growth in 2D and 3D for seven days. Representative bright-field images of WT and CREBBPmut spheroids are also shown. (C) i) Volcano plot of the significantly altered N-terminal acetylated peptides between CREBBPmut and WT cells. HAP1 WT and CREBBPmut spheroids were grown for five days. Log2 fold change is plotted against -log10 of FDR corrected p value. Histone proteins are highlighted in blue. ii) Volcano plot of fold change of total protein expression of histone acetylase and deacetylases plotted against FDR corrected p-value. (D) Dose response curves of HAP1 WT and CREBBPmut spheroids were treated with increasing concentrations of HDAC inhibitors, Tricostatin A (TSA) and Vorinostat for five days. (E) Single cell RNAseq analysis after seven days of growth. DDRTree visualization and 2-D embedding showing constructed pseudo-time transcriptional states for WT and CREBBPmut spheroid cells, depicting an increased number of branches in the CREBBPmut cells indicative of differential transcriptional programmes over time. (F) Single cell RNAseq from (E) was also analysed for the presence of a hypoxia gene signature. (G) Representative micrographs of CREBBP, Ki67, carbonic anhydrase CAIX expression in HAP1 WT and CREBBPmut spheroids. Scale bar represents 100μm, indicating increased proliferation in CREBBPmut cells and increased levels of the hypoxia marker CAIX. (H) Dose response curves of HAP1 WT and CREBBPmut spheroids treated with increasing concentrations of the selective Monocoarboxylase transporter 1 inhibitor (MCT-1) AZD3965 for 5 days, showing that CREBBPmut cells are selectively sensitive to MCT-1 inhibition. Spheroid viability was assessed using CellTiter-Glo and normalised to DMSO treated cells.
Figure 3
Figure 3. CREBBP protein expression is associated with a poor prognosis in TNBC.
(A) Frequency plot of CREBBP mutations in breast cancer (from TCGA) stratified on subtype. (B) Oncoprint plot of genomic alterations in CREBBP in a combined analysis of TNBC (n=709) from TCGA, METABRIC and MSKCC cohorts. Frequencies of additional genomic alterations in TNBC are also depicted. (C) CREBBP mRNA expression in TNBCs stratified on CREBBP status in TCGA and METABRIC. (D) Bar chart depicting frequency of CREBBP protein expression in TNBCs from tissue microarrays of the Belgrade and BR10011a cohorts combined (n = 174). Representative micrographs of CREBBP protein expression are shown from Belgrade and corresponding Allred scores. Scale bar represents 100μm. (E) Kaplan-Meier plots for disease specific survival (DSS) in triple negative breast cancers from METABRIC (n=276) and that were stratified on their CREBBP mRNA expression (high, intermediate and low). Multivariable survival analysis was performed by taking into account CREBBP mRNA expression status, age, tumour size, node status and grade. (F) Kaplan-Meier plots for distant metastasis-free survival (DMFS) in triple negative breast cancers that were stratified on their CREBBP protein expression (high and low) from the Belgrade cohort that had associated outcome data. Low CREBBP expression was defined as Allred score <4. Multivariable survival analysis was performed by taking into account CREBBP protein expression status, age, TNM stage and grade. (G) Kaplan-Meier plots for distant metastasis-free survival (DMFS) in triple negative breast cancers that were stratified on their CREBBP mRNA expression (high and low) from the Belgrade cohort that had associated outcome data. Multivariable survival analysis was performed by taking into account CREBBP mRNA expression status, age, TNM stage and grade. (H) Box plots of the diversity of gene, isoform and exon expression in CREBBP WT and CREBBPaltered TNBCs. Diversity index was calculated using Shannon’s equitability index. (I) Box plots of the mutational burden in CREBBP WT and CREBBPaltered TNBCs.
Figure 4
Figure 4. CREBBPaltered cancers show increased FOXM1 driven proliferation
(A) Volcano plot of fold change in protein expression (x-axis) from reverse phase protein RPPA data of TNBCs stratified on CREBBP status, plotted against –log10P value (y-axis). Significant alterations in protein expression are highlighted in orange (FDR corrected p values <0.1). (B) Box plot of FOXM1 gene activity in CREBBPaltered TNBC. mRNA expression from TCGA was used to calculate FOXM1 activity utilizing a rank-based enrichment analysis (see Supplementary methods). (C) Venn diagram of significantly altered proteins between CREBBP-altered and WT tumours from RPPA data of TNBCs, endometrial and bladder cancers. (D) Representative micrographs of FOXM1 protein expression from 7-day spheroids of MCF10DCIS.com after siRNA silencing of CREBBP or non-targeting control. Text depicts IHC quantification (Allred scores). (Scale bar represents 200μm). (E) Bar plot of fold change in phosphorylated protein expression (x-axis) from mass spectrometry assessment of day 4 spheroids of HAP1 WT and CREBBPmut spheroids, plotted against –log10P value (y-axis). (F) A diagram of FOXM1 and the proteins that regulate its activity. Direct and indirect inhibitors are highlighted.
Figure 5
Figure 5. CREBBP loss sensitises cells to CDK4/6i
(A) Dose response curves of HAP1 WT and CREBBPmut cells treated with increasing concentrations of the clinical CDK inhibitors Ribociclib, Abemaciclib, Palbociclib and SNS-023 at the concentrations indicated. (B) Western blot of protein lysates of HAP1 WT and CREBBPmut cells treated with 1μM of Palbociclib or DMSO for 48hrs showing suppression of specific phospho sites in CREBBPmut cells. (C) Bar chart of relative mRNA expression of FOXM1 target genes in HAP1 WT and CREBBPmut cells +/- Palbociclib (250nM), Abemaciclib (500nM) or DMSO treatment at 24 hours after cell seeding for 72hrs. Gene expression was quantified using RT-PCR. (D) Dose response curves of a panel of non-isogenic cancer cell lines (WT= lung: A549, H1299, colorectal: HCT116, and CREBBPmut lung NCI-H520, endometrial AN3CA, leukaemia NALM-6, and lymphoma SU-DHL-6 and NU-DHL-1) spheroids treated with increasing concentrations of Palbociclib for five days and displayed according to CREBBP status. (E) Bar chart of SF50 values of non-isogenic CREBBPmut and WT cell lines grown as spheroids and treated with Palbociclib for 5 days.
Figure 6
Figure 6. CREBBPaltered tumours are sensitive to CDK4/6i in vivo.
(A) Chart depicting tumour volume of the therapeutic response to Palbociclib treatment in immunocompromised mice bearing CREBBP-mutant SU-DHL-6 tumours over time. Tumour volumes after the initiation of treatment are shown. (B) Chart depicting tumour volume of the therapeutic response to Palbociclib treatment in immunocompromised mice bearing CREBBP–mutant NCI-H520 tumours over time. Tumour volumes after the initiation of treatment are shown. (C) Immunohistochemical staining of representative tumours harvested from CREBBPmutant NCI-H520 tumours for Ki67 and H&E (scale bar represents 100μm). (D) Bar chart showing the quantification of mitotic counts in Palbociclib and control treated animals from (C). (E) Barchart depicting SF50 values of Palbociclib in a panel of TNBC PDO’s. CREBBP and RB1 status are shown. (F) Representative micrographs of H&E and CREBBP protein expression of the TNBC PDX CTG-0869 depicting protein loss of CREBBP. Scale bar represents 100μm. (G) Chart depicting CTG-0869 tumour volume of the therapeutic response to Palbociclib treatment in immunocompromised mice. Tumour volumes after the initiation of treatment are shown. (H) Chart depicting tumour growth inhibition (TGI) as percentage of DMSO treated mice bearing CTG-0869 and CTG-2055 TNBC xenografts treated with Palbociclib 100mg/ml after 3 weeks of treatment until experiment endpoint.

References

    1. Cancer Genome Atlas N. Comprehensive molecular portraits of human breast tumours. Nature. 2012;490:61–70. - PMC - PubMed
    1. Ciriello G, Gatza ML, Beck AH, Wilkerson MD, Rhie SK, Pastore A, et al. Comprehensive Molecular Portraits of Invasive Lobular Breast Cancer. Cell. 2015;163:506–19. - PMC - PubMed
    1. Cancer Genome Atlas Research N. Comprehensive genomic characterization of squamous cell lung cancers. Nature. 2012;489:519–25. - PMC - PubMed
    1. Han K, Pierce SE, Li A, Spees K, Anderson GR, Seoane JA, et al. CRISPR screens in cancer spheroids identify 3D growth-specific vulnerabilities. Nature. 2020;580:136–41. - PMC - PubMed
    1. Morrison E, Wai P, Leonidou A, Bland P, Khalique S, Farnie G, et al. Utilizing Functional Genomics Screening to Identify Potentially Novel Drug Targets in Cancer Cell Spheroid Cultures. J Vis Exp. 2016 - PMC - PubMed

Publication types

MeSH terms