

The infantile myofibromatosis NOTCH3 L1519P mutation leads to hyperactivated ligand-independent Notch signaling and increased PDGFRB expression
- PMID: 33509954
- PMCID: PMC7927659
- DOI: 10.1242/dmm.046300
The infantile myofibromatosis NOTCH3 L1519P mutation leads to hyperactivated ligand-independent Notch signaling and increased PDGFRB expression
Abstract
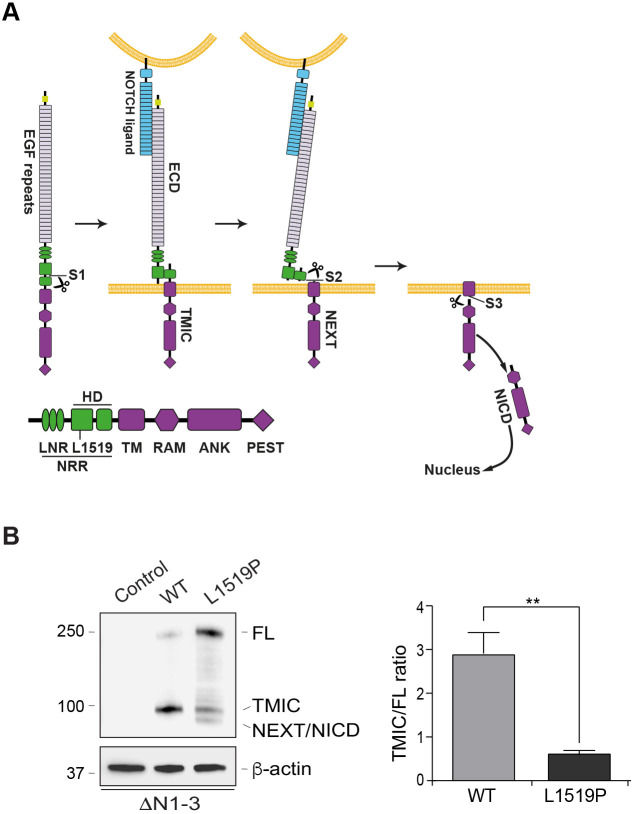
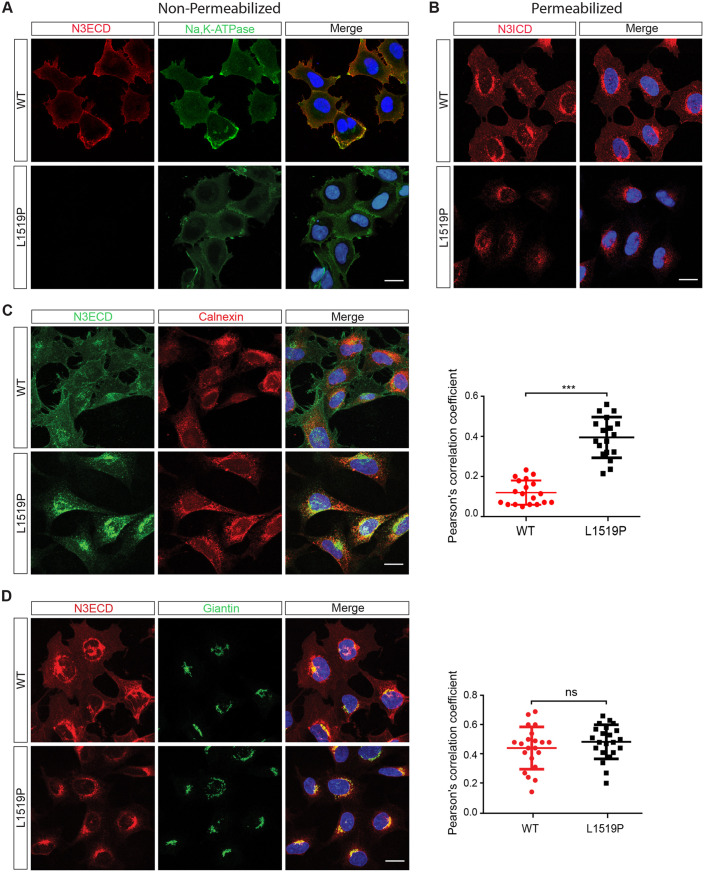
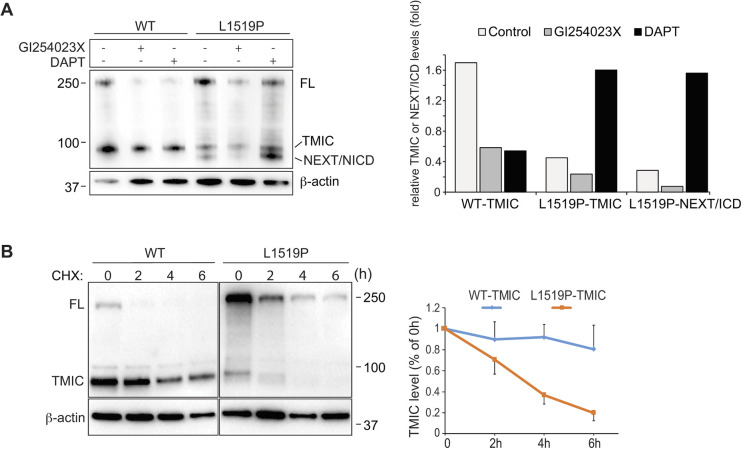
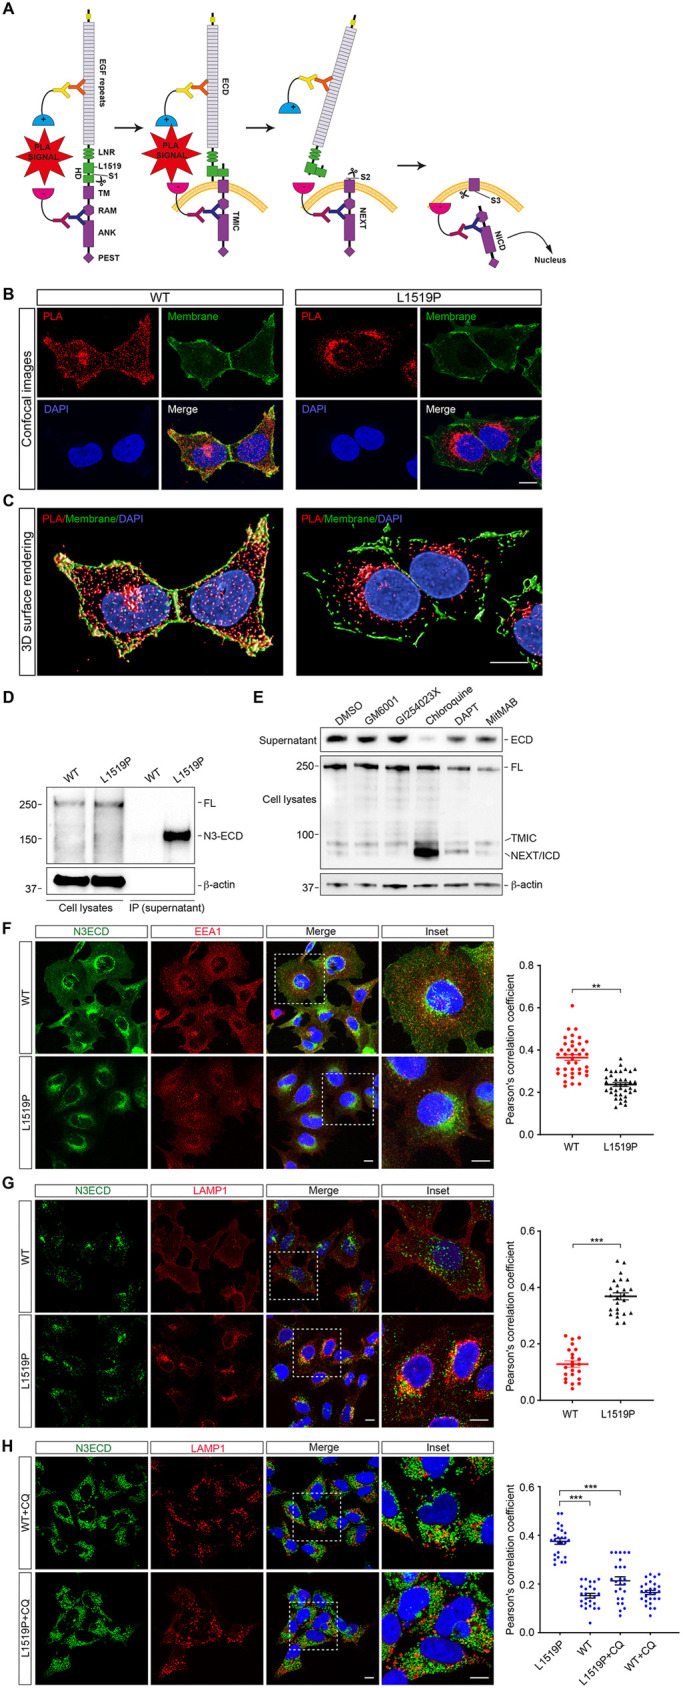
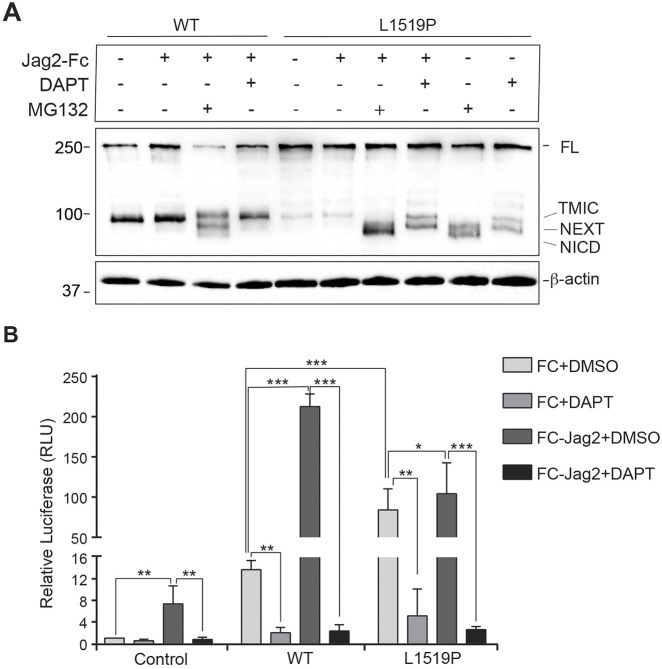
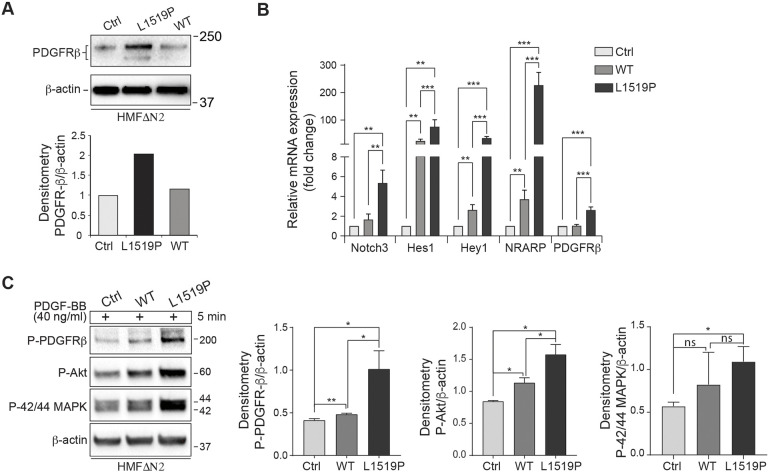
Infantile myofibromatosis (IMF) is a benign tumor form characterized by the development of nonmetastatic tumors in skin, bone, muscle and sometimes viscera. Autosomal dominant forms of IMF are caused by mutations in the PDGFRB gene, but a family carrying a L1519P mutation in the NOTCH3 gene has also recently been identified. In this report, we address the molecular consequences of the NOTCH3L1519P mutation and the relationship between the NOTCH and PDGFRB signaling in IMF. The NOTCH3L1519P receptor generates enhanced downstream signaling in a ligand-independent manner. Despite the enhanced signaling, the NOTCH3L1519P receptor is absent from the cell surface and instead accumulates in the endoplasmic reticulum. Furthermore, the localization of the NOTCH3L1519P receptor in the bipartite, heterodimeric state is altered, combined with avid secretion of the mutated extracellular domain from the cell. Chloroquine treatment strongly reduces the amount of secreted NOTCH3L1519P extracellular domain and decreases signaling. Finally, NOTCH3L1519P upregulates PDGFRB expression in fibroblasts, supporting a functional link between Notch and PDGF dysregulation in IMF. Collectively, our data define a NOTCH3-PDGFRB axis in IMF, where an IMF-mutated NOTCH3 receptor elevates PDGFRB expression. The functional characterization of a ligand-independent gain-of-function NOTCH3 mutation is important for Notch therapy considerations for IMF, including strategies aimed at altering lysosome function.
Keywords: Fibroblast; Infantile myofibromatosis; Notch; PDGF.
© 2021. Published by The Company of Biologists Ltd.
Conflict of interest statement
U.L. holds research grants from AstraZeneca and Merck A.G. The other authors declare co competing or financial interests.
Figures
Similar articles
-
Mutations in PDGFRB cause autosomal-dominant infantile myofibromatosis.Am J Hum Genet. 2013 Jun 6;92(6):1001-7. doi: 10.1016/j.ajhg.2013.04.024. Epub 2013 May 23. Am J Hum Genet. 2013. PMID: 23731542 Free PMC article.
-
PDGFRB and NOTCH3 Mutations are Detectable in a Wider Range of Pericytic Tumors, Including Myopericytomas, Angioleiomyomas, Glomus Tumors, and Their Combined Tumors.Mod Pathol. 2023 Mar;36(3):100070. doi: 10.1016/j.modpat.2022.100070. Epub 2023 Jan 10. Mod Pathol. 2023. PMID: 36788105
-
Corneal Infantile Myofibromatosis Caused by Novel Activating Imatinib-Responsive Variants in PDGFRB.Ophthalmol Sci. 2023 Dec 6;4(3):100444. doi: 10.1016/j.xops.2023.100444. eCollection 2024 May-Jun. Ophthalmol Sci. 2023. PMID: 38374928 Free PMC article.
-
Infantile Myofibromatosis With Intracranial Extradural Involvement and PDGFRB Mutation: A Case Report and Review of the Literature.Pediatr Dev Pathol. 2019 May-Jun;22(3):258-264. doi: 10.1177/1093526618787736. Epub 2018 Aug 13. Pediatr Dev Pathol. 2019. PMID: 30103666 Review.
-
[Cerebral autosomal dominant arteriopathy with subcortical infarcts and leukoencephalopathy (CADASIL)].Rinsho Byori. 2009 Mar;57(3):242-51. Rinsho Byori. 2009. PMID: 19363995 Review. Japanese.
Cited by
-
Notch signaling, hypoxia, and cancer.Front Oncol. 2023 Jan 31;13:1078768. doi: 10.3389/fonc.2023.1078768. eCollection 2023. Front Oncol. 2023. PMID: 36798826 Free PMC article. Review.
-
Notch Signaling in Vascular Endothelial and Mural Cell Communications.Cold Spring Harb Perspect Med. 2022 May 9;12(9):a041159. doi: 10.1101/cshperspect.a041159. Online ahead of print. Cold Spring Harb Perspect Med. 2022. PMID: 35534207 Free PMC article.
-
Notch signalling in healthy and diseased vasculature.Open Biol. 2022 Apr;12(4):220004. doi: 10.1098/rsob.220004. Epub 2022 Apr 27. Open Biol. 2022. PMID: 35472289 Free PMC article. Review.
-
Novel Cysteine-Sparing Hypomorphic NOTCH3 A1604T Mutation Observed in a Family With Migraine and White Matter Lesions.Neurol Genet. 2021 Apr 22;7(3):e584. doi: 10.1212/NXG.0000000000000584. eCollection 2021 Jun. Neurol Genet. 2021. PMID: 33898742 Free PMC article.
-
Roles of Notch Signaling in the Tumor Microenvironment.Int J Mol Sci. 2022 Jun 2;23(11):6241. doi: 10.3390/ijms23116241. Int J Mol Sci. 2022. PMID: 35682918 Free PMC article. Review.
References
LinkOut - more resources
Full Text Sources
Other Literature Sources
Molecular Biology Databases
Research Materials
Miscellaneous
