. 2021 Jan 29;371(6528):eaax2656.
doi: 10.1126/science.aax2656.

Expansion sequencing: Spatially precise in situ transcriptomics in intact biological systems

Collaborators, Affiliations

Expansion sequencing: Spatially precise in situ transcriptomics in intact biological systems

Shahar Alon et al. Science. .

Abstract

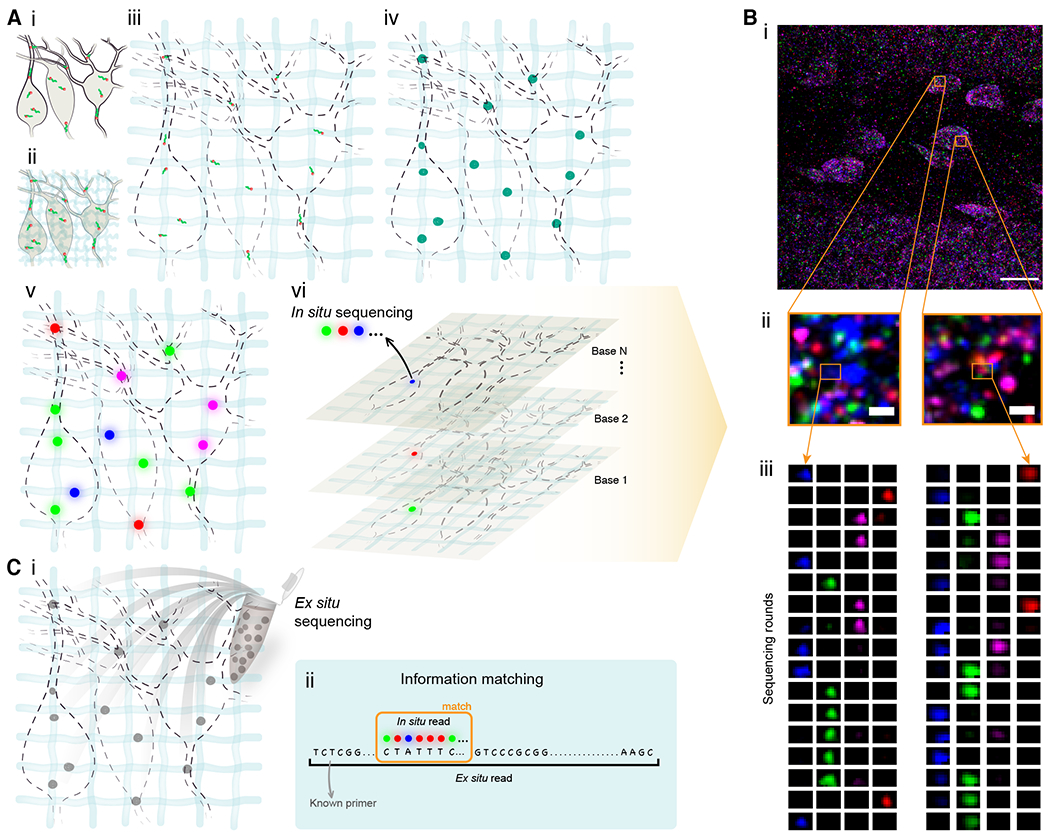
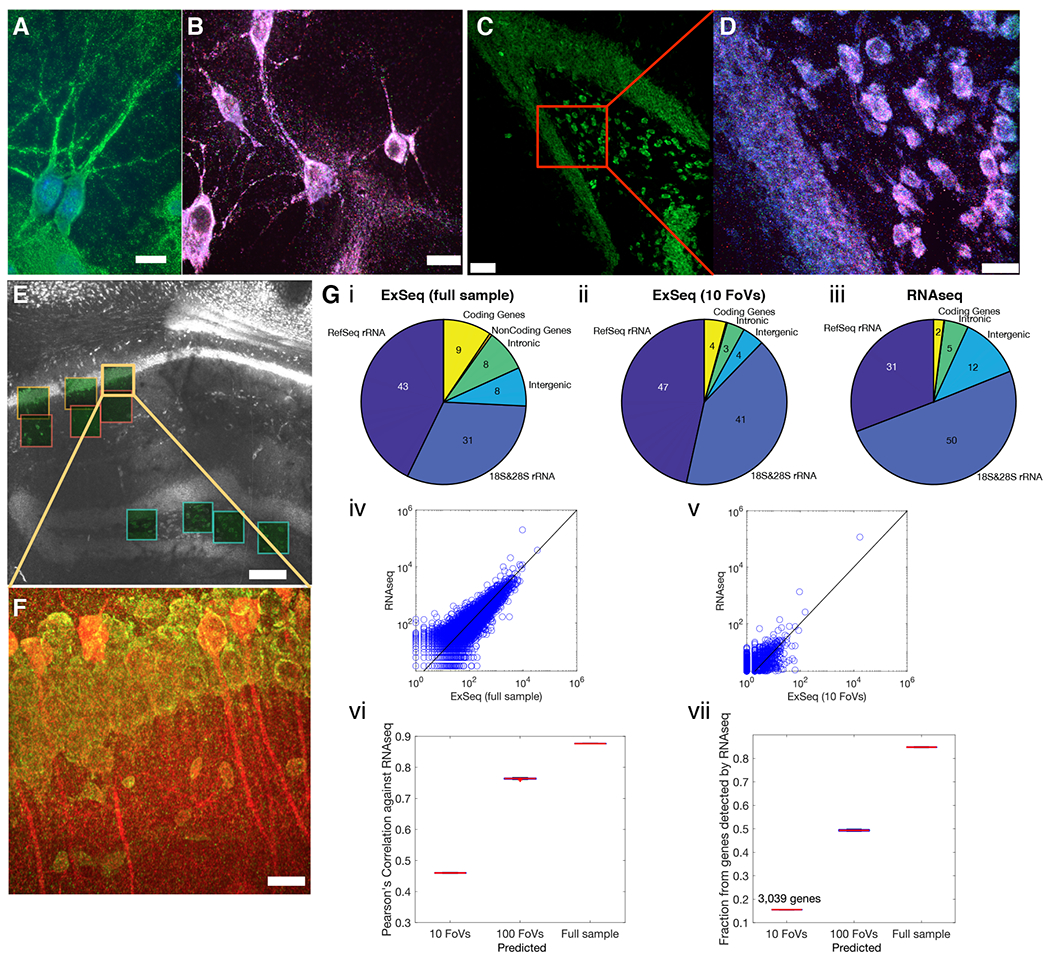
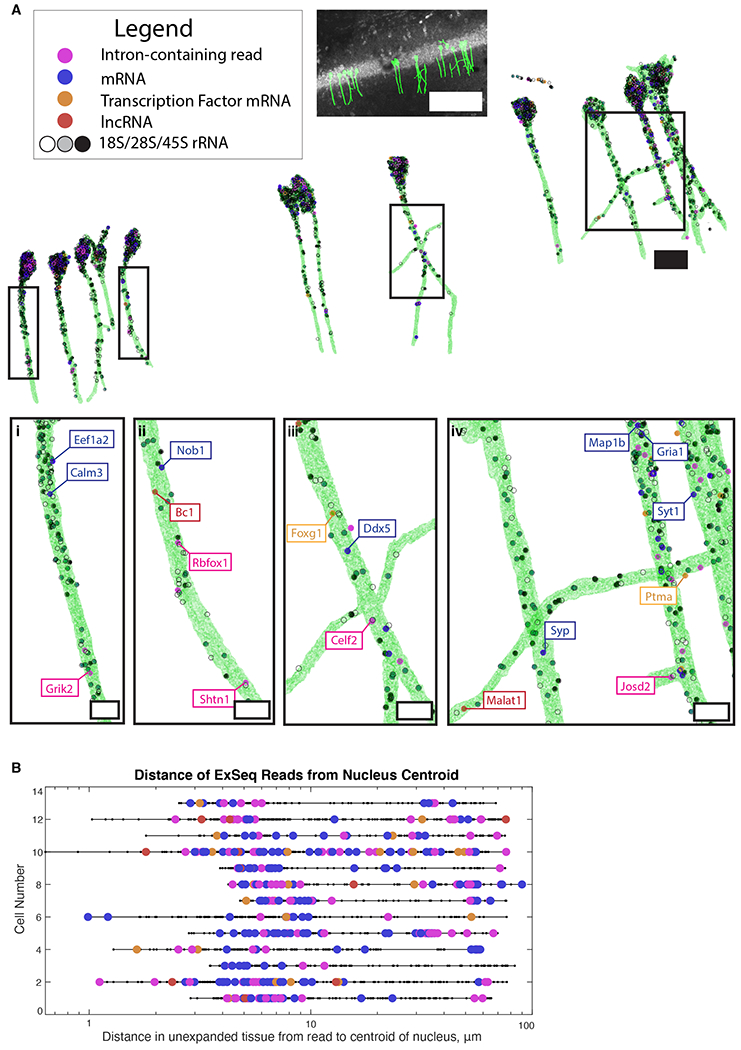
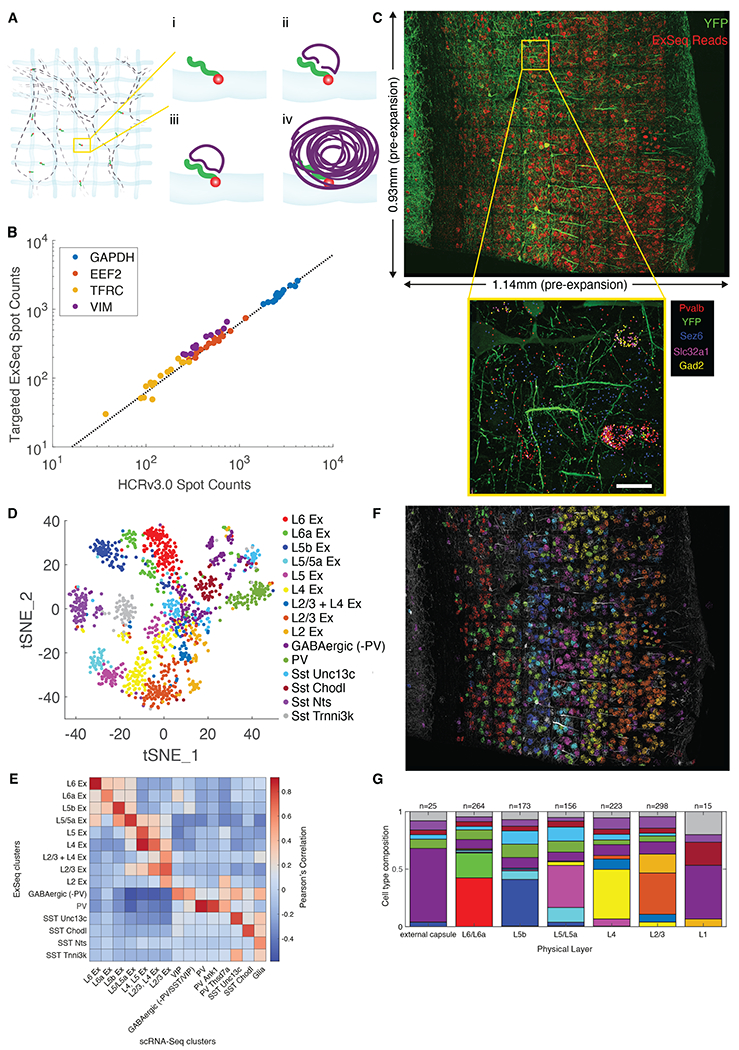
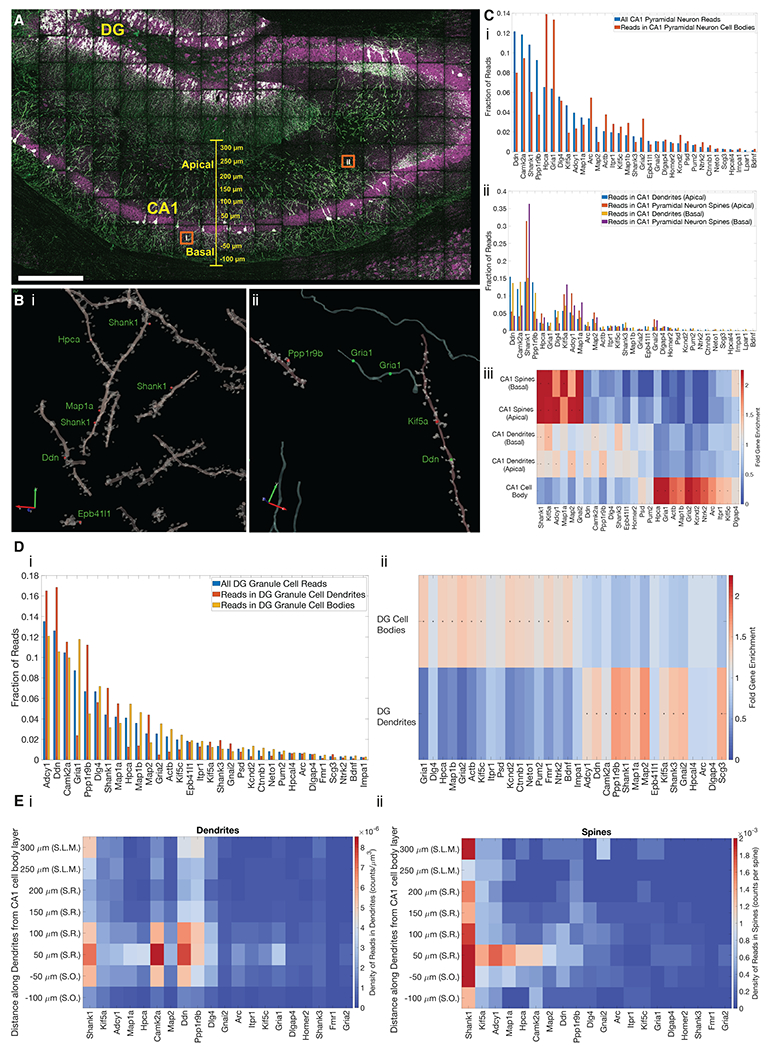
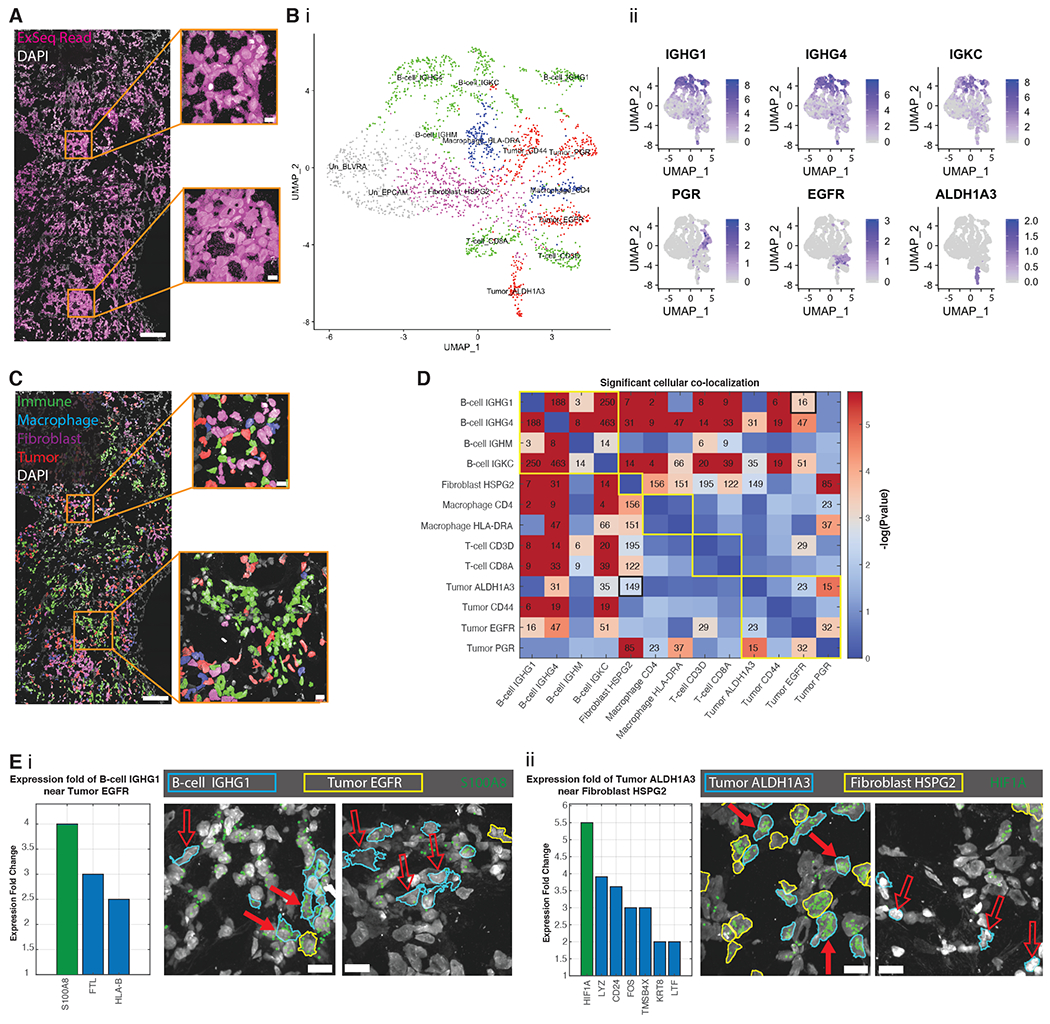
Methods for highly multiplexed RNA imaging are limited in spatial resolution and thus in their ability to localize transcripts to nanoscale and subcellular compartments. We adapt expansion microscopy, which physically expands biological specimens, for long-read untargeted and targeted in situ RNA sequencing. We applied untargeted expansion sequencing (ExSeq) to the mouse brain, which yielded the readout of thousands of genes, including splice variants. Targeted ExSeq yielded nanoscale-resolution maps of RNAs throughout dendrites and spines in the neurons of the mouse hippocampus, revealing patterns across multiple cell types, layer-specific cell types across the mouse visual cortex, and the organization and position-dependent states of tumor and immune cells in a human metastatic breast cancer biopsy. Thus, ExSeq enables highly multiplexed mapping of RNAs from nanoscale to system scale.


Conflict of interest statement

Competing interests: S.A., D.G., A.T.W., A.S., F.C., E.R.D., A.C.P., P.T., P.R., G.M.C., A.H.M. and E.S.B. are inventors on several patents relating to ExSeq. E.S.B. is a co-founder of Expansion Technologies, which has commercial interests in the space of expansion microscopy. F.C is a paid consultant of Celsius Therapeutics, and is a member of Celsius Thinklab. E.R.D. is a co-founder of ReadCoor, part of 10X Genomics, which has commercial interests in the space of expansion microscopy and FISSEQ.

Figures

Fig. 1.
Fig. 1.. Untargeted expansion sequencing (ExSeq) concept and workflow.
(A) ExSeq schematic. (i) A specimen is fixed, and RNA molecules (green) bound by an anchor (orange). (ii) The specimen is embedded in a swellable gel material (light blue, not to scale), mechanically softened, and then expanded with water (iii). RNA molecules are anchored to the gel. (iv) RNA molecules are reverse transcribed and amplified using FISSEQ (v) in situ sequencing. Colored dots indicate the colors used in the sequencing chemistry. (vi) In each sequencing round colors (blue, magenta, green, and red) reveal the current base of the cDNA. (B) Example of ExSeq from a 50 micron thick slice of mouse dentate gyrus. (i) One sequencing round, with two zoomed-in regions (ii), and puncta histories obtained over 17 rounds of in situ sequencing (iii). (C) Ex situ sequencing. (i) After in situ sequencing, cDNA amplicons are eluted from the sample, and resequenced ex situ with next-gen sequencing. (ii) In situ reads are matched to their longer ex situ counterparts, focusing on unique matches, augmenting the effective in situ read length. Scale bars: Bi, 17 microns (in biological, i.e. pre-expansion, units used throughout, unless otherwise indicated), Bii, 700 nanometers.
Fig. 2.
Fig. 2.. In situ sequencing in cells and tissues with untargeted ExSeq.
(A) Example of ExSeq library preparation in hippocampal culture (green, hybridization probe against amplified cDNA; blue, DAPI). (B) Maximum intensity projection of one sequencing round in hippocampal culture; color scheme as in Fig. 1B. (C) Low magnification image of ExSeq library preparation in a 15 𝜇m slice of mouse hippocampus (green, hybridization probe against amplified cDNA). (D) Maximum intensity projection of a higher magnification image of the specimen of C, focusing on one sequencing round; color scheme as in Fig. 1B. (E) Low magnification image of ExSeq library preparation in a 50 𝜇m slice of mouse hippocampus. Fields of view (FoVs) acquired with a higher magnification objective are shown as green squares. White, hybridization probe against amplified cDNA. (F) Maximum intensity projection of one FoV of panel E, with antibody staining post in situ sequencing (red, antibody against YFP; specimen from a Thy1-YFP mouse; green, hybridization probe against amplified cDNA). (G) Sequence analysis of ExSeq specimen shown in (E). (i-iii) RNA content obtained with ExSeq, either using ex situ sequencing data from the entire slice (i) or using ex situ data that correspond to in situ reads observed within the FoVs of panel E (ii), is comparable to the RNA content of an adjacent slice obtained with standard RNAseq (iii). Numbers inside the pie chart represent percentage of the total. (iv) Agreement between the normalized expression levels of all well-annotated genes (RefSeq genes) using RNAseq and ExSeq with full ex situ sequencing data as in i. (v) As in (iv), but using the 10 acquired FoVs, as in ii. (vi) Pearson’s correlation between the log-transformed expression of RefSeq genes using ExSeq and using RNAseq, as a function of the number of acquired FoVs (estimated by sampling from the full ex situ sequencing data to simulate the number of expected reads for 100 FoVs; (28)). The value for the 100 FoVs is plotted using the MATLAB boxplot function; central mark, median; bottom and top edges of the box, 25th and 75th percentiles, respectively. (vii) Fraction of RefSeq genes detected using ExSeq vs. RNAseq, as a function of the number of acquired FoVs (estimated by sampling from the full ex situ sequencing data to simulate the number of expected reads for 100 FoVs). Scale bars: A-D&F, 13μm E, 130μm. Note that deconvolution was used in panels D and F (28).
Fig. 3.
Fig. 3.. Untargeted ExSeq enables mapping of RNAs and their variants in dendrites of neurons.
(A) 3D render of Thy1-YFP CA1 neuronal morphology as determined by YFP antibody staining, containing RNA types as indicated. (i-iv), zoomed-in dendritic regions (boxed above). Scale bars: top, middle and bottom, 100, 20, and 5 microns, respectively. (B) Euclidean distance, relative to the center of the cell body, of sequencing reads for neurons in A. Color code, as in A.
Fig. 4.
Fig. 4.. Targeted ExSeq of transcripts specifying neuron types of mouse primary visual cortex.
(A) Targeted ExSeq library preparation: (i) RNA anchoring and expansion; (ii) padlock probe hybridization; (iii) probe ligation; (iv) rolling circle amplification. (B) Amplicon counts for targeted ExSeq vs. HCRv3.0-amplified ExFISH for the same transcript in the same HeLa cell (60 cells); slope, 0.62 (Pearson’s r = 0.991). (C) Targeted ExSeq of 42 cell type marker genes in Thy1-YFP mouse visual cortex. Top, maximum intensity projection image showing targeted ExSeq reads (red) and YFP (green). Bottom, localization of marker genes Pvalb (red), Sez6 (cyan), Slc32a1 (magenta), and Gad2 (yellow), with YFP (green). (D) Targeted ExSeq gene expression profiles of 1154 cells clustered into 15 cell types. Cluster legend and colors apply to panels D, F, and G. (E) Heatmap showing Pearson’s correlation between clusters identified in targeted ExSeq vs. a prior scRNA-seq study (60). (F) Spatial organization of cell types identified in (D). Cell-segmented reads are shown, colored by cluster assignment, and overlaid on YFP (white). (G) Layer-by-layer cell-type composition across segmented cortical layers. Scale bars: (C) bottom, 20 microns (pre-expansion).
Fig. 5.
Fig. 5.. Targeted ExSeq characterization of nanoscale transcriptomic compartmentalization in mouse hippocampal neuron dendrites and spines.
(A) Confocal image showing targeted ExSeq of a 34-panel gene set across slice of mouse hippocampus. Green, YFP; magenta, reads identified via ExSeq; white, reads localized within YFP-expressing cells. DG, dentate gyrus; CA1, CA1 region of hippocampus. (B) 3D reconstruction of dendrites, spines, and axons showing reads localized in spines (red dots) and processes (green dots) for regions indicated by orange boxes in A. (C) The abundance of transcripts in cellular compartments of CA1 pyramidal neurons: (i) abundance of transcripts in all cellular compartments vs. cell bodies; (ii) abundance of transcripts in apical and basal dendrites and spines; (iii) heat map showing the enrichment of transcripts in apical and basal dendritic and spine compartments of CA1 pyramidal neurons, vs. cell bodies; (*) indicates statistically significant enrichment (bootstrapped p-value <0.001). (D) The abundance of transcripts in cellular compartments of dentate gyrus (DG) granule cells; (i) abundance of transcripts in the cell bodies and dendrites of DG granule cells; (ii) heat map showing enrichment of transcripts in compartments of DG granule cells; (*) indicates statistically significant enrichment (bootstrapped p-value <0.001). (E) Plots showing the density of transcripts in the dendrites (i) and spines (ii) of CA1 pyramidal neurons along the apical-basal axis (Euclidean distance) of CA1, including regions S.R. (stratum radiatum), S.O. (stratum oriens), and S.L.M. (stratum lacunosum moleculare). Scale bars: A, 300 microns, Bi and Bii, 2 and 3 microns respectively, red and green arrows (pre-expansion).
Fig. 6.
Fig. 6.. Targeted ExSeq resolves maps of cell types and states in cancer.
(A) ExSeq resolves 771,904 reads in 2,395 cells (with >100 reads/cell) of 297 genes in a metastatic breast cancer biopsy. (B) Uniform manifold approximation and projection (UMAP) representation of PCA-based expression clustering reveals immune and tumor cell clusters, indicated by different colors: green (T-cells, B-cells), red (tumor cells), blue (macrophages), magenta (fibroblasts) and gray (un-annotated clusters, (28)) (i), which express known cell markers for immune cells (ii, top row) and tumor cells (ii, bottom row); expression projected onto UMAP as log2(1+counts). (C) Transcriptionally-defined cell clusters mapped onto tissue context (colors as in B(i)). (D) Spatial colocalization analysis of cell clusters. Adjacency matrix text values, number of cell pairs of indicated type that are in close proximity (nucleus centroid distance of <20 ¼m; robustness analysis in Fig. S26). Adjacency matrix heatmap, p-value (500,000 bootstrapping iterations) relative to obtaining the same or higher number of cells in close proximity by chance. Adjacency matrix entries with text values are statistically significant (Benjamini Hochberg false-discovery rate of 1.5%). Yellow borders along the diagonal illustrate major cell type categories (B-cell, fibroblast, macrophage, T-cell, Tumor); two black-bordered entries correspond to pairs shown in (E). (E) ExSeq analysis of cell state as a function of physical proximity, measured by calculating differential expression when cells of different kinds are spatially adjacent (<20¼m) vs. far apart. The gene with the largest fold change in a specific cell type when adjacent versus non-adjacent to another specific cell type is shown in green in the histogram (p-value = 1e-4 using 100,000 bootstrapping iterations, all other genes shown in the histogram have p-value < 0.05), as well as in the image showing the gene’s read locations in the original sample. (i), fold-change of gene expression in IGHG1-positive B cells when in proximity to EGFR-positive tumor cells (B cells and tumor cells shown with blue and yellow boundaries, respectively). Solid arrows, cells in close proximity; hollow arrows, cells not in close proximity. (ii), fold-change of gene expression in ALDH1A3-positive tumor cells when in proximity to HSPG2-positive fibroblasts (tumor and fibroblast cells shown with blue and yellow boundaries, respectively). Scale bars: (A) and (C) 100 microns, and 10 microns for the insets, (E) 10 microns (pre-expansion).

Comment in

References

    1. Crosetto N, Bienko M, van Oudenaarden A, Spatially resolved transcriptomics and beyond. Nat. Rev. Genet 16, 57–66 (2015). - PubMed
    1. Gregor T, Garcia HG, Little SC, The embryo as a laboratory: quantifying transcription in Drosophila. Trends Genet. 30, 364–375 (2014). - PMC - PubMed
    1. Alon S, Huynh GH, Boyden ES, Expansion microscopy: enabling single cell analysis in intact biological systems. FEBS J. 286, 1482–1494 (2019). - PMC - PubMed
    1. Moor AE et al., Global mRNA polarization regulates translation efficiency in the intestinal epithelium. Science. 357, 1299–1303 (2017). - PMC - PubMed
    1. Halpern KB et al., Single-cell spatial reconstruction reveals global division of labour in the mammalian liver. Nature. 542, 352–356 (2017). - PMC - PubMed

Publication types