. 2021 Jan 28;12(1):641.
doi: 10.1038/s41467-021-20975-1.

Cryptic terrestrial fungus-like fossils of the early Ediacaran Period

Affiliations

Cryptic terrestrial fungus-like fossils of the early Ediacaran Period

Tian Gan et al. Nat Commun. .

Abstract

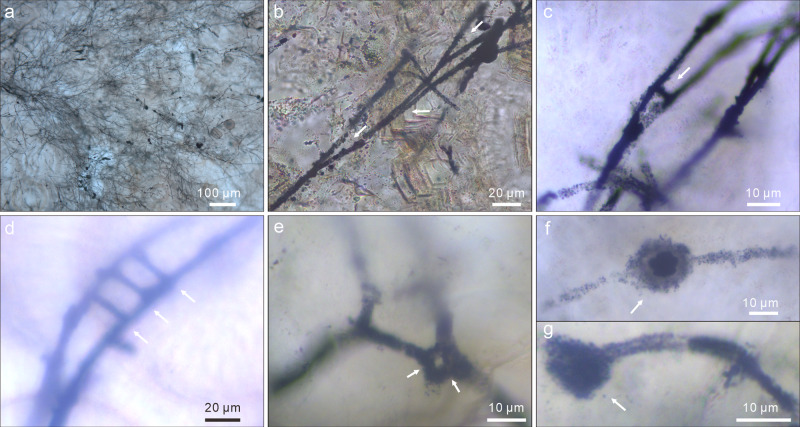
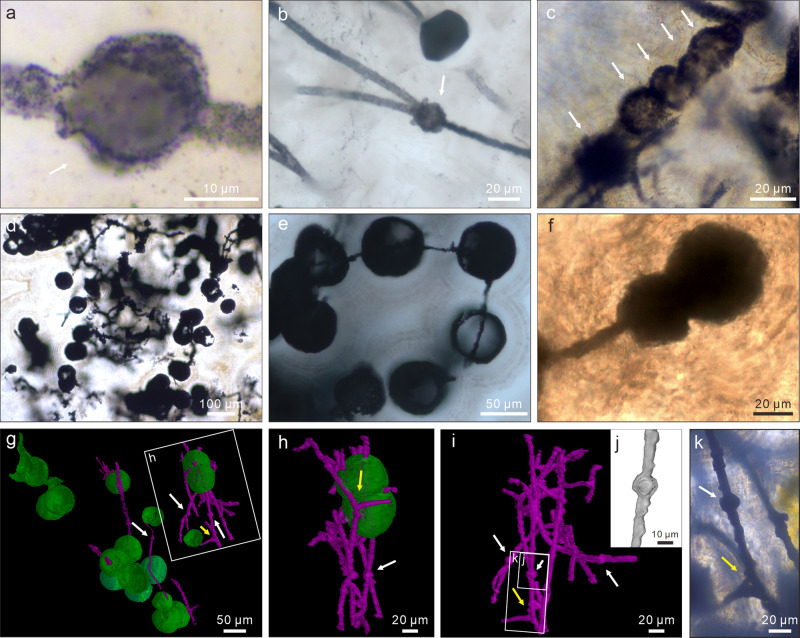
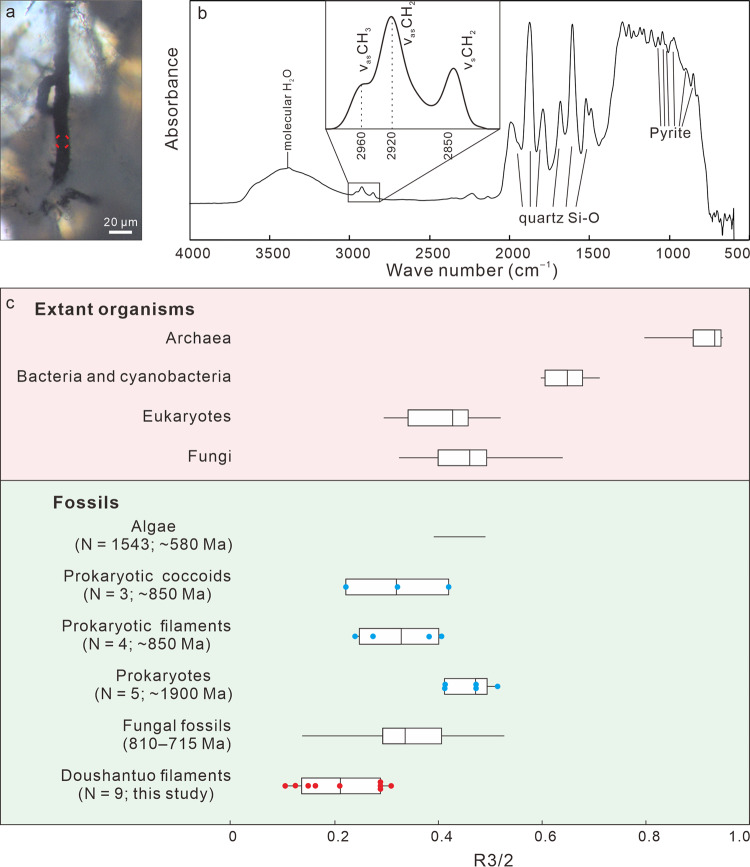
The colonization of land by fungi had a significant impact on the terrestrial ecosystem and biogeochemical cycles on Earth surface systems. Although fungi may have diverged ~1500-900 million years ago (Ma) or even as early as 2400 Ma, it is uncertain when fungi first colonized the land. Here we report pyritized fungus-like microfossils preserved in the basal Ediacaran Doushantuo Formation (~635 Ma) in South China. These micro-organisms colonized and were preserved in cryptic karstic cavities formed via meteoric water dissolution related to deglacial isostatic rebound after the terminal Cryogenian snowball Earth event. They are interpreted as eukaryotes and probable fungi, thus providing direct fossil evidence for the colonization of land by fungi and offering a key constraint on fungal terrestrialization.


Conflict of interest statement

The authors declare no competing interests.

Figures

Fig. 1
Fig. 1. Geological maps, sample locality, and stratigraphic columns of terminal Cryogenian Nantuo Formation and Ediacaran Doushantuo-Dengying formations at Datang and Beidoushan sections, Weng’an, Guizhou Province, South China.
a Map showing major tectonic units and location of Weng’an area in South China, drawn by authors. b Geological map of Weng’an area, adopted from ref. with permission, showing sample locality at Datang and Beidoushan. c, d Stratigraphic columns of Datang (c) and Beidoushan (d) sections. Stratocolumn of Datang section drawn by authors based on the description in ref. and stratocolumn of Beidoushan section adopted from ref. with permission. Unit D1 is the cap dolostone. Fm. = Formation. Data source of radiometric age: 599.3 ± 4.2 Ma—ref. . See Supplementary Note 1 for a detailed stratigraphic description.
Fig. 2
Fig. 2. TLM, CLSM, and Raman micrographs of Type A filaments and associated spheres.
a Aggregate of Type A filaments associated with small spheres. Filaments are embedded in and sometimes cut by chalcedony botryoids (yellow arrows). Note branching filaments (white arrows), ladder-like branching systems (uppermost and rightmost white arrows), and small spheres (double-headed white arrows). b–d Filaments with multiple orders of branching (e.g., arrows in c). Note short lateral branches (arrows in b and d) and small sphere (lower central in c). e Branching filaments with two short, secondary lateral branches (arrows) approaching toward each other. f A-like branching system (arrow). g Magnification of central right in a, showing ladder-like branching system and two small spheres coaxially aligned with filaments. h CLSM micrograph corresponding to larger box in g (see Supplementary Movie 1). i Raman map of pyrite (peak at ~380 cm–1), corresponding to smaller box in g. j, k Anastomosed networks of filaments. Arrows in k denote associated larger spheres. For each illustrated specimen in this and other figures, its repository information is given in Supplementary Table 3.
Fig. 3
Fig. 3. TLM photomicrographs of Type B filaments and associated small spheres.
a Aggregate of Type B filaments. b Multiple orders of branches (arrows). c A-like branching system (arrow). d, e Ladder-like or H-like branching systems (arrows). f Small intercalary sphere (arrow) coaxially aligned with a filament. g Small terminal sphere (arrow) attached to a filament.
Fig. 4
Fig. 4. TLM photomicrographs, SRXTM surface renderings, and SRXTM cut-away view of spheres associated with Type A filaments.
a Small intercalary sphere (arrow) coaxially aligned with a filament. b Small intercalary sphere (arrow) at bifurcation of a branching filament. c Small concatenated spheres (arrows) coaxially aligned with a filament. d Large spheres. e Large spheres coaxially aligned with and penetrated by filaments. f Concatenated spheres coaxially aligned with a filament. Terminal sphere is larger. gi SRXTM surface renderings (see Supplementary Movie 2), showing large spheres (green), small spheres (white arrows), filaments (purple), and branching filaments (yellow arrows). h corresponds to labeled box in g. j SRXTM cut-away view of labeled rectangle in i, showing hollow nature of small sphere. k TLM photomicrograph of labeled rectangle in i, showing small sphere (white arrow) and branching filaments (yellow arrow).
Fig. 5
Fig. 5. Morphological reconstruction and frequency distribution of filament diameter.
a, b Sketches of Type A (a) and Type B (b) filaments and associated spheres. c Frequency distribution of filament diameter of microfossils from Datang. N = 119 filaments for Type A filament and N = 80 filaments for Type B filament.
Fig. 6
Fig. 6. FTIR of Type A filament from Beidoushan.
a TLM photomicrograph of Type A filament, with red circle denoting spot of FTIR analysis shown in b. b FTIR spectrum, with enlargement of 2800–3000 cm–1 spectral region (inset). Bands at 2960 cm–1, 2920 cm–1, and 2850 cm–1 are due to asymmetric aliphatic CH3 (end-methyl), asymmetric, and symmetric aliphatic CH2 (methylene-chain), respectively,. Relative intensities of 2960 cm–1 and 2920 cm–1 bands were used to calculate R3/2 ratios that reflect ratios of -CH3 to -CH2 groups. Band at ~3400 cm–1 is due to molecular water; bands at 1992, 1875, 1792, 1683, 1608, 1522, and 1490 cm–1 are due to Si–O bonds of quartz; bands at 1071, 1045, 1024, 974, 852, and 826 cm–1 are probably due to pyrite. c, Box-and-whisker plot of R3/2 ratios of representative modern organisms and fossils. Plots for extant archaea, prokaryotes, eukaryotes, and fungi, as well as 810–715 Ma fungal fossils are from ref. and references therein. Data for fossil algae (N = 1543 spot analyses in three specimens) are from ref. . Data for fossil prokaryotic coccoids (blue dots; N = 3 specimens), prokaryotic filaments (blue dots; N = 4 specimens), and prokaryotes (blue dots; N = 5 specimens) are measured from fig. 5a of ref. using ImageJ 1.47 v. Data for Doushantuo filaments (red dots; N = 9 spot analyses in two filaments) are based on analyses of sample 18BD-25 from Beidoushan. Box-and-whisker plots show the median (central line), the minimum and maximum (whiskers), and the 25th–75th percentile (bounds of the box), whereas horizontal line for fossil algae show the minimum and maximum. Source data are provided as a Source Data file.
Fig. 7
Fig. 7. Light microscopic images and Raman spectra of Type A and Type B filaments.
a, b TLM (a) and reflected light microscopy (RLM) (b) photomicrographs of the same Type A filament. c TLM photomicrograph of Type B filament. d, e Raman spectra of Type A and Type B filaments acquired on locations marked by circular dots in a and c, respectively, showing characteristic bands for low-grade carbonaceous material, including D1-band at ~1350 cm–1 and G-band at ~1580 cm–1 in the first order region (1100–1800 cm–1), and bands at ~2700 and ~2900 cm–1 in the second-order region. Raman bands at ~340 and ~380 cm–1 are characteristic of pyrite (FeS2). Both analyzed filaments are from Datang (sample 17DT-A-9).

References

    1. Kenrick P, Wellman CH, Schneider H, Edgecombe GD. A timeline for terrestrialization: consequences for the carbon cycle in the Palaeozoic. Philos. Trans. R. Soc. B. 2012;367:519–536. doi: 10.1098/rstb.2011.0271. - DOI - PMC - PubMed
    1. Kennedy M, Droser M, Mayer LM, Pevear D, Mrofka D. Late Precambrian oxygenation; inception of the clay mineral factory. Science. 2006;311:1446–1449. doi: 10.1126/science.1118929. - DOI - PubMed
    1. Naranjo-Ortiz MA, Gabaldón T. Fungal evolution: major ecological adaptations and evolutionary transitions. Biol. Rev. 2019;94:1443–1476. doi: 10.1111/brv.12510. - DOI - PMC - PubMed
    1. Heckman DS, et al. Molecular evidence for the early colonization of land by fungi and plants. Science. 2001;293:1129–1133. doi: 10.1126/science.1061457. - DOI - PubMed
    1. Lutzoni F, et al. Contemporaneous radiations of fungi and plants linked to symbiosis. Nat. Commun. 2018;9:5451. doi: 10.1038/s41467-018-07849-9. - DOI - PMC - PubMed

Publication types