Comparative Study
. 2021 Jan 28;11(1):2478.
doi: 10.1038/s41598-021-81058-1.

Comparison of DNA repair and radiosensitivity of different blood cell populations

Affiliations
Comparative Study

Comparison of DNA repair and radiosensitivity of different blood cell populations

Daniel Heylmann et al. Sci Rep. .

Abstract

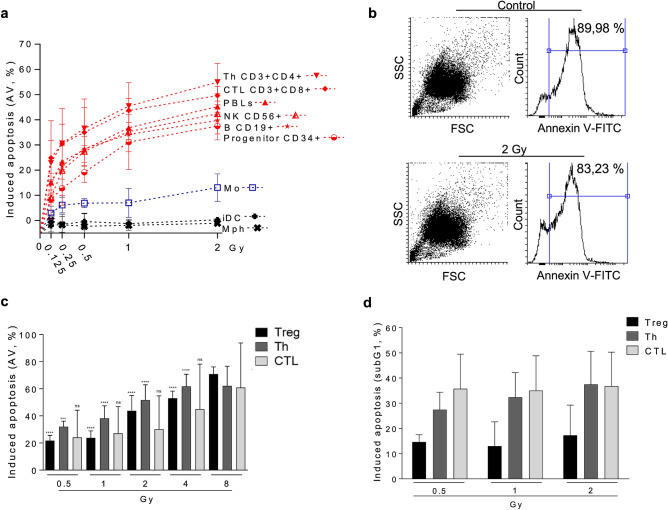
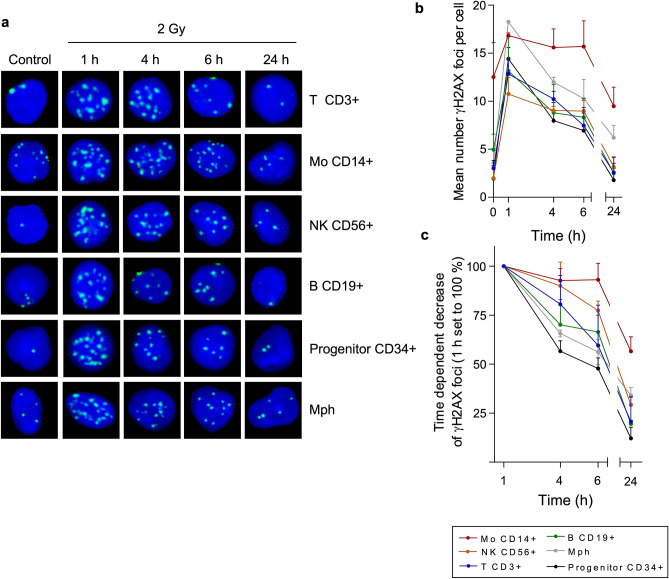
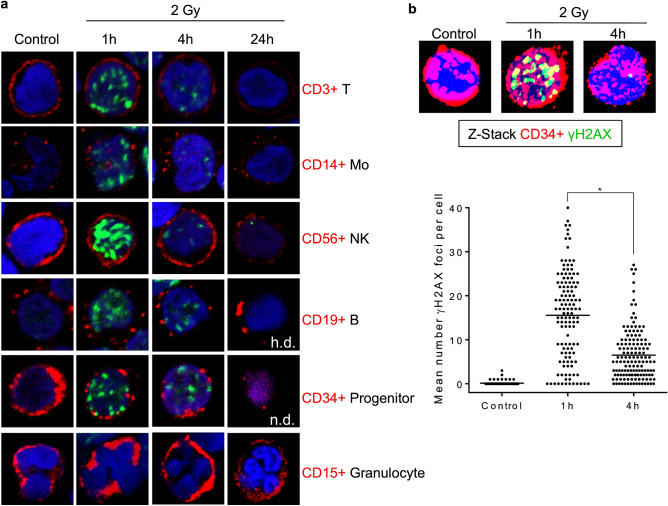
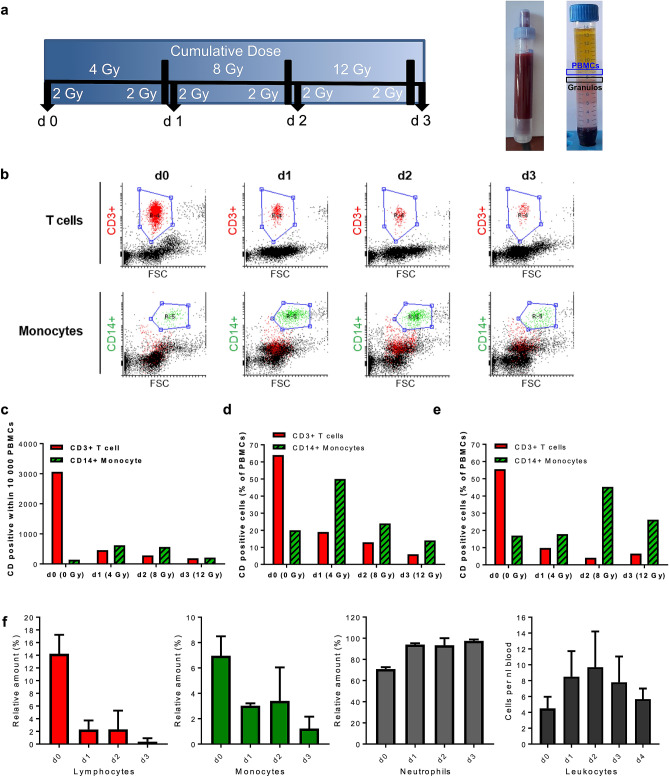
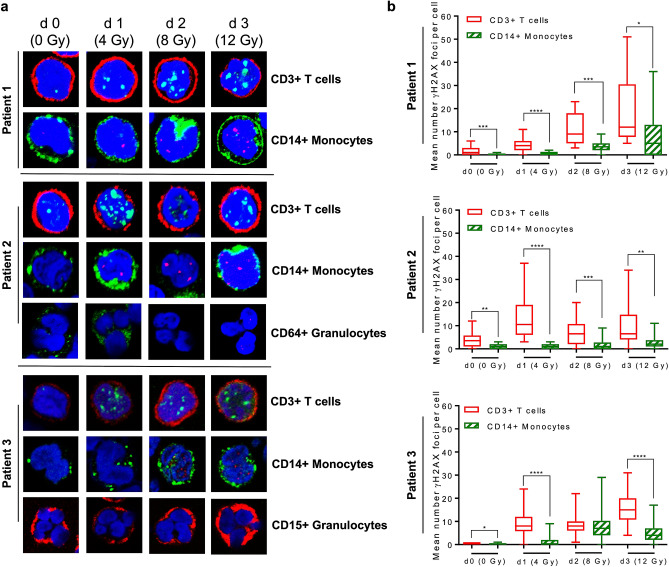
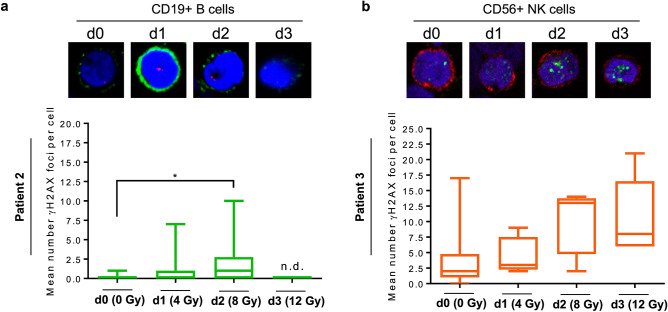
Despite the frequent use of ionising radiation (IR) in therapy and diagnostics and the unavoidable exposure to external radiation sources, our knowledge regarding the radiosensitivity of human blood cell populations is limited and published data, obtained under different experimental conditions, are heterogeneous. To compare the radiosensitivity of different hematopoietic cell populations, we set out to determine the responses of cells obtained from peripheral blood of healthy volunteers under identical conditions (resting, non-stimulated cells). First, we measured the radiation response of T cells (Treg, Th, CTL), B cells, NK cells, CD34+ progenitor cells and monocytes obtained from peripheral blood and monocyte-derived macrophages (Mph) and immature dendritic cells (iDC) ex vivo and show that T and B cells are highly sensitive, starting to undergo apoptosis following IR with a dose as low as 0.125 Gy. Importantly, there was no clear threshold dose and cell death/apoptosis increased up to a saturation level with a dose of 2 Gy. The sensitivity decreased in the order of T cells > NK and B cells > monocytes > macrophages and iDC. The data confirm a previous report that Mph and iDC are radiation-resistant compared to their progenitor monocytes. Although non-stimulated T and B cells were highly radiation-sensitive compared to monocytes and macrophages, they were competent in the repair of DNA double-strand breaks, as shown by a decline in γH2AX foci in the post-exposure period. CD34+ cells obtained from peripheral blood also showed γH2AX decline post-exposure, indicating they are repair competent. Granulocytes (CD15+) did not display any γH2AX staining following IR. Although peripheral blood lymphocytes, the main fraction are T cells, were significantly more radiation-sensitive than monocytes, they displayed the expression of the repair proteins XRCC1, ligase III and PARP-1, which were nearly non-expressed in monocytes. To assess whether monocytes are depleted in vivo following IR, we measured the amount of T cells and monocytes in cancer patients who received total-body radiation (TBR, 6 × 2 Gy). We observed that the number of T cells in the peripheral blood significantly declined already after the first day of TBR and remained at a low level, which was accompanied by an increase in the number of γH2AX foci in the surviving CD3+ T cell fraction. In contrast, the number of monocytes did not decline extensively, reflecting their radiation resistance compared to T cells. Monocytes also showed an accumulation of γH2AX foci in vivo, but the levels were significantly lower than in T cells. CD56+ NK cells displayed a response similar to T cells. The data support the notion that unstimulated T cell subfractions are nearly equally radiation sensitive. There are, however, remarkable differences in the radiation sensitivity between the lymphoid and the myeloid lineage, with lymphoid cells being significantly more sensitive than cells of the myeloid lineage. In the myeloid lineage, macrophages and iDCs were the most radio-resistant cell types.


Conflict of interest statement

The authors declare no competing interests.

Figures

Figure 1
Figure 1
Radiation-induced cell death of different blood cells from the myeloid and lymphoid lineage. (a) After radiation treatment, significantly more cells of the lymphoid lineage (Th, CTL, NK cells, B cells and CD34 progenitor cells) undergo radiation-induced cell death compared to monocytes and the radioresistant iDC and Mph. Apoptosis was determined by annexin V-flow cytometry 24 h after treatment. Mean value, SD, n = 3. Data for Th, CTL, PBLs and CD34+ are from ref where they were shown in a different context. (b) Granulocytes showed already a high basal level of cell death, independent from radiation treatment, as revealed by annexin V-staining. (c) Radiation-induced cell death of Treg, Th and CTL purified with magnetic beads. Data for 0.5 and 1 Gy are from ref. At 0.5 Gy, regulatory T cells are more resistant to IR compared to Th. CTL showed high interexperimental variations. Mean value, SD, n = 3. The induced frequencies were significantly above the control levels (which are shown in Fig. S1c), ns, not significant; *p < 0.05, **p < 0.01. (d) Radiation-induced apoptotic DNA fragmentation in Treg, Th and CTL as analysed by the subG1-assay. There was a tendency for Treg to undergo less DNA fragmentation than Th and CTL. Mean value +/− SD, n = 3–4.
Figure 2
Figure 2
DNA repair kinetics of blood cells from the myeloid and lymphoid lineage assessed by γH2AX foci staining. (a) γH2AX foci determined by the metafer scanning system in different blood cell populations 1 up to 24 h after 2 Gy IR. After 1 h, there was a maximum of the γH2AX signal detectable, which declined time-dependently in all blood cells to the basal level. Nucleus, blue; γH2AX foci, green (b) Absolute number of γH2AX foci. Monocytes showed already a high level of γH2AX foci in the untreated control. Mean value, SD, n = 3 to 4. Cell counts per experiment (min–max): B cells, 300–314; NK cells, 299–307; T cells, 300–316; CD34, 56–305; CD14, 30–305; Mph, 238–303. (c) Relative amount of γH2AX foci (the 1 h value was set to 100%). NK cells, T cells, B cells macrophages and CD34 progenitor cells showed efficient DNA repair of IR-induced DNA damage obtained by γH2AX staining. Monocytes showed a high basal level (presumably due to lack of immediate-early repair) and up to 6 h a lack of foci decline.
Figure 3
Figure 3
Staining of γH2AX (green) and CD surface markers (red) of different blood cell types purified from buffy coat. (a) Representative pictures of unirradiated cells (control) and samples 1 and 24 h after 2 Gy IR. A maximum of γH2AX foci accumulate 1 h after exposure to 2 Gy. γH2AX foci disappear 24 h after radiation implicating effective repair of IR-induced DNA double-strand breaks. CD19+ B cells are hardly detectable (h.d.) on the slide 24 h after treatment. Furthermore, no CD34+ progenitor cells could be found on the slide 24 h post-irradiation (n.d. not detectable). Granulocytes, shown in combination with the CD15 marker, did not show any IR-induced formation of γH2AX foci. (b) Quantification of γH2AX foci in CD34+ progenitor cells 1 and 4 h after 2 Gy IR. Representative 3 dimensional pictures (Z-stacks) recorded by the LSM are displayed above the graph. The decrease of γH2AX foci over time indicates an efficient repair of DNA double-strand breaks in CD34+ progenitor cells. n = 3, in total 84–142 cells per box. t-test, *p < 0.05.
Figure 4
Figure 4
Treatment scheme of leukaemia patients, blood sampling during whole-body irradiation and influence of radiation on the number of T cells (CD3+) and monocytes (CD14+) in peripheral blood following total-body radiation. (a) Patients received a cumulative dose of 12 Gy, fractionated in 2 × 2 Gy per day. Blood sampling at day 0 (d0) occurred before the first 2 × 2 Gy fraction was administered (non-irradiated control). Blood samples on d1 and d2 were taken every morning before the patients were treated with further 2 × 2 Gy. The d3 blood sample marks the last day after cumulative 12 Gy of irradiation. Purification of PBMC and granulocytes was performed by polymorphprep™ density centrifugation. (b) Blood counts of CD3+ (T cells) and CD14+ (monocytes) cells in the PBMC fraction from one patient determined by flow cytometry. From day zero on, there was a clear decrease of T cells in the peripheral blood. Monocytes show at d1 and d2 a relative increase in the PBMC population. (c) Quantification of CD3+ T cells and CD14+ monocytes in PBMC of the patient indicated in (b). (d,e) Amount of CD3+ T cells and CD14+ monocytes determined in the PBMC samples obtained from two different patients. The determination occurred on stained slides by LSM (100 cells each). The data indicate a time-dependent decrease in the T cell number, while monocytes even displayed an accumulation at d1 and d2. (f) Relative amount of lymphocytes, monocytes and neutrophiles and total amount of leukocytes in the peripheral blood of patients during the TBR period. Data obtained from up to 8 patients are pooled and presented as mean +/− SD.
Figure 5
Figure 5
γH2AX staining in T cells (CD3+), monocytes (CD14+) and granulocytes (CD64+ or CD15+) isolated from patients during total-body radiation. (a) Representative images are shown of γH2AX foci (red or green) and CD surface marker (green or red) of PBMC at day 0 up to day 3 obtained from three different patients. Similar to what we observed for ex vivo irradiated granulocytes obtained from peripheral blood, no γH2AX foci could be detected in granulocytes upon exposure to ionising radiation in vivo. (b) Quantification of γH2AX foci in T cells and monocytes. In T cells significantly more γH2AX foci were induced following increasing cumulative doses of IR compared to monocytes. Depending on the yield and quality of the sample, 11 to 50 cells were counted per day and patient (Patient 1, 11 up to 20 cells; Patient 2, each data set 20 cells; Patient 3 each data set 50 cells). Box plots, t-test, *p < 0.05, **p < 0.01, ***p < 0.001, ****p < 0.0001.
Figure 6
Figure 6
Quantification of γH2AX foci in (a) CD19+ B cells (CD19, green; γH2AX, red) and (b) CD56+ NK cells (CD56, red; γH2AX, green) of patients following total body radiation. Representative images are shown. (a) B cells: 20 CD19+ B cells were quantified per sample. No CD19+ B cells could be found on the slide at d3 (n.d., not detectable). In general, there were only small amounts of γH2AX foci induced in B cells, with a maximum of 1 focus per cell at day 2 (t-test, *p < 0,05). (b) NK cells: At d1, d2 and d3 only very low numbers of CD56+ NK cells could be found on the slides because of high cytotoxicity. The surviving cells showed an increase of γH2AX foci with cumulative dosage.

References

    1. Louagie H, Van Eijkeren M, Philippe J, Thierens H, de Ridder L. Changes in peripheral blood lymphocyte subsets in patients undergoing radiotherapy. Int. J. Radiat. Biol. 1999;75:767–771. doi: 10.1080/095530099140113. - DOI - PubMed
    1. Yarilin AA, et al. Late T cell deficiency in victims of the Chernobyl radiation accident: possible mechanisms of induction. Int. J. Radiat. Biol. 1993;63:519–528. doi: 10.1080/09553009314550681. - DOI - PubMed
    1. Clift RA, et al. Allogeneic marrow transplantation in patients with acute myeloid leukemia in first remission: a randomized trial of two irradiation regimens. Blood. 1990;76:1867–1871. doi: 10.1182/blood.V76.9.1867.1867. - DOI - PubMed
    1. Rodel F, et al. Immunomodulatory properties and molecular effects in inflammatory diseases of low-dose x-irradiation. Front. Oncol. 2012;2:120. doi: 10.3389/fonc.2012.00120. - DOI - PMC - PubMed
    1. Montero A, et al. Is it time to redefine the role of low-dose radiotherapy for benign disease? Ann Rheum Dis. 2020;79:e34. doi: 10.1136/annrheumdis-2018-214873. - DOI - PubMed

Publication types

MeSH terms