. 2021 Jan 28;11(1):2492.
doi: 10.1038/s41598-021-81153-3.

Graphite to diamond transition induced by photoelectric absorption of ultraviolet photons

Affiliations

Graphite to diamond transition induced by photoelectric absorption of ultraviolet photons

Ana I Gómez de Castro et al. Sci Rep. .

Abstract

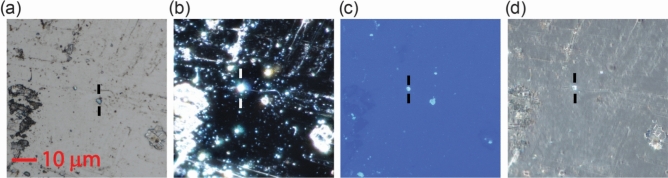
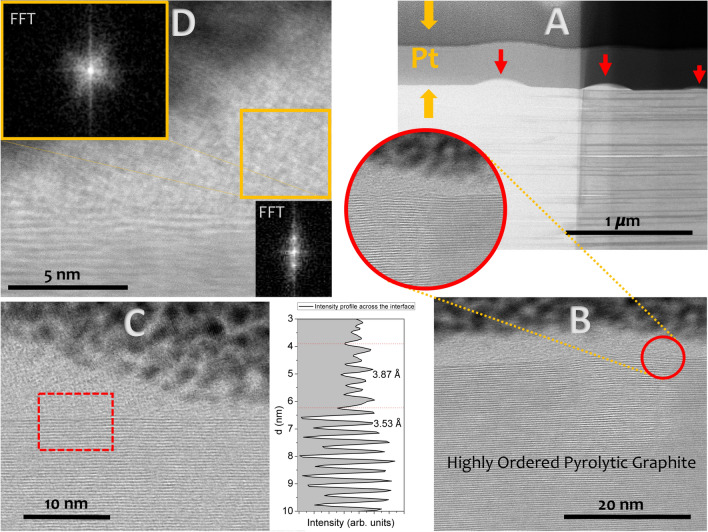
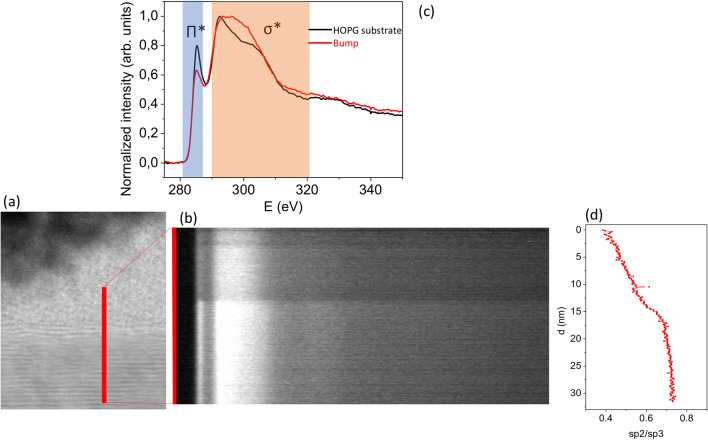
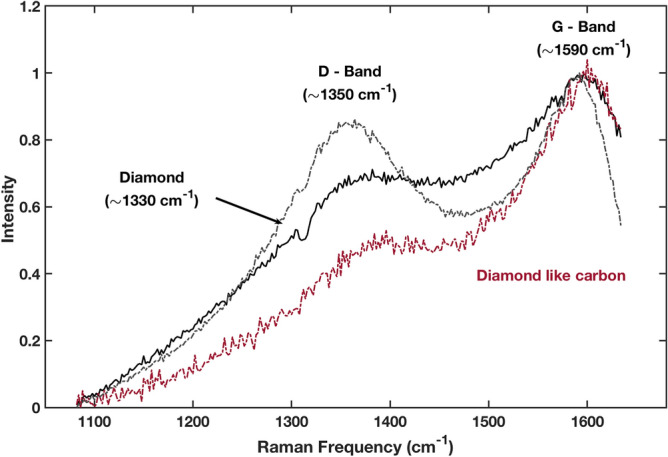
The phase transition from graphite to diamond is an appealing object of study because of many fundamental and also, practical reasons. The out-of-plane distortions required for the transition are a good tool to understand the collective behaviour of layered materials (graphene, graphite) and the van der Waals forces. As today, two basic processes have been successfully tested to drive this transition: strong shocks and high energy femtolaser excitation. They induce it by increasing either pressure or temperature on graphite. In this work, we report a third method consisting in the irradiation of graphite with ultraviolet photons of energies above 4.4 eV. We show high resolution electron microscopy images of pyrolytic carbon evidencing the dislocation of the superficial graphitic layers after irradiation and the formation of crystallite islands within them. Electron energy loss spectroscopy of the islands show that the sp2 to sp3 hybridation transition is a surface effect. High sensitivity X-ray diffraction experiments and Raman spectroscopy confirm the formation of diamond within the islands.


Conflict of interest statement

The authors declare no competing interests.

Figures

Figure 1
Figure 1
Optical microscope image of the HOPG sample after 13 h of UV irradiation: field (a), dark field (b), fluorescence (c) and polarization (d) set ups. Crystallites are formed at some locations on the surface (one of them is marked in the images). The rest remains apparently unaltered. Increasing the exposure time increases the number of crystallites formed.
Figure 2
Figure 2
Annular bright field (ABF) images of the irradiated HOPG sample; the magnification of the images increases from (A) to (D) panels. (A) The low magnification image shows bumps or islands of hundreds of nm marked with a red arrow that are formed after UV irradiation of the sample (the change in the contrast is due the thickness gradient of the sample produced during FIB preparation). (B) High resolution ABF images show the dislocation of the HOPG layered structure at the irradiated surface (red circle). A cover a few nanometers thick forms between the HOPG and the environment. (C) High resolution ABF image of a bump; the separation between the graphene layers is plotted in the bottom right panel. There is a transitional area where separation between the layers increases from 3.53 to 3.87 Å. (D) Some apparently cubic structures form within the bump; the FFT shows the marked differences between the HOPG layered structure (bottom right inset) and the rotated patter in the bump (upper left inset).
Figure 3
Figure 3
Electron energy loss spectra (EELS) of the UV processed HOPG: (a) Location of the slit on the material, (b) long-slit spectra, (c) averaged spectra in the HOPG substrate and in the bump. In (c) the location of the spectral signature of graphite’s Π* bond is marked. Note that the Π* bond signature is weaker in the bump but still present, meaning that the bump is not pure diamond. The ratio of the signal in the Π* and σ* spectral bands (c) is used to define the sp2/sp3 index that it is displayed in (d). The signal in the Π* spectral band is minimal on the surface and increases inwards.
Figure 4
Figure 4
(ac) images of carbon fibres: (a) high resolution image obtained with the electron microscope JSM 6400 from the National Centre of Microscopy of Spain; (b) optical  microscope image of a fibre before irradiation and (c) after irradiation. The results from the X-ray diffraction measurements with CHESS are displayed in (df): (d) schematic drawing of the experimental geometry; (e) X-ray pole figure collected at the scattering angle corresponding to the diamond (1, 1, 1) Bragg peak [Q = 3.035–3.065 Å−1]; (f) X-ray pole figure collected at the scattering angle corresponding to the diamond (2, 2, 0) Bragg peak [Q = 3.50–3.54 Å−1]. The existence of well-defined Bragg peaks in (e) and (f) provides strong evidence of crystalline diamond in the irradiated fibres.
Figure 5
Figure 5
Calculated electron yield from graphite caused by the irradiation with the commercial L10366 Hamamatsu Deuterium lamp. The calculations have been made using the known yield from bulk graphite which is the least favourable case.
Figure 6
Figure 6
Raman spectra at several locations in the carbon fibre. The red spectrum is similar to the diamond like carbon spectrum and obtained in the main body of the fibre. The black spectra have been obtained on the crystallites, at two different locations.

References

    1. Frondel C, Marvin UB. Lonsdaleite, a hexagonal polymorph of diamond. Nature. 1967;217:587–589. doi: 10.1038/214587a0. - DOI
    1. Hanneman RE, Strong HM, Bundy FP. Hexagonal diamonds in meteorites: Implications. Science. 1967;155:995–997. doi: 10.1126/science.155.3765.995. - DOI - PubMed
    1. Lewis RS, Ming T, Wacker JF, Anders E, Steel E. Interstellar diamonds in meteorites. Nature. 1987;326:160–162. doi: 10.1038/326160a0. - DOI
    1. Nemeth P, et al. Lonsdaleite is faulted and twinned cubic diamond and does not exist as a discrete material. Nat. Commun. 2014;5:5447. doi: 10.1038/ncomms6447. - DOI - PubMed
    1. Bundy FP, et al. The pressure–temperature phase and transformation diagram for carbon. Carbon. 1996;34:141–153. doi: 10.1016/0008-6223(96)00170-4. - DOI