. 2021 Mar;17(3):307-316.
doi: 10.1038/s41589-020-00719-w. Epub 2021 Jan 28.

Chemical systems biology reveals mechanisms of glucocorticoid receptor signaling

Affiliations

Chemical systems biology reveals mechanisms of glucocorticoid receptor signaling

Nelson E Bruno et al. Nat Chem Biol. 2021 Mar.

Abstract

Glucocorticoids display remarkable anti-inflammatory activity, but their use is limited by on-target adverse effects including insulin resistance and skeletal muscle atrophy. We used a chemical systems biology approach, ligand class analysis, to examine ligands designed to modulate glucocorticoid receptor activity through distinct structural mechanisms. These ligands displayed diverse activity profiles, providing the variance required to identify target genes and coregulator interactions that were highly predictive of their effects on myocyte glucose disposal and protein balance. Their anti-inflammatory effects were linked to glucose disposal but not muscle atrophy. This approach also predicted selective modulation in vivo, identifying compounds that were muscle-sparing or anabolic for protein balance and mitochondrial potential. Ligand class analysis defined the mechanistic links between the ligand-receptor interface and ligand-driven physiological outcomes, a general approach that can be applied to any ligand-regulated allosteric signaling system.


Conflict of interest statement

Competing Financial Interest Statement. We declare no competing financial interests in this work.

Figures

Extended Data Fig. 1
Extended Data Fig. 1. Structure-based design of GR ligands
a) Chemical structure of the selective GR modulator, PF802. b) Crystal structure of the dexamethasone (Dex) bound GR ligand-binding domain (LBD). Helix 12 is colored red and the NCOA2 coregulator peptide binding in the AF2 binding surface is colored coral. Carbons-3, −11, and −17 are indicated in the chemical structure (pdb entry 1M2Z). c) The bulky dimethylanaline group attached at C11 in RU-486 displaces h12 from the agonist position to disrupt the AF2 surface and generate antagonism (pdb entry 1NHZ). d) Substitutions at C3, as seen with the furoate group in momethasone furoate or the propyne in RU-486 target a small internal pocket to increase affinity (pdb entry 4P6W). e) Substitutions at C3 of the steroidal A-ring enter the solvent channel underneath the AF2 surface, potentially changing the shape of the surface and the ensemble of interacting coregulators (pdb entry 3BQD). f) Model of SR11466 (15) bound to the GR LBD
Extended Data Fig. 2
Extended Data Fig. 2. Quantitative phenotyping assays for GC action in skeletal muscle
a-e) Myotubes were nutrient-deprived, pre-treated with DMSO, RU-486, or Dex, and treated with insulin as outlined in Methods. a) Effect of insulin on pAKT levels in C2C12 myotubes were compared by In-Cell Western assay (ICW) 48 h after treatment with RU-486 or Dex. b) Quantitation of pAKT in C2C12 myotubes compared by ICW. Bars represent the mean; n = 3, except for DMSO where n = 36 biologically independent samples. c) ICW for surface expression of Glut4 on L6 myotubes. Bars represent the mean; n = 3 biologically independent samples. d) C2C12 myotubes were assayed for protein degradation by release of tritiated phenylalanine. Bars represent the mean; for DMSO, n = 6, and for Dex, n = 4 biologically independent samples. e) ICW for protein synthesis by insulin-induced incorporation of puromycin into C2C12 myotube surface proteins. Bars represent the mean; n = 3 biologically independent samples. f-g) High-content imaging and analysis of C2C12 myoblasts stained with MitoTracker™ dye. Images are representative of 18 images per condition; i.e. 3 fields x 3 biologically independent samples per condition in each of 2 independent experiments. h) Assay reproducibility from screening 22 compounds on two separate occasions. The Pearson correlation coefficient, r, and its associated p-value is indicated. Each datapoint represents the mean effect of a distinct compound. Also see Methods. i–j) Linear regression demonstrates the predictive power (r2), and associated p-value for the indicated variables. i) Ψm and pAKT predict Synthesis (p = 6 ×10⁻⁵ and 8 ×10⁻⁵, respectively). j) GR nuclear translocation selectively predicts Glut4 (p = 2 ×10⁻⁵) but not pAKT. Each datapoint represents the effects of a distinct ligand.
Extended Data Fig. 3
Extended Data Fig. 3. Relationships among specific genes, peptide interaction assays, and GR-mediated phenotypes
a-e) Linear regression was performed for the indicated assay pairs, where each point represents a different compound. a) Effects of the ligands on Socs2 expression predicts Glut4 translocation, Ψm, and insulin-stimulated protein synthesis. b) Ligand-dependent expression of Bcl2l1, which encodes the mitochondrial anti-apoptotic protein, Bcl-xL does not predict effects of on Ψm. c) Fkbp5 expression as a predictor of Glut4 translocation shows an inflection point (arrow). d) The Glut4 data was truncated below the inflection point shown in c). e) GR interaction with an NCOR2 peptide predicts protein synthesis in the C11 subset of ligands. f) The C11- and C3-substituted compounds showed similar variance in the skeletal muscle profiling assays. Blue dashed line, vehicle; red dashed line, Dex. Each datapoint represents the mean effect of a distinct compound, n=3 biologically independent samples. The error bars represent the mean ± SD of each compound series. For C11, n=8 distinct compounds; for C3, n=7 distinct compounds. See also Fig. 2a-e
Extended Data Fig. 4
Extended Data Fig. 4. Compound structure- activity relationships
a) Individual compound data for protein degradation, insulin- stimulated protein synthesis, and Glut4 translocation in myotubes, as well as effects on IL-1β-stimulated secretion of IL-6 by A549 cells. Lead compounds are indicated with arrows. Among the 3 compounds with full suppression of IL-6 (13,14,15), only 15 did not inhibit protein synthesis or stimulate protein degradation. 18 showed the greatest anabolic effects, with stimulation of protein synthesis and inhibition of protein degradation. b) Protein degradation in myotubes assayed as described in Extended Data Fig. 2 and Methods. Bars represent the mean, n = 4, except for DMSO where n = 6 biologically independent samples. c) 293T cells were co-transfected with a GR expression plasmid and MMTV-luciferase reporter. The next day cells were treated with the indicated compounds for 24 h and probed for luciferase activity. For SR16024, was the cells were cotreated with 1 nM Dex. Data are mean ± SEM, n = 3 biologically independent samples. d) Mitochondrial potential of myotubes assayed as described in Extended Data Fig. 2 and Methods. Bars represent the mean; n = 3, except for 15 where n = 2 biologically independent samples.
Extended Data Fig. 5
Extended Data Fig. 5. On-target mechanism of action studies
a) Reporter activity in steroid-deprived 293T cells co- transfected with an androgen-responsive ARR3-tk-luc reporter and an androgen receptor (AR) expression plasmid or empty vector control, and then treated with the indicated compounds for 24 h. Dose curves for compounds that stimulated AR activity (left) and the indicated compounds (right) are shown. None of the compounds showed activity with the empty vector control. 18 and 19 are isomers differing only in the position of the chlorine on the benzyl substitution. Datapoints are mean ± SEM; n = 3 biologically independent samples. b) Linear regression demonstrating that ligand-specific AR activity profiles do not correlate with protein synthesis. c) Expression of steroid receptor mRNAs in A549 cells. Only Ar which encodes AR, and Nr3c1 which encodes GR were detected by qPCR. Bars represent the mean; n = 3 independent samples. Also see Supplementary Fig. 3. d) Representative qPCR amplification plots for Pgr, Ar, and Nr3c1 in A549 versus MCF7 cells. Pgr, which encodes the progesterone receptor, is not expressed in A549 cells. e) AR antagonists do not reverse the effects of Dex on IL-6 secretion. IL-6 levels in A549 cell media were measured by AlphaLISA after overnight exposure to the indicated conditions. DHT, 5α-dihydrotestosterone; BIC, bicalutamide; ENZ, enzalutamide. For the controls (left), bars represent the mean; n = 6 biologically independent samples. For dose curves, datapoints are mean ± SEM; n = 3 biologically independent samples. f) Luciferase assay showing the effects of 1 nM DHT, 1 μM BIC and 1 μM ENZ on AR activity, demonstrating that the antagonists have cellular activity. Bars represent the mean; n =3 biologically independent samples.
Extended Data Fig. 6
Extended Data Fig. 6. In vivo compound profiling
a) Mouse pharmacokinetics studies of the indicated compounds. Data are mean ± SEM; n = 3 biologically independent samples. b-c) Changes in the lean mass and body weights of male C57BL/6 mice treated with (10 mg/kg Dex or SR16024, or 50 mg/kg SR11466) and fasted overnight. Bars represent the mean; n = 5 mice per group (in each of 2 independent experiments). 1-way ANOVA, Sidak’s multiple comparisons test, adjusted p-values are indicated.
Extended Data Fig. 7
Extended Data Fig. 7. Docking and molecular dynamics simulations
a) Ribbon diagram of GR LBD bound to the indicated ligands. 7 and 9 were docked with Autodock Vina. b) Differential analysis of correlated motion between Cα atoms from the simulations with the indicated ligands subtracted from Dex. c) Formation of a hydrogen bond with R611 differentially shifts the position of the ligands. d) Formation of the hydrogen bond R611-induced changes in surface structure (red arrows). With Dex, there was a shift in h12 and the C-terminus of h3. With 7, the C-terminus of h11 and N-terminus of h3 were shifted further apart, and away from h12. This destabilization of the h12 interface with h3 and h11 explains why this compound is an antagonist, a mechanism we have called “indirect antagonism.” With 9, there was a rotation of both ends of h3. e) Usage of amino acid residue and edge in the suboptimal pathways between h12 E755 and h5 R614, demonstrating that Dex preferentially utilized R611 instead of W610 as a pathway for correlated motion. Also see Online Methods.
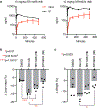
Figure 1.
Figure 1.. Structure-based design approach and glucocorticoid profiling platform.
a-d) Glucocorticoids used in this study. e) Compound profiling and computational strategy. Effects on the independent variables were used in a machine learning approach, Random Forest, to identify predictors of skeletal muscle phenotypes, the dependent variables, described in Figure 2, Supplementary Table 2, and below. f) Relationships among GR-mediated phenotypes. Lines indicate significant Pearson correlation between variables using Bonferroni pAdj < 0.0071.
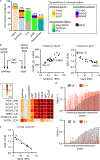
Figure 2.
Figure 2.. Machine learning reveals top predictors of selective modulation and common signaling
a) Composition of minimal predictive models defined by machine learning. The predictive capacity of the model (y-axis) for a GR-mediated phenotype i.e. dependent variable (x-axis), is also indicated. See Supplementary Table 2 for the full list of predictors. b) Linear regression (scatter plots) demonstrates their predictive power (r2), and its associated p-value. Each point represents the effects of a distinct ligand. c) Linear regression comparing the predictive power of the indicated peptide interactions for the indicated phenotypes and target genes. See Supplementary Table 3 for r2 values. d) The Glut4-predictive power, r2, of target genes and peptide interactions observed with all compounds (1–3 and 6–27) were rank ordered, and then compared to the r2 observed within the C11-substituted (13–20) or C3-substituted (6–12) compound series. e) Linear regression demonstrating the Glut4-predictive power of Bcl2l1 within the C11-substituted compounds series (13–20). Each datapoint represents the effects of a distinct C11-substituted compound on Glut4 translocation and Bcl2l1 expression. See also Methods, Supplementary Dataset, and Extended Data Fig. 3.
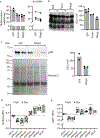
Figure 3.
Figure 3.. Functional validation of the predictive target gene, Fkbp5, and GR coregulators
a) Weight of Tibias Anterior (TA) muscles transduced with GFP (control), Fkbp5, or Foxo1 genes in 2 independent experiments. Left panel, bars represent the mean, and n = 3 except for GFP where n = 2 TA muscles per condition. Right panel, each pair of datapoints represent TA muscles from the same mouse, n = 4 mice. Also see Methods. bc) Whole lysates of transduced TA muscles were analyzed by Western blot and subsequent quantitation. b) In vivo SUnSET assay for Synthesis. Bars represent the mean; n = 2, except for GFP where n = 4 biologically independent samples. c) Insulin-induced pAKT levels. Bars represent the mean; for GFP, n = 2 and for Fkbp5, n = 3 biologically independent samples. Also see Supplementary Fig. 1a. d) SUnSET assay or e) in-cell Western for pAKT in C2C12 myotubes expressing the indicated shRNAs. Boxes represent the range; n = 6, except for Dex/shCtrl where n = 4 biologically independent samples. 1-way ANOVA, Sidak’s multiple comparisons test, adjusted p-values, *padj = 0.0235, **padj = 0.0018, ***padj = 0.0007, ****padj = 0.0004, padj < 0.0001. e) Insulin-induced pAKT levels in C2C12 myotubes expressing the indicated shRNAs. Bars represent the range; n = 6, except for Dex/shCtrl where n = 4 biologically independent samples. 1-way ANOVA, Sidak’s multiple comparisons test, adjusted p-values, *padj = 0.0385, **padj = 0.0045, ***padj = 0.0001, padj < 0.0001. Also see Supplementary Fig. 1b.
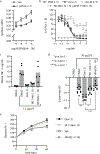
Figure 4.
Figure 4.. In vitro characterization of selective GR modulators with muscle-sparing activities.
a) IL-1β-induced secretion of IL-6 by A549 cells treated with the indicated compounds were compared by AlphaLISA. Left panel bars represent the mean; right panel datapoints represent mean ± SEM; n = 3, except for the vehicle (DMSO) where n = 6 biologically independent samples. b) Effects of the indicated compounds on Synthesis in C2C12 myotubes were compared by SUnSET assay. Bars represent the mean; n = 3 biologically independent samples. c) SR16024 (18) does not inhibit myotube surface expression of Glut4. Effects of the indicated compounds on Glut4 in L6 myotubes. Bars represent the mean; n = 3 biologically independent samples. d) C2C12 myoblasts treated with the indicated compounds were stained with MitoTracker dye. Images are representative of 18 images per condition i.e. 2 independent experiments with similar results x 3 fields per well x 3 biologically independent wells per condition. e) The effects of all tested compounds on IL-1β-induced secretion of IL-6 by A549 cells (y-axis) and primary human osteoblast mineralization (x-axis). Datapoints represent the mean effects of a distinct compound, For IL-6, n = 3 and for mineralization, n = 4 biologically independent samples. f) Dose curves of indicated compounds in the mineralization assay. Data are mean ± SEM, n = 4 biologically independent samples. Also see Extended Data Fig. 2, Extended Data Fig. 4, and Methods.
Figure 5.
Figure 5.. In vivo compound profiling and validation of on-target mechanism of action
a) Effect of the indicated compounds on Synthesis were compared by SUnSET assay in C2C12 myotubes. Datapoints are mean ± SEM, n = 4 biologically independent samples. b) IL-1β-induced IL-6 production by A549 cells treated with the indicated compounds was compared by AlphaLISA. Datapoints are mean ± SEM, n = 3 biologically independent samples. c) SR11466 (15) blocks the LPS-induced inflammatory response in mice. Plasma TNFα levels of mice treated with the indicated GR ligands (10 mg/kg Dex or SR16024, or 50 mg/kg SR1166) overnight before a 1-hr LPS challenge of 1.5 mg per mouse. Bars represent the mean, n = 5 mice per group. d) Changes in lean mass of mice treated as described in panel c were determined by whole-body NMR after an additional 18-hr LPS treatment of 30 mg per mouse. Bars represent the mean, n = 10 mice per group (5 × 2 experiments). 1-way ANOVA, Sidak’s multiple comparisons test, adjusted p-values, *padj = 4.5 ×10⁻⁵, **padj = 3.8 ×10⁻⁶, ***padj = 1.6 ×10⁻⁹. e) Glucose production was compared by lactate-tolerance test (LTT) after overnight fast. Data are mean ± SEM, n = 5 mice per group. See also Extended Data Fig. 5 and Methods.
Figure 6.
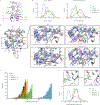
Figure 6.. C3 substitutions in the steroid scaffold alter allosteric communication between ligand and activity.
a) Ribbon diagram of the GR-LBD illustrates the C-terminus of helix 11 (h11) and N-terminus of h3 where we observed ligand-induced conformational effects in three 1 μs molecular dynamics simulations. b) Distance distribution plots of the Cα distance between Met560 (h3) and Thr739 (h11). c) Backbone Cα, C’, N, and O RMSD distribution plots of the h3 and h11 regions colored magenta in (a). d) Dynamical network analysis of suboptimal pathways for correlated motion between E755 and R614. Red arrows indicate pathways found with Dex-bound GR. e) Histogram showing the suboptimal pathlengths with the indicated ligands. f) Distance distribution plots of Q570 (Cδ) and R611 (Cζ) side chain atom distances as a proxy to determine the relative populations inward R611 conformations that can interact with ligand. Inserts show R611 inward (left) and outward (right) side chain conformations extracted from the Dex-bound simulations.

References

    1. Watson ML et al. A cell-autonomous role for the glucocorticoid receptor in skeletal muscle atrophy induced by systemic glucocorticoid exposure. Am J Physiol Endocrinol Metab 302, E1210–20 (2012). - PMC - PubMed
    1. Bodine SC & Furlow JD Glucocorticoids and Skeletal Muscle. Adv Exp Med Biol 872, 145–76 (2015). - PubMed
    1. Nettles KW & Greene GL Ligand control of coregulator recruitment to nuclear receptors. Annu Rev Physiol 67, 309–33 (2005). - PubMed
    1. Kuo T et al. Genome-wide analysis of glucocorticoid receptor-binding sites in myotubes identifies gene networks modulating insulin signaling. Proc Natl Acad Sci U S A 109, 11160–5 (2012). - PMC - PubMed
    1. Chen SL, Dowhan DH, Hosking BM & Muscat GE The steroid receptor coactivator, GRIP-1, is necessary for MEF-2C-dependent gene expression and skeletal muscle differentiation. Genes Dev 14, 1209–28 (2000). - PMC - PubMed

Methods-only References

    1. Trapnell C, Pachter L & Salzberg SL TopHat: discovering splice junctions with RNA-Seq. Bioinformatics 25, 1105–11 (2009). - PMC - PubMed
    1. Anders S & Huber W Differential expression analysis for sequence count data. Genome Biol 11, R106 (2010). - PMC - PubMed
    1. Mei S et al. Cistrome Data Browser: a data portal for ChIP-Seq and chromatin accessibility data in human and mouse. Nucleic Acids Res 45, D658–D662 (2017). - PMC - PubMed
    1. Heikkinen S, Argmann CA, Champy MF & Auwerx J Evaluation of glucose homeostasis. Curr Protoc Mol Biol Chapter 29, Unit 29B 3 (2007). - PubMed
    1. Bruno NE et al. Creb coactivators direct anabolic responses and enhance performance of skeletal muscle. EMBO J 33, 1027–43 (2014). - PMC - PubMed

Publication types

MeSH terms