. 2021 Mar;22(3):312-321.
doi: 10.1038/s41590-020-00859-0. Epub 2021 Jan 28.

IRGM1 links mitochondrial quality control to autoimmunity

Affiliations

IRGM1 links mitochondrial quality control to autoimmunity

Prashant Rai et al. Nat Immunol. 2021 Mar.

Abstract

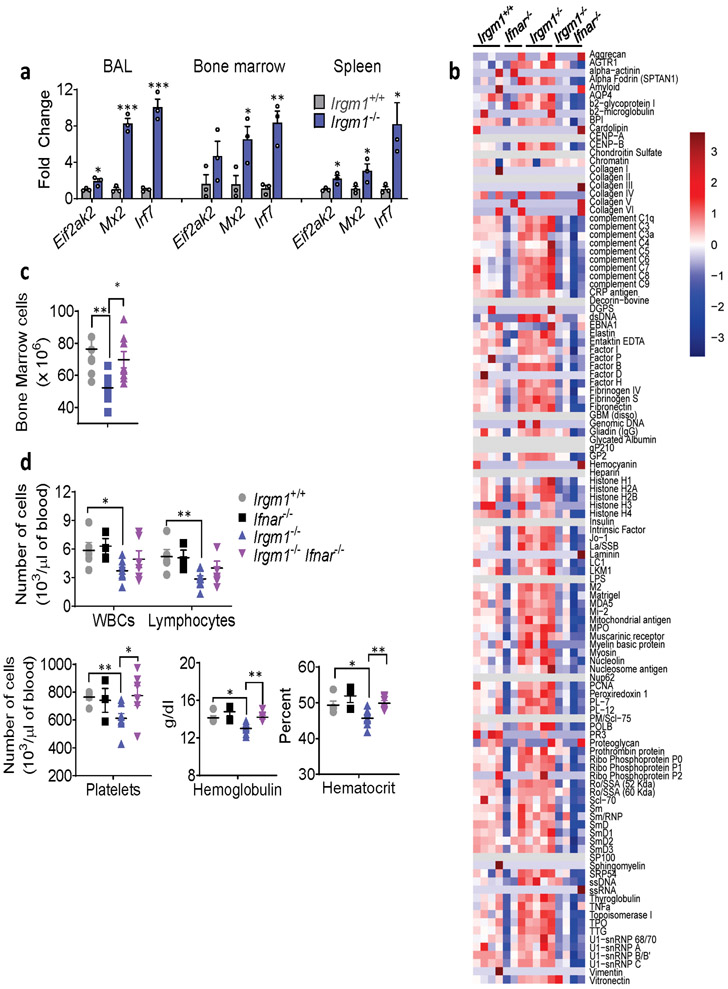
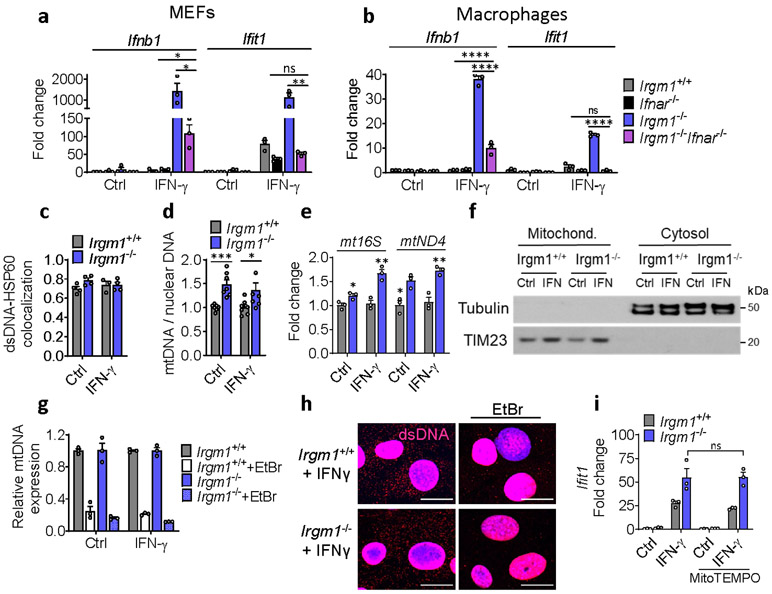
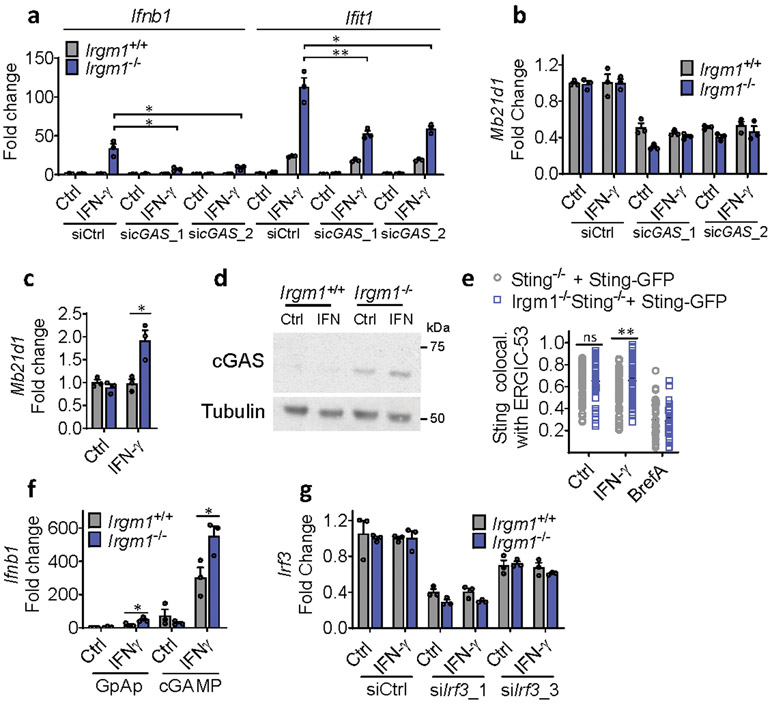
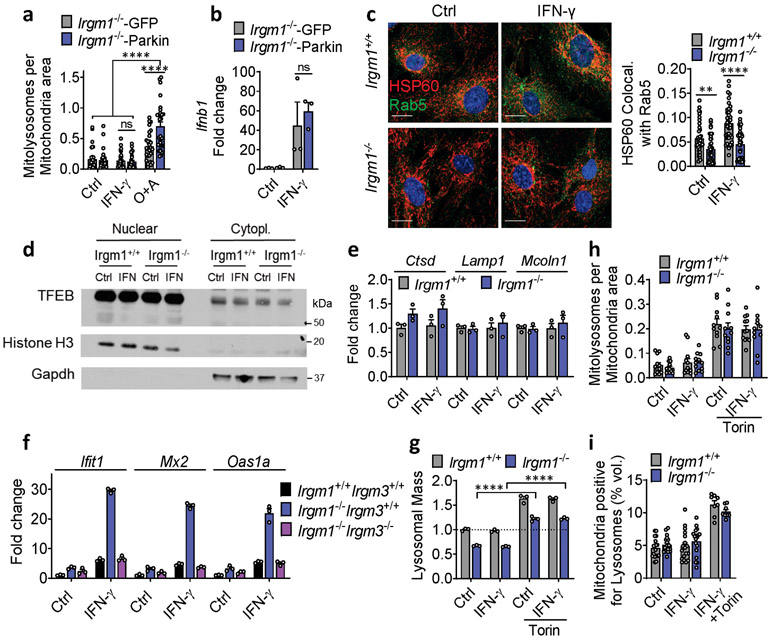
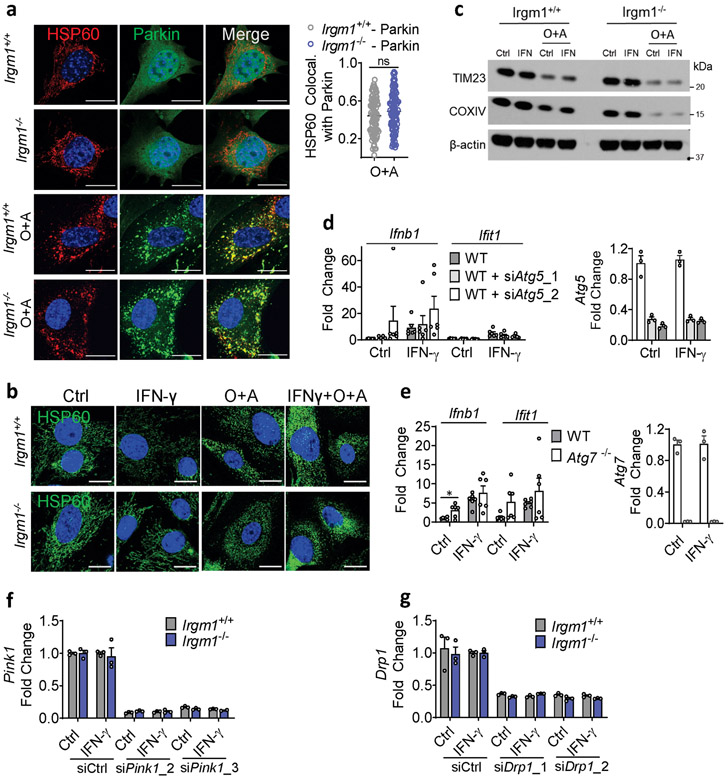
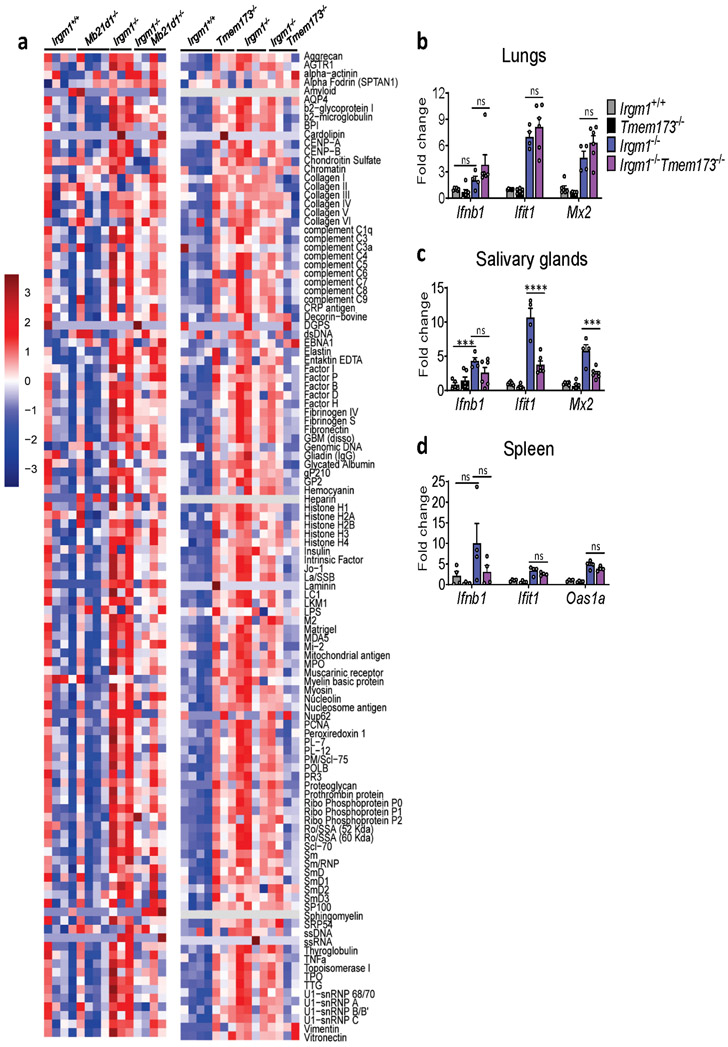
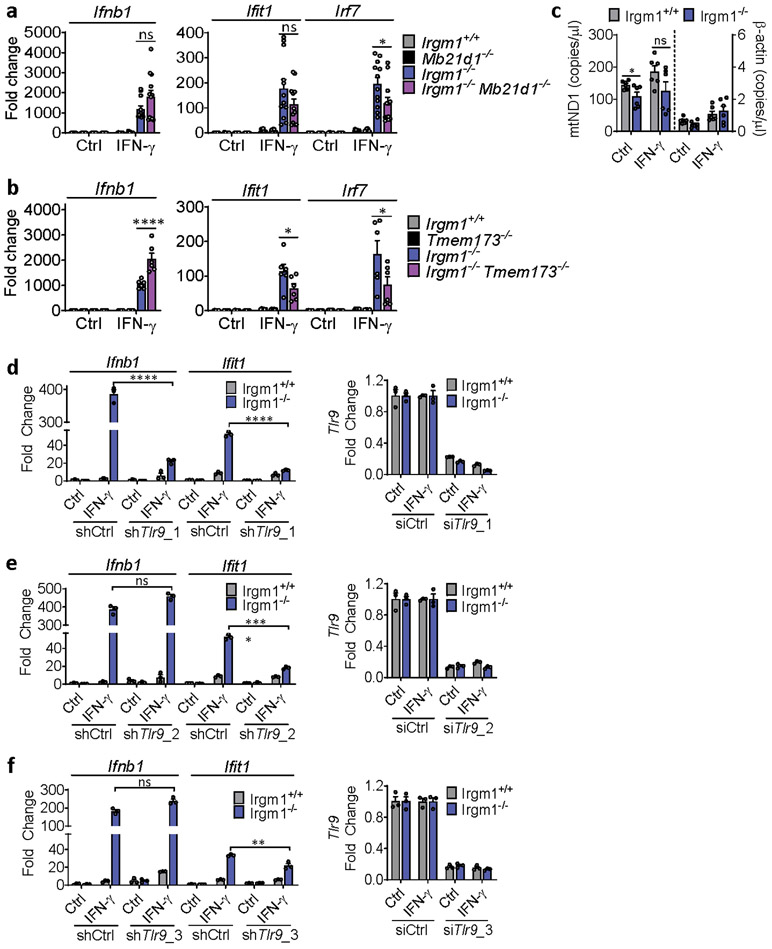
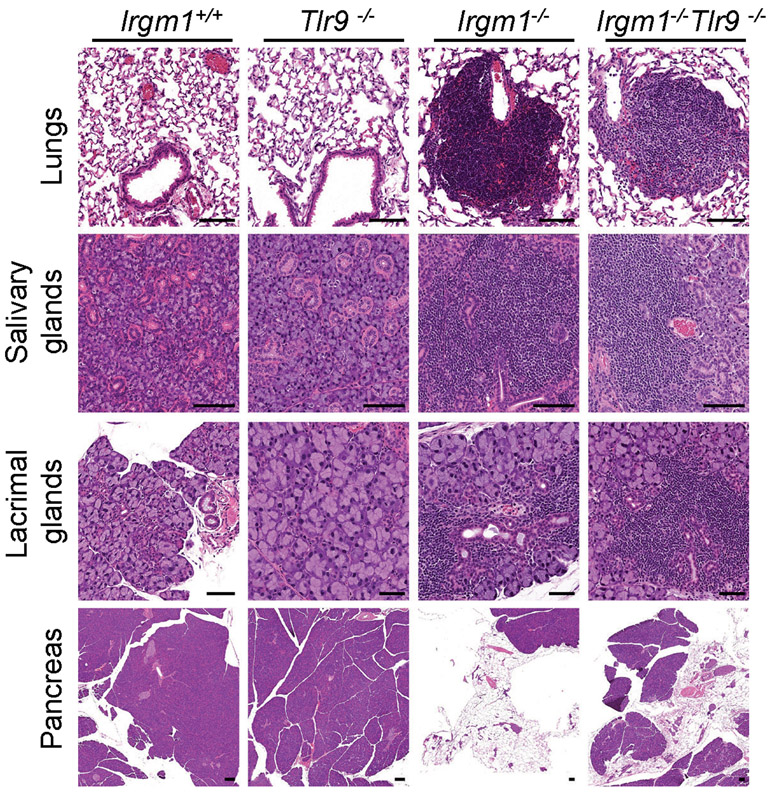
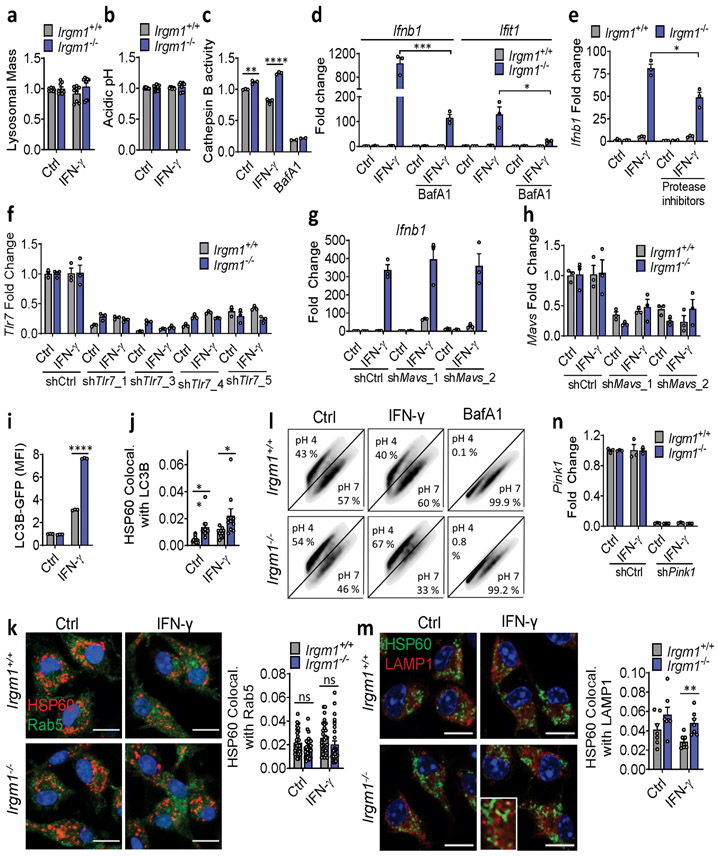
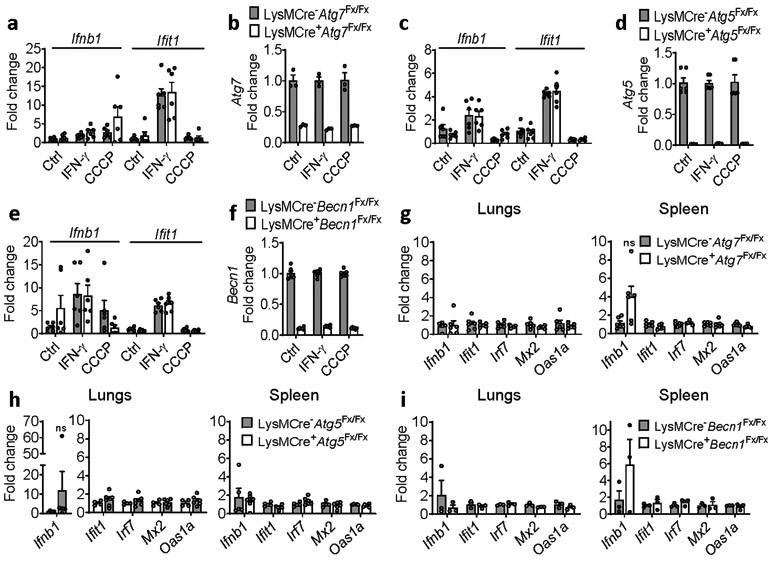
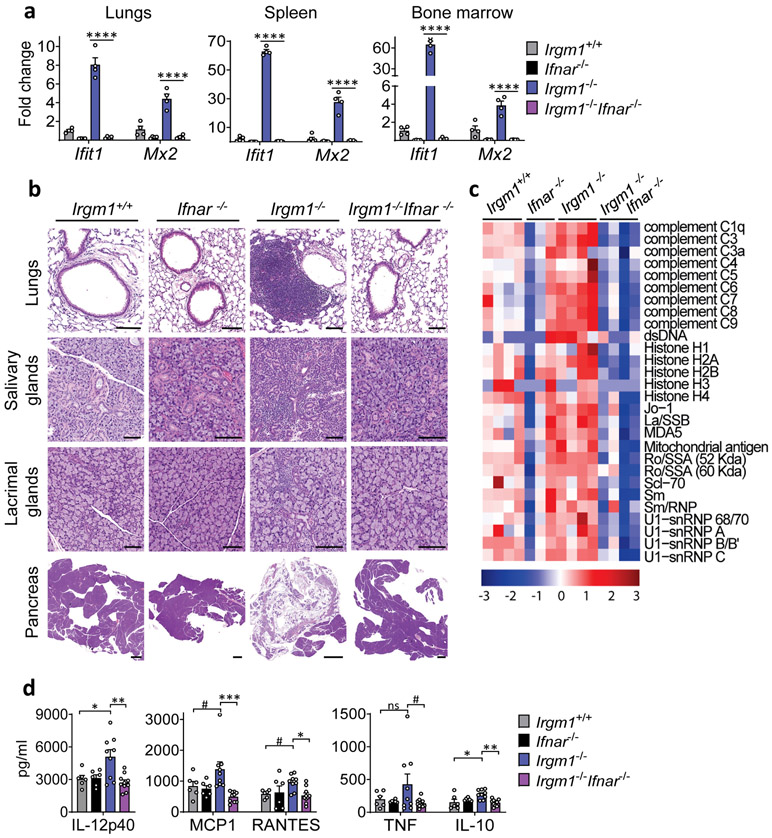
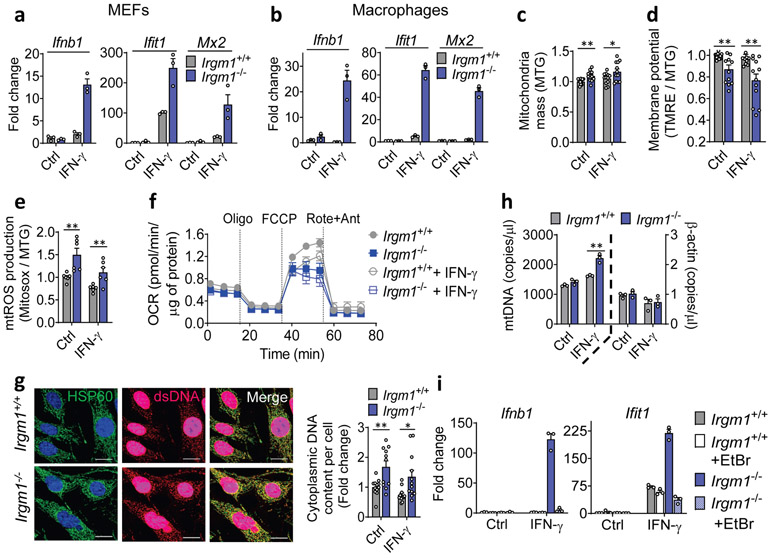
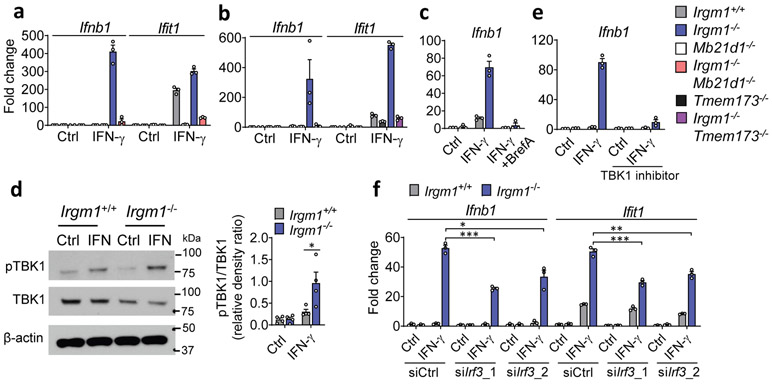
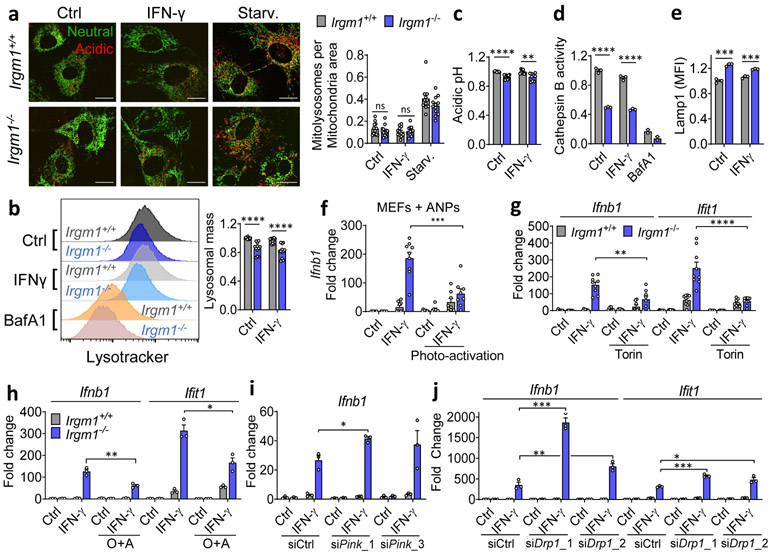
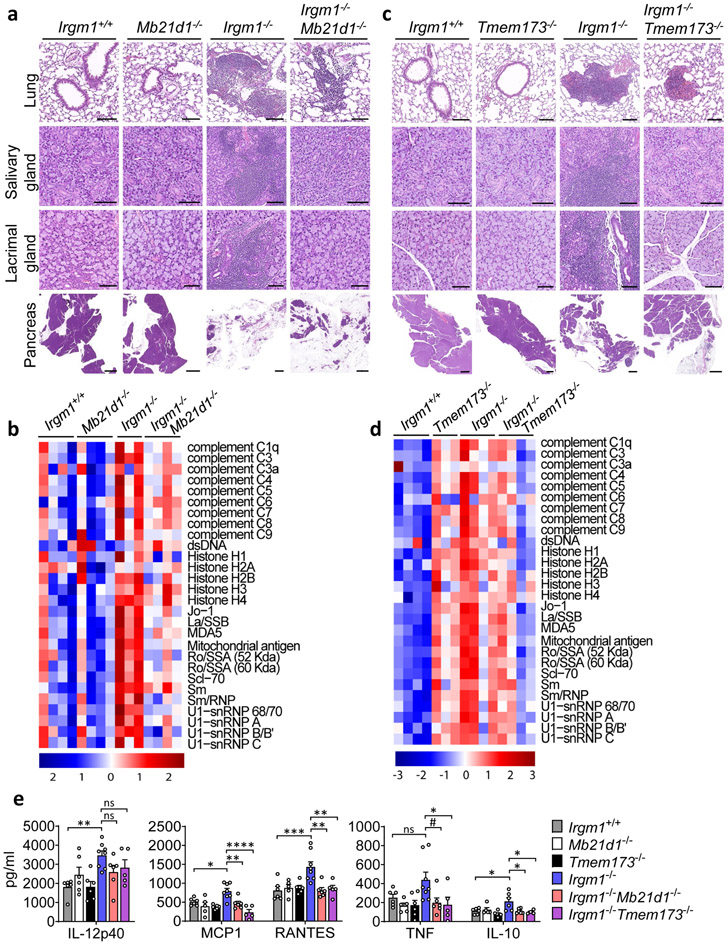
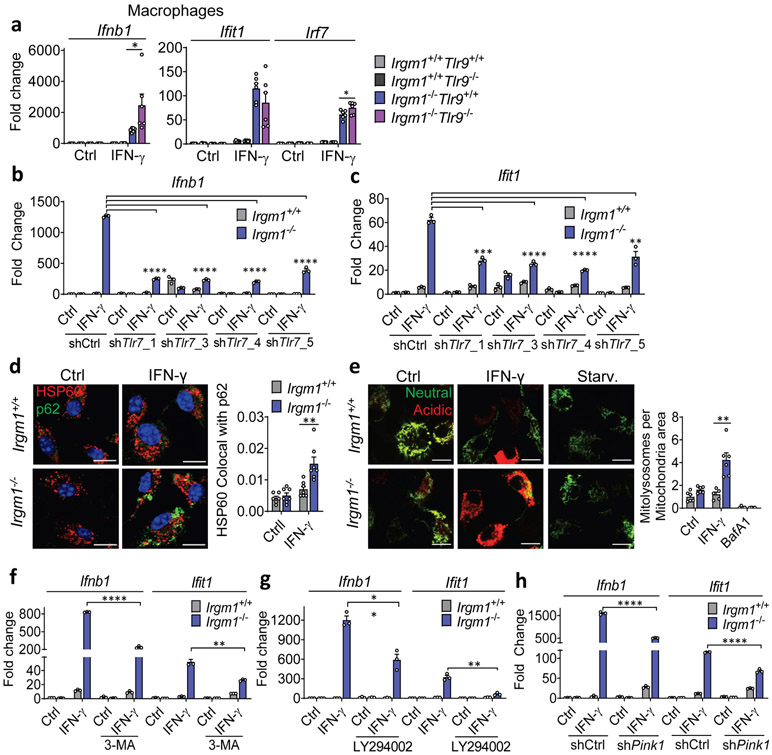
Mitochondrial abnormalities have been noted in lupus, but the causes and consequences remain obscure. Autophagy-related genes ATG5, ATG7 and IRGM have been previously implicated in autoimmune disease. We reasoned that failure to clear defective mitochondria via mitophagy might be a foundational driver in autoimmunity by licensing mitochondrial DNA-dependent induction of type I interferon. Here, we show that mice lacking the GTPase IRGM1 (IRGM homolog) exhibited a type I interferonopathy with autoimmune features. Irgm1 deletion impaired the execution of mitophagy with cell-specific consequences. In fibroblasts, mitochondrial DNA soiling of the cytosol induced cyclic GMP-AMP synthase (cGAS)-stimulator of interferon genes (STING)-dependent type I interferon, whereas in macrophages, lysosomal Toll-like receptor 7 was activated. In vivo, Irgm1-/- tissues exhibited mosaic dependency upon nucleic acid receptors. Whereas salivary and lacrimal gland autoimmune pathology was abolished and lung pathology was attenuated by cGAS and STING deletion, pancreatic pathology remained unchanged. These findings reveal fundamental connections between mitochondrial quality control and tissue-selective autoimmune disease.


Conflict of interest statement

The authors have declared that no conflict of interest exists.

Figures

Extended Data Fig. 1
Extended Data Fig. 1. Role for type I IFN in disease phenotypes of Irgm1−/− mouse.
a, Expression of interferon-stimulated genes in bronchoalveolar lavage (BAL) cells, bone marrow cells, and spleen of wild type and Irgm1−/− animals (n=3/genotype). b, Autoantibodies against full array of 124 antigens, measured in serum of animals (n=3-4 mice/genotype; each column is an independent mouse). c, Total count of bone marrow cells in wild type (n=8), Irgm1−/−(n=8), and Irgm1−/−Ifnar−/− (n=9) mice. d, Total leukocyte count (WBC), lymphocyte count, platelet count, hemoglobin concentration, and hematocrit in peripheral blood of wild-type (n=5), Ifnar−/− (n=3), Irgm1−/−(n=8), and Irgm1−/−Ifnar−/− (n=6) mice. Data are mean +/− s.e.m. *P < 0.05, **P < 0.01, ***P < 0.001. Two-tailed unpaired t-test (a, d) and one-way ANOVA with Tukey’s adjustment (c).
Extended Data Fig. 2
Extended Data Fig. 2. Mitochondrial abnormalities in Irgm1−/− MEFs.
a,b, Interferon-β (Ifnb1) and interferon-stimulated gene (Ifit1) expression in mouse embryonic fibroblasts (MEFs) (n=3) (a) and bone marrow-derived macrophages (n=3) (b) treated with or without IFN-γ (20 ng/ml, 16h). c, Colocalization of dsDNA and HSP60 immunostaining expressed as Mander’s coefficient (n=4 for all conditions, except n=3 for Irgm1+/++IFN-γ). d, Mitochondrial gene Dloop1 quantified by qPCR in total DNA isolates of MEFs, normalized to nuclear gene Tert (n=7). e, Expression of mtDNA-encoded genes mt16S and mtND4 quantified by qPCR in MEFs (n=3). f, Mitochondrial fractions evaluated for purity by immunoblotting for mitochondrial protein TIM23 and cytosolic protein tubulin. g,h, qPCR of mtDloop1 (n=3) (g) and immunostaining for cytoplasmic dsDNA (h) confirming mitochondrial DNA depletion by EtBr (scale bar, 20 μm). i, Ifit1 expression in MEFs treated with mitochondria-specific antioxidant MitoTempo (50 μM) prior to IFN-γ (n=3). a, b and e-i are representative of at least two independent experiments. d is combination of two independent experiments. Data are mean +/− s.e.m. *P < 0.05, **P < 0.01, ***P < 0.001. Two-tailed unpaired t-test.
Extended Data Fig. 3
Extended Data Fig. 3. cGAS/STING/IRF3 axis in type I IFN response of Irgm1−/− MEFs.
a, Interferon-β (Ifnb1) and Ifit1 expression in murine embryonic fibroblasts (MEFs) transfected with two different siRNAs against cGAS or control siRNA and then treated as shown (n=3). b, Mb21d1 qPCR confirmation of siRNA silencing (n=3). c,d, Mb21d1 expression measured by qPCR (n=3) (c) and cGAS by Western blot (d) in MEFs. e, Sting−/− (i.e., Tmem173−/−; n=53 for control, n=62 for IFN-γ and n=44 for Brefeldin A [BrefA] conditions) and Irgm1−/−Sting−/− (n=49 for control, n=70 for IFN-γ and n=36 for BrefA conditions) MEFs transduced with Sting-GFP were analyzed for colocalization (Mander’s coefficient) of GFP with ER-Golgi intermediate complex (ERGIC)-53. Brefeldin A (2 μg/ml) treatment was used as negative control. f, Ifnb1 expression in MEFs treated with IFN-γ and then transfected with 2 μg/ml cyclic-GAMP or linear GpAp negative control (n=3). g, qPCR confirmation of Irf3 silencing by siRNA (n=3). a-d and f-g are representative of at least two independent experiments. e is combination of two independent experiments. Data are mean +/− s.e.m. *P < 0.05, **P < 0.01. Two-tailed unpaired t-test.
Extended Data Fig. 4
Extended Data Fig. 4. Deficient mitophagic flux in Irgm1−/− MEFs.
a, GFP-Parkin-expressing Irgm1−/− MEFs transduced with mt-mKeima and analyzed for mitolysosome signals. GFP vector served as transduction control. Oligomycin and Antimycin A (O+A; 10 μM each for 5-6h) were used as positive control for mitophagy (n=30 for Irgm1−/−-GFP, Irgm1−/−-Parkin treated with IFN-γ or O+A, n=28 for Irgm1−/−-GFP treated with O+A, n=31 for Irgm1−/−-GFP treated with IFN-γ and n=27 for Irgm1−/−-Parkin control conditions). b, PARKIN-expressing (and GFP control) MEFs assessed for Ifnb1 expression by qPCR (n=3). c, MEFs treated with or without IFN-γ were stained for mitochondria (HSP60) and endosomes (Rab5) and analyzed for colocalization (Mander’s coefficient shown at right) (n=38 fields) (scale bar, 20 μm). d, Nuclear and cytoplasmic fractions were isolated and stained for TFEB. Nuclear Histone H3 and cytoplasmic GAPDH serve as fraction markers. e, Expression of lysosomal biogenesis genes in MEFs (n=3). f, Immortalized MEFs of indicated genotypes were assessed by qPCR for expression of ISGs (Ifit1, Mx2, and Oas1a) (n=3). g, LysoTracker fluorescence fold change in MEFs treated with Torin1 (1 μM, 8h) (n=3). h, Mitophagy measured in mt-mKeima-expressing MEFs treated with Torin1 (n=11). i, Mitochondrial volume colocalizing with lysosomes analyzed by live-imaging of MitoTracker and LysoTracker-stained MEFs (n=18 for all conditions, except n=8 for IFN-γ +Torin). Surface rendering was performed in Imaris software for volumetric analysis. a, d, f and g are representative of two independent experiments. b, e and h are representative of three independent experiments. c and i are combination of three independent experiments. Data are mean +/− s.e.m. *P < 0.05, **P < 0.01, ****P < 0.0001, ns=not significant.Two-tailed unpaired t-test.
Extended Data Fig. 5
Extended Data Fig. 5. Mitophagy controls in Irgm1−/− MEFs.
a, YFP-Parkin expressing MEFs treated with Oligomycin and Antimycin A (O+A, 10 μM each for 6h), stained for HSP60 and analyzed for colocalization (Mander’s coefficient; right panel) of HSP60 with Parkin (n=85 for Irgm1+/+-Parkin and n=100 for Irgm1−/−-Parkin cells) (scale bar, 20 μm). b,c, MEFs treated with O+A analyzed for mitochondrial fragmentation by HSP60 staining (b) and for mitochondrial protein expression (TIM23, COXIV, actin control) by Western blot (c) (scale bar, 20 μm). d, WT MEFs underwent Atg5 silencing with two siRNAs (or control siRNA), were untreated or treated with IFN-γ, and then analyzed by qPCR for Ifnb1, Ifit1, and Atg5 (n=6). e, WT and Atg7−/− MEFs were treated as shown and then analyzed by qPCR for Ifnb1, Ifit1, and Atg7 (n=6). f,g, Silencing efficiency for siRNAs against Pink1 (n=3) (f) and Drp1 (n=3) (g). b, c, f, and g are representative of at least two independent experiments. a, d, and e are combinations of two independent experiments. Data are mean +/− s.e.m. ***P < 0.001, ns = not significant. Two-tailed unpaired t-test.
Extended Data Fig. 6
Extended Data Fig. 6. Tissue-selective role of STING in autoimmune pathology of Irgm1-null mice.
a, Autoantibodies against full array of 124 antigens, measured in serum of animals (n=3-4 mice/genotype; each column is an independent mouse). b-d, Expression of interferon-stimulated genes in lungs (n=6 for all genotypes, except n=4 for Irgm1−/−), salivary glands (n=6 for all genotypes, except n=4 for Irgm1−/−), and spleen of indicated genotypes (n=4 for all genotypes). Data are mean +/− s.e.m. ***P < 0.001, ns = not significant. One-way ANOVA with Tukey’s adjustment.
Extended Data Fig. 7
Extended Data Fig. 7. Effects of cGAS, STING, and TLR9 silencing on type I IFN response of Irgm1−/− macrophages.
a,b, BMDMs of the indicated genotypes were treated as shown and then evaluated for expression of Ifnb1 and interferon-stimulated genes by qPCR. For (a) n=12, and (b) n=6. c, Cytosolic fractions of BMDMs were assayed for mitochondrial (mt)DNA (ND1) and nuclear DNA (β-actin) by digital droplet PCR (n=3). d-f, WT and Irgm1−/− BMDMs were treated with three different lentiviral shRNAs targeting TLR9 (or control shRNA), treated as shown, and then analyzed by qPCR for Ifnb1 and Ifit1 (left) and Tlr9 (right) (n=3). a is a combination of three independent experiments. b and c are combinations of two independent experiments. d and f are representative of three independent experiments. e is a representative of two independent experiments. Data are mean +/− s.e.m. ** p ≤ 0.01, ****p ≤ 0.0001, ns = not significant. Two-tailed unpaired t-test.
Extended Data Fig. 8
Extended Data Fig. 8. No impact of TLR9 deletion on histopathology of the Irgm1−/− mouse.
Representative H&E-stained sections of lungs, salivary glands (submandibular), lacrimal glands, and pancreas from the indicated genotypes (n=5-7/genotype) (all scale bars are 100 μm, except for lacrimal glands of Tlr9−/−, Irgm1−/−, and Irgm1−/−Tlr9−/− [50 μm]).
Extended Data Fig. 9
Extended Data Fig. 9. Role of lysosome and mitochondrial cargo in type I IFN response of Irgm1−/− macrophages.
a, Lysosomal mass analyzed by LysoTracker staining (n=9). b, Relative acidic pH measured by ratiometric Lysosensor yellow/blue dye (n=9). c, Cathepsin B activity assessed by Magic red substrate (n=3). Bafilomycin (BafA1) is used as negative control. d,e, qPCR for indicated targets in BMDM pretreated prior to IFN-γ with BafA1 (100 nM, 2h) (d) or co-treated with protease inhibitors (20 μM E64d, 50 μM pepstatin A) and IFN-γ (e) (n=3). f-h, BMDM silenced for Tlr7 using four different lentiviral shRNAs (or control shRNA) and analyzed for Tlr7 expression (f); silenced for Mavs using two different shRNAs and analyzed for Ifnb1 (g) or Mavs expression (h) (n=3). i, Mean fluorescence intensity (MFI) of LC3-GFP transgenic WT and Irgm1−/− BMDM after washing with 0.05% saponin (n=3). Release of LC3-I was confirmed by microscopy showing only punctate LC3-II signal (not shown). j, BMDM stained for mitochondria (HSP60) and endogenous LC3, expressed as Mander’s coefficient of colocalization (n=10). k, BMDM analyzed for colocalization of HSP60 and endosome (Rab5) (n=30). l, mt-mKeima-expressing BMDM analyzed for mitophagy by flow cytometry using ratiometric measurements at 488 (pH 7) and 561 nm (pH 4) lasers with 610/20 nm emission and 600 nm long pass filters. m, BMDM analyzed for HSP60 and LAMP1 colocalization (n=7). n, Evaluation of knockdown of Pink1 in BMDM (n=3). a and k are combination of three independent experiments. b is combination of two independent experiments. c, d, i, j, l, and m are representative of three independent experiments. e-h and n are representative of two independent experiments. All scale bars are 10 μm. Data are mean +/− s.e.m. #P = 0.06, *P < 0.05, **P < 0.01, ****P < 0.0001, ns = not significant. One-way ANOVA or two-tailed unpaired t-test.
Extended Data Fig. 10
Extended Data Fig. 10. Deletion of ATG5, ATG7, and BECLIN1 does not induce type I IFN.
BMDMs from mice with myeloid-specific deficiency (LysM-Cre-targeted deletion) of Atg7 (a-b), Atg5, (c-d), and Beclin1 (e-f) were treated as shown and analyzed for expression of Ifnb1, Ifit1, and the respective deleted gene targets. Results are a combination of BMDM cultures from two animals (n=6), except for (b) where n=3. CCCP = carbonyl cyanide m-chlorophenyl hydrazine. g-i, Lungs and spleen from naïve mice from the three strains were harvested and analyzed by qPCR for the targets shown. n=6, 58 week-old females for (g), n=4 for LysMCreAtg5Fx/Fx lungs, n=5 for LysMCreAtg5Fx/Fx spleen and n=6 for LysMCre+Atg5Fx/Fx lungs and spleens, 9-14 week-old females for (h), and N=3, 9-14 week-old females for (i). Data are mean +/− s.e.m, ns = not significant. Two-tailed unpaired t-test.
Figure 1:
Figure 1:. IRGM1 deficiency induces type I interferonopathy.
a, Expression of interferon-stimulated genes (ISG) Ifit1 and Mx2 in lungs, spleen and bone marrow of wild type, Ifnar−/−, Irgm1−/− and Irgm1−/−Ifnar−/− animals (n=4/genotype). b, Representative H&E-stained sections of lungs, salivary glands (submandibular), lacrimal glands, and pancreas from indicated genotypes (n = 2-7/genotype) (scale bars, 100 μm, except pancreas [1000 μm]). c, Autoantibodies against indicated antigens, measured in serum of animals (n=3-4 mice/genotype). d, Cytokines and chemokines measured in serum (n=6 [Irgm1+/+, Ifnar−/−]; n=9 [Irgm1−/−]; n=10 [Irgm1−/−Ifnar−/−]). Data are mean +/− s.e.m. #P = 0.1, *P < 0.05, **P < 0.01, and ****P < 0.0001 (one-way ANOVA with Tukey’s adjustment).
Figure 2:
Figure 2:. Mitochondrial DNA induces type I interferon response in Irgm1-null cells.
a, b, Interferon-β (Ifnb1) and interferon-stimulated genes (Ifit1, Mx2) expression in mouse embryonic fibroblasts (MEFs) (a) and bone marrow-derived macrophages (BMDMs) (b) left untreated or treated with IFN-γ (20 ng/ml, 16h) (n=3). c, Mitochondrial mass in MEFs as measured by MitoTracker Green (MTG) staining in flow cytometry. Data are pooled from four independent experiments (n=12). d, Mitochondrial membrane potential as measured by tetramethylrhodamine, ethyl ester (TMRE [a cell-permeant, cationic, fluorescent dye sequestered by polarized mitochondria]) and normalized to MitoTracker Green (MTG) fluorescence. Data are pooled from four independent experiments (n=12). e, Mitochondrial ROS (mtROS) production measured by MitoSox and normalized by MTG. Data are pooled from two independent experiments (n=6). f, Oxygen consumption rate (OCR) analyzed by Seahorse assay (Oligo=Oligomycin; FCCP = Carbonyl cyanide 4-(trifluoromethoxy) phenylhydrazone; Rote+Ant=Rotenone + Antimycin A) (n=15). g, Immunofluorescence staining of double-stranded (ds)DNA and HSP60 (a mitochondrial matrix marker) in MEFs (scale bar, 20 μm). HSP60 intensity was generally comparable between genotypes across replicate experiments. Cytoplasmic (ds)DNA signal was quantified by subtracting nuclear DNA signal (right). Data are pooled from three independent experiments (n=12). h, Cytosolic fractions of MEFs assayed for mitochondrial (mt)DNA (ND1) and nuclear DNA (β-actin) by digital droplet PCR (n=3). i, Gene expression in MEFs with or without mtDNA depletion by ethidium bromide (EtBr), followed by buffer or IFN-γ treatment (n=3). a, b, f, h, and i are representative of three independent experiments. c, d, and e are expressed as fold change of mean fluorescence intensity (MFI) or its ratio. Data are mean +/− s.e.m. *P < 0.05, **P < 0.01, ***P < 0.001 (Two-tailed unpaired t-test).
Figure 3:
Figure 3:. Type I interferon induction in Irgm1-null fibroblasts is cGAS/STING-dependent.
a,b, Interferon-β (Ifnb1) and interferon-stimulated gene (Ifit1) expression in murine embryonic fibroblasts (MEFs) of indicated genotypes, treated with or without IFN-γ (16h) (n=3). c, Ifnb1 expression in MEFs co-treated with brefeldin A (2 μg/ml) and IFN-γ (n=3). d, Phosphorylation of TBK1 (S172), total TBK1, and β-actin (loading control) detected by Western blot in cells untreated or treated with IFN-γ. At right, densitometry of four independent experiments is shown. e, Ifnb1 expression in MEFs pretreated with TBK1 inhibitor (MRT-67307, 10 μM, 2h) and then IFN-γ (16h) (n=3). f, Ifnb1 and Ifit1 expression in MEFs transfected with two different siRNAs against Irf3 or control siRNA and then treated as shown (n=3). b, d, and e are representative of three independent experiments. a, c, and f are representative of two independent experiments. Data are mean +/− s.e.m. *P < 0.05, **P < 0.01, ***P < 0.001 (Two-tailed unpaired t-test).
Figure 4:
Figure 4:. Mitophagic flux deficit drives type I IFN response in Irgm1-null fibroblasts.
a, Mitochondria (mt)-mKeima-expressing murine embryonic fibroblasts (MEFs) (representative images, left) analyzed for pixel area in red channel (acidic mitolysosomes), normalized to signal in green channel (total mitochondria) (scale bar, 20 μm). MEFs were untreated, treated with IFN-γ, or starved (Starv.) by incubation in HBSS buffer. Quantification at right (n=12). b, Lysosomal mass assessed by LysoTracker fluorescence in flow cytometry. Representative histogram at left, quantification at right (n=12). c, Relative acidic pH measured by ratiometric Lysosensor yellow/blue dye (n=9). d, Cathepsin activity measured by cleavage of Magic Red substrate (n=3). Bafilomycin A1 (BafA1, 100 nM) was used as negative control in (b) and (d). e, LAMP1 fluorescence measured by flow cytometry (MFI, mean fluorescence intensity) (n=3). f, Interferon-β (Ifnb1) expression in MEFs preloaded with photoactivatable acidic nanoparticles (aNPs), treated with IFN-γ and then exposed to UV light (n=9). g,h, Ifnb1 and Ifit1 expression in MEFs co-treated with IFN-γ and 1 μM Torin1 (n=9) (g) or Oligomycin + Antimycin (O+A, 10 μM each) (n=3) (h). i, j, Ifnb1 and Ifit1 expression in MEFs transfected with two different siRNAs against Pink1 (n=3) (i) or Drp1 (n=3) (j) or control siRNA followed by treatment as shown. b, c, d and e are expressed as fold change of MFI. a, h and j are representative of three independent experiments. c, e, and i are representative of two independent experiments. b, d, f and g are pooled from at least three independent experiments. Data are mean +/− s.e.m. *P < 0.05, **P < 0.01, ***P < 0.001, ****P < 0.0001 (Two-tailed unpaired t-test).
Figure 5:
Figure 5:. Tissue-selective involvement of cGAS/STING in autoimmune pathology of Irgm1-null mice.
a,c, Representative H&E sections of lungs, salivary glands (submandibular), lacrimal glands, and pancreas from indicated genotypes (n=3-6/genotype) (scale bars, 100 μm, except pancreas [1000 μm]). b,d, Autoantibodies against indicated antigens, measured in serum of animals (n=3-4 mice/genotype). e, Cytokine levels in serum of animals (n=5 [Mb21d1−/−, Irgm1−/−Tmem173−/−]; n=6 [Irgm1+/+, Tmem173−/−, Irgm1−/−Mb21d1−/−]; n=8 [Irgm1−/−]). Data are mean +/− s.e.m. #P = 0.08, *P < 0.05, **P < 0.01, ***P < 0.001, ****P < 0.0001 (one-way ANOVA with Tukey’s adjustment).
Figure 6:
Figure 6:. Type I IFN induction in Irgm1-null macrophages is TLR7-dependent.
a, BMDMs from the indicated strains were treated as shown and then analyzed for expression of Ifnb1, Ifit1, and Irf7 by qPCR (n=6). Results derive from cultures from two animals. * p ≤ 0.05 (one-way ANOVA with Tukey’s multiple comparison test). b,c, BMDMs underwent Tlr7 silencing with four different shRNA constructs (or control), were treated as shown, and then analyzed for expression of Ifnb1 (b) and Ifit1 (c) (n=3). Results are representative of two independent experiments. d, BMDMs were stained with HSP60 and p62 and analyzed for colocalization (Mander’s coefficient) (n=7) (scale bar, 10 μm). e, Mitochondria-mKeima-expressing BMDMs (representative images, left) were analyzed for pixel area in red channel (mitolysosomes) and normalized by signals in green channel (total mitochondria) (scale bar, 10 μm). Bafilomycin (BafA) treatment is used as negative control (n=6). f-h, Ifnb1 and Ifit1 expression by qPCR in BMDM treated with 3-methyladenine (3-MA, 5 mM) (n=3) (f) or LY94002 (10 μM) (g) or silenced for Pink1 (n=3) (h) prior to being left untreated or treated with IFN-γ. a and d are representative of three independent experiments. b, c, e, f, g, and h are representative of two independent experiments. Data are mean +/− s.e.m. *P < 0.05, **P < 0.01, ***P < 0.001, ****P < 0.0001 (Two-tailed unpaired t-test).

Comment in

References

    1. Thorlacius GE, Wahren-Herlenius M & Ronnblom L An update on the role of type I interferons in systemic lupus erythematosus and Sjogren's syndrome. Curr Opin Rheumatol 30, 471–481 (2018). - PubMed
    1. Crow YJ & Manel N Aicardi-Goutieres syndrome and the type I interferonopathies. Nature reviews. Immunology 15, 429–440 (2015). - PubMed
    1. Rodero MP & Crow YJ Type I interferon-mediated monogenic autoinflammation: The type I interferonopathies, a conceptual overview. J Exp Med 213, 2527–2538 (2016). - PMC - PubMed
    1. West AP et al. Mitochondrial DNA stress primes the antiviral innate immune response. Nature 520, 553–557 (2015). - PMC - PubMed
    1. Rongvaux A et al. Apoptotic caspases prevent the induction of type I interferons by mitochondrial DNA. Cell 159, 1563–1577 (2014). - PMC - PubMed

Publication types

MeSH terms