. 2021 Feb;53(2):174-184.
doi: 10.1038/s41588-020-00767-x. Epub 2021 Jan 28.

Genome-wide association analyses of post-traumatic stress disorder and its symptom subdomains in the Million Veteran Program

Collaborators, Affiliations

Genome-wide association analyses of post-traumatic stress disorder and its symptom subdomains in the Million Veteran Program

Murray B Stein et al. Nat Genet. 2021 Feb.

Abstract

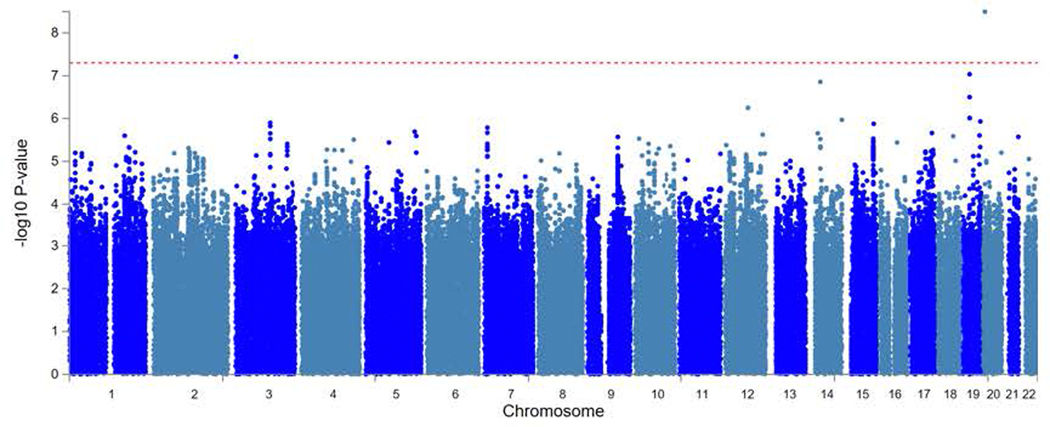
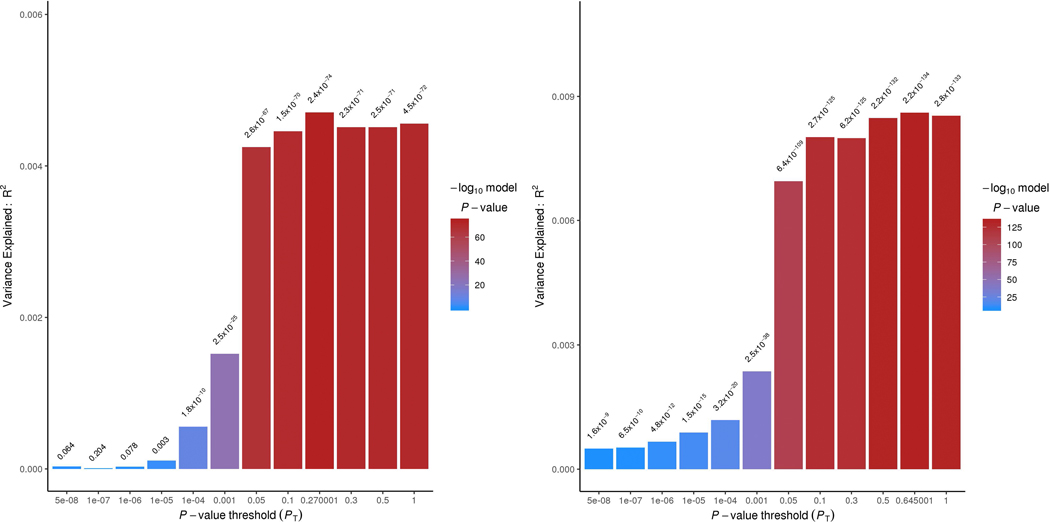
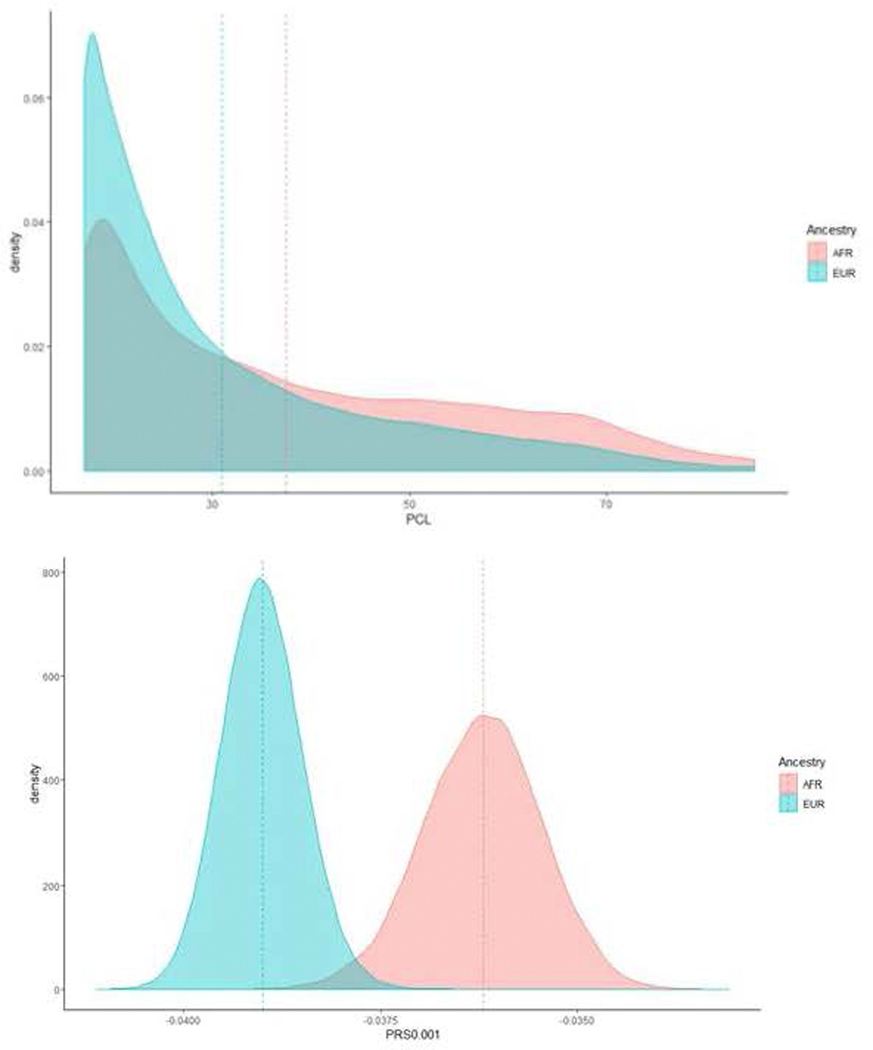
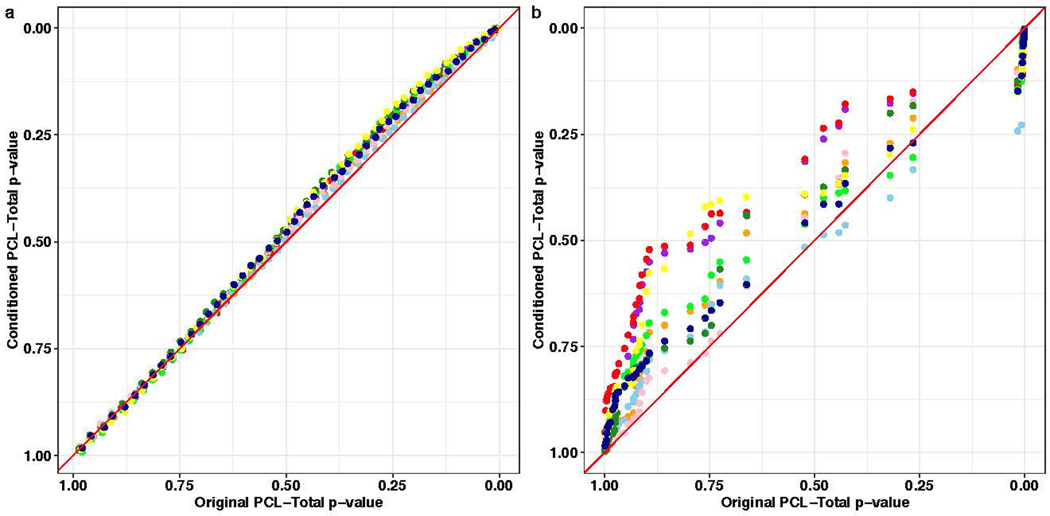
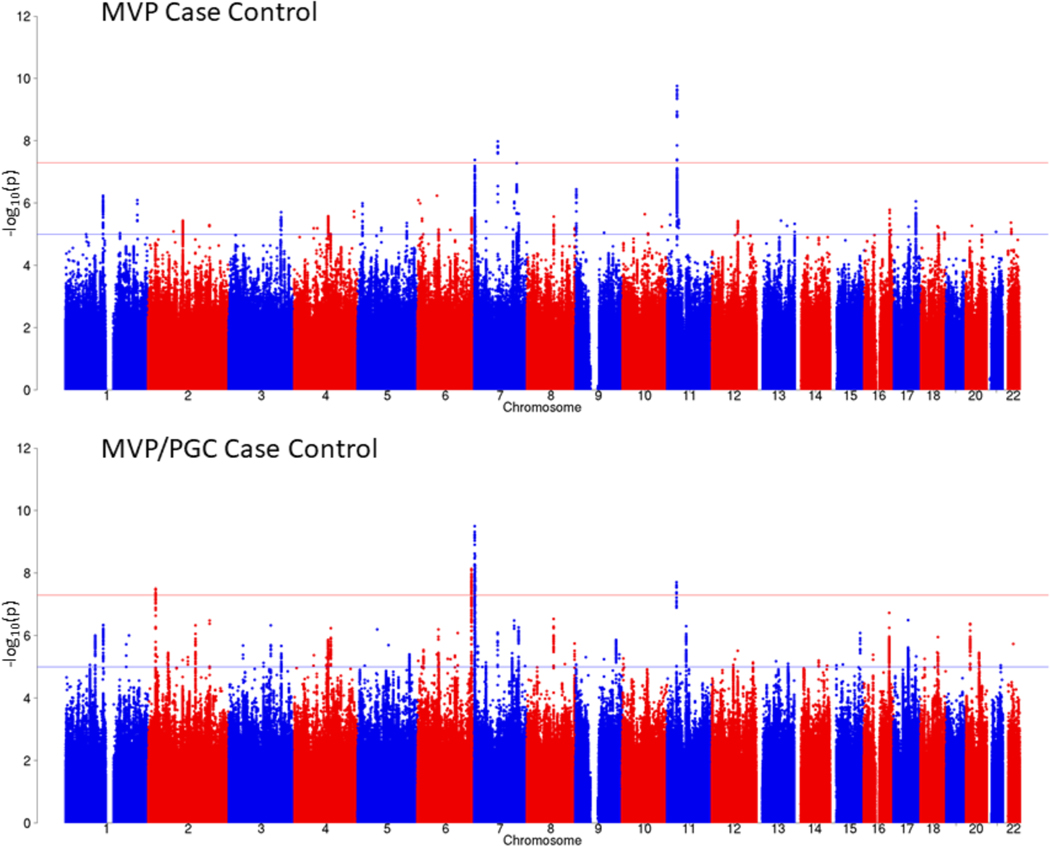
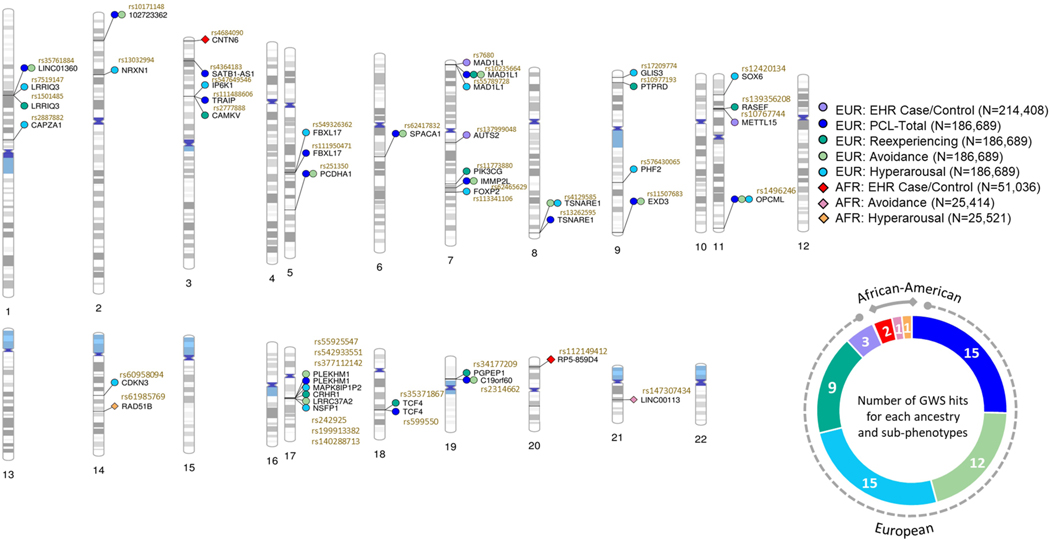
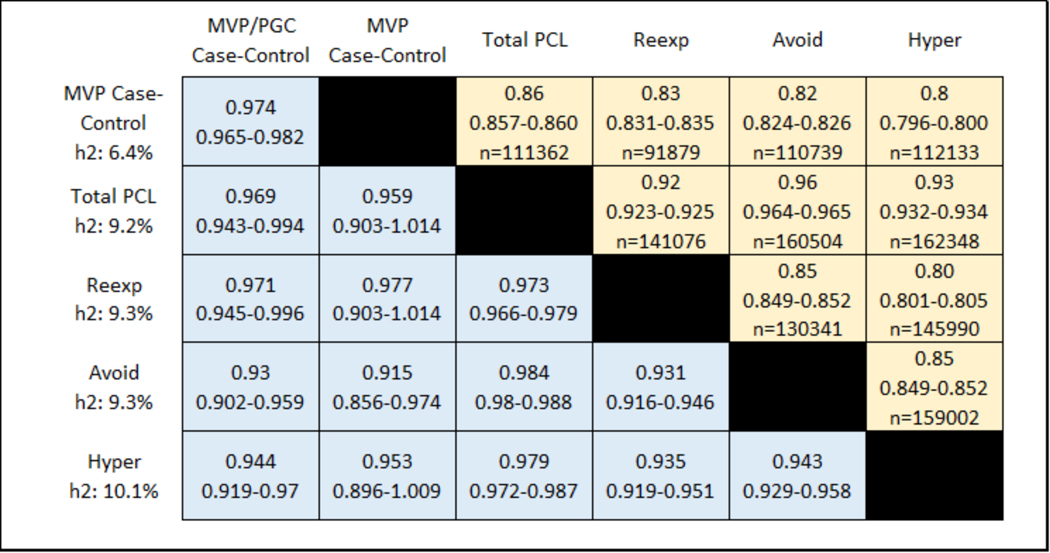
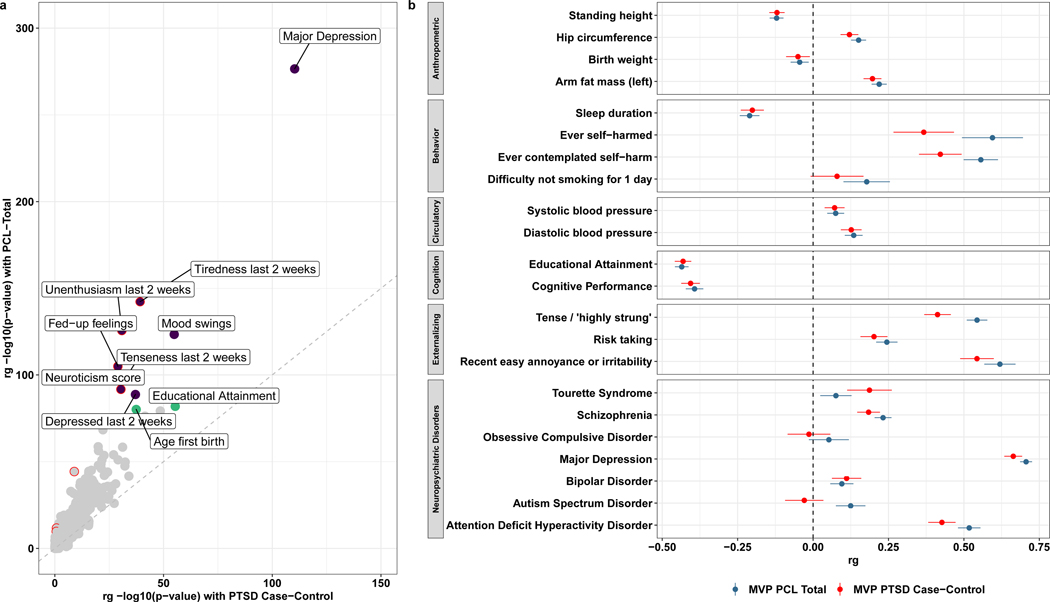
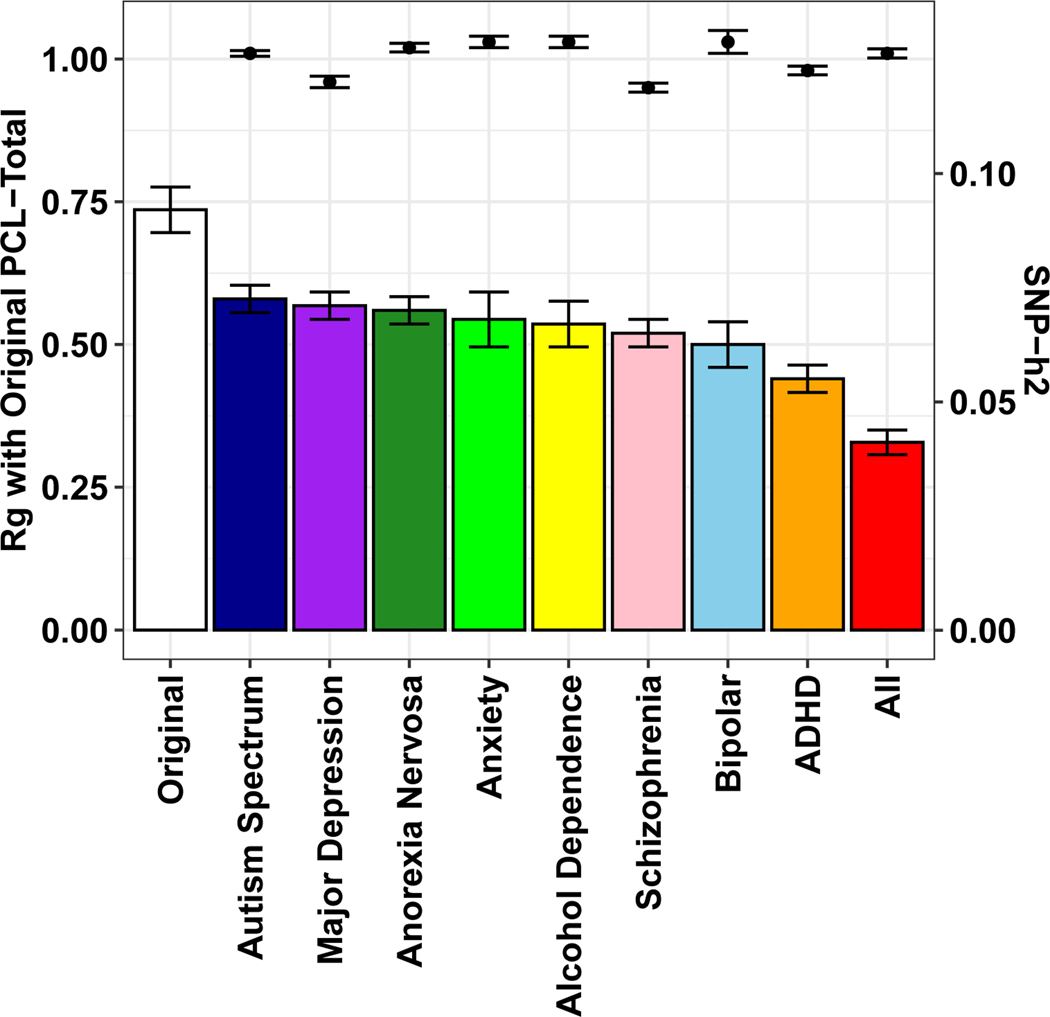
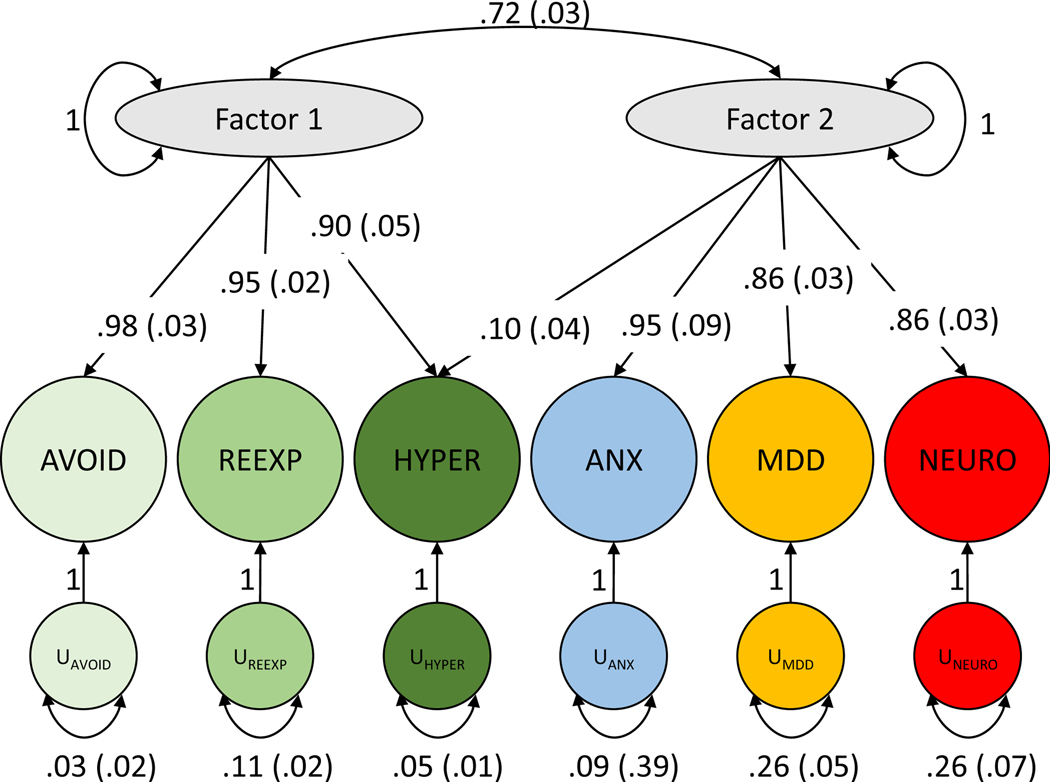
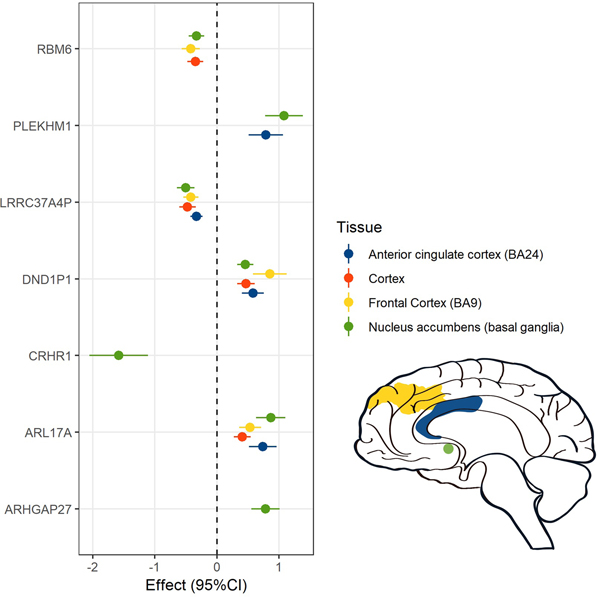
We conducted genome-wide association analyses of over 250,000 participants of European (EUR) and African (AFR) ancestry from the Million Veteran Program using electronic health record-validated post-traumatic stress disorder (PTSD) diagnosis and quantitative symptom phenotypes. Applying genome-wide multiple testing correction, we identified three significant loci in European case-control analyses and 15 loci in quantitative symptom analyses. Genomic structural equation modeling indicated tight coherence of a PTSD symptom factor that shares genetic variance with a distinct internalizing (mood-anxiety-neuroticism) factor. Partitioned heritability indicated enrichment in several cortical and subcortical regions, and imputed genetically regulated gene expression in these regions was used to identify potential drug repositioning candidates. These results validate the biological coherence of the PTSD syndrome, inform its relationship to comorbid anxiety and depressive disorders and provide new considerations for treatment.


Figures

Extended Data Fig. 1
Extended Data Fig. 1. Manhattan plot of MVP AFR case-control GWAS
Horizontal red line indicates P < 5 × 10⁻⁸. P-values are uncorrected. Results are based on logistic regression.
Extended Data Fig. 2
Extended Data Fig. 2. Polygenic risk scores in MVP and PGC-PTSD
Polygenic risk score (PRS) from MVP EUR case-control (left) and EUR PCL-total (right) applied to PGC-PTSD case-control phenotype with varying P-value thresholds (PT) on the x-axis and explained variance (R2) on the y-axis. The approximate estimate of the explained variance was calculated using a multivariate regression model. P values reported are two sided, and Bonferroni correction accounting for the number of P-value thresholds tested is P = 2.38 × 10⁻⁴.
Extended Data Fig. 3
Extended Data Fig. 3. Symptom and polygenic risk scores in veterans of African and European ancestry
Top shows density plot of PCL-total scores in veterans of AFR (salmon color) and EUR (teal color) ancestry. Bottom shows density plot of PRS scores (at P-value threshold 0.001) for MVP PCL AFR (salmon color) and MVP PCL EUR (teal color) into PGC PTSD EUR.
Extended Data Fig. 4
Extended Data Fig. 4. Gene Ontology (GO) term and GTEx tissue enrichment
a, Quantile-quantile plots between Gene Ontology (GO) term enrichment (one-sided test for positive relationship between tissue and genetic association) in original PCL-Total and conditioned PCL-Total (blue, autism spectrum disorder; purple, major depression; dark green, anorexia nervosa; light green, anxiety; pink, schizophrenia; light blue, bipolar disorder; orange, attention deficit hyperactivity disorder; red, all eight disorders simultaneously). b, Quantile-quantile relationship between GTEx tissue enrichment (one-sided test for positive relationship between tissue and genetic association) in original PCL-total and conditioned PCL-Total. To avoid over-plotting, enrichment P-values were divided into quantiles. Red diagonal lines indicate a one-to-one relationship between original and conditioned PCL-Total gene set and tissue enrichments. Two-sided tests were used to compare enrichment results.
Figure 1 |
Figure 1 |. Manhattan plot for the MVP case-control GWAS (top) and for the MVP/PGC GWAS meta-analysis in EUR samples (bottom).
GWAS was performed using logistic regression, co-varying for age, sex, and the first 10 principal components of ancestry. Meta-analysis was conducted with METAL using the inverse variance weighting method. Bonferroni correction was used to correct for multiple comparisons; associations with P ≤ 5 × 10⁻⁸ (indicated by the horizontal red bar) were considered to be genome-wide significant.
Figure 2 |
Figure 2 |. Genome-wide significant (P < 5 × 10⁻⁸) findings, by European (circles) and African (diamonds) ancestry, for PTSD EHR case-control, PCL-Total score and each of the PTSD subcomponents (avoidance, hyperarousal, and re-experiencing).
There were no genome-wide significant results for the African case-control and re-experiencing traits. LD independent SNPs for each phenotype and the nearest gene are labeled. The donut chart summarizes the number of hits for each phenotype in the two populations. The genes labelled are significant following regression test for a two-sided P-value and applied Bonferroni-threshold for multiple testing (0.05/k SNPs = P < 5 × 10⁻⁸).
Figure 3 |
Figure 3 |. Phenotypic (above diagonal) and genetic (below diagonal) correlations between case-control, PCL-Total and subscale scores.
Shown are correlation point estimates, 95% CIs, and n (sample size). SNP-heritability (h2) is shown in the left column. For phenotypic correlations, those for case-control are point-biserial correlations, and all others are Pearson correlations.
Figure 4 |
Figure 4 |. LDSC genetic correlation (rg) analyses in EUR showing traits from UK Biobank and PGC psychiatric disorders.
a, Comparison of rg between PTSD case-control definition and PCL-Total. The grey diagonal indicates perfect linearity between PTSD case-control and PCL-Total genetic correlates. The top ten genetic correlates of PCL-Total are labeled, with purple data points indicating positive rg and green data points indicating negative rg. Data points in a circled in red indicate significant difference in rg magnitude between PTSD and PCL-Total. b, Plot showing a wide range of phenotypes and their rg; the vertical dashed line indicates rg equal to zero.
Figure 5 |
Figure 5 |
PCL-Total SNP-heritability (SNP-h2; bars and standard error; right y-axis) and genetic correlation (rg; data points and standard error; left y-axis) relative to original PCL-Total (n = 186,689) after conditioning with each mental health phenotype on the x-axis.
Figure 6 |
Figure 6 |. Genomic SEM model with confirmatory factor analysis indicating two correlated factors, the first consisting of PTSD symptoms and the second consisting of anxiety, major depressive disorder, and neuroticism.
Comparative fit index (CFI) = 0.999 (typically interpreted as 0.90–0.95 indicating marginal fit).
Figure 7 |
Figure 7 |. Association of genetically-regulated transcriptomic changes with PCL-Total (n = 186,689) in the four brain regions identified by the LDSC partitioned heritability analyses.
Betas and 95% confidence intervals are reported for each association.

References

    1. American Psychiatric Association, Diagnostic and Statistical Manual of Mental Disorders, 5th Edition, (Arlington, VA, 2013).
    1. Shalev A, Liberzon I. & Marmar C. Post-traumatic stress disorder. N. Engl. J. Med. 376, 2459–2469 (2017). - PubMed
    1. Kessler RC & Wang PS The descriptive epidemiology of commonly occurring mental disorders in the United States. Annu. Rev. Public Health 29, 115–129 (2008). - PubMed
    1. Atwoli L, Stein DJ, Koenen KC & McLaughlin KA Epidemiology of posttraumatic stress disorder: prevalence, correlates and consequences. Curr. Opin. Psychiatry 28, 307–11 (2015). - PMC - PubMed
    1. Stein MB, Jang KL, Taylor S, Vernon PA & Livesley WJ Genetic and environmental influences on trauma exposure and posttraumatic stress disorder symptoms: a twin study. Am. J. Psychiatry 159, 1675–1681 (2002). - PubMed

METHODS-ONLY REFERENCES

    1. Das S. et al. Next-generation genotype imputation service and methods. Nat. Genet. 48, 1284–1287 (2016). - PMC - PubMed
    1. Purcell S. et al. PLINK: a tool set for whole-genome association and population-based linkage analyses. Am. J. Hum. Genet. 81, 559–575 (2007). - PMC - PubMed
    1. Price AL et al. Principal components analysis corrects for stratification in genome-wide association studies. Nat. Genet. 38, 904–909 (2006). - PubMed
    1. Genomes Project C. et al. A global reference for human genetic variation. Nature 526, 68–74 (2015). - PMC - PubMed
    1. Wolfe D, Dudek S, Ritchie MD & Pendergrass SA Visualizing genomic information across chromosomes with PhenoGram. BioData Min. 6, 18 (2013). - PMC - PubMed

Publication types