

Integrating human brain proteomes with genome-wide association data implicates new proteins in Alzheimer's disease pathogenesis
- PMID: 33510477
- PMCID: PMC8130821
- DOI: 10.1038/s41588-020-00773-z
Integrating human brain proteomes with genome-wide association data implicates new proteins in Alzheimer's disease pathogenesis
Abstract
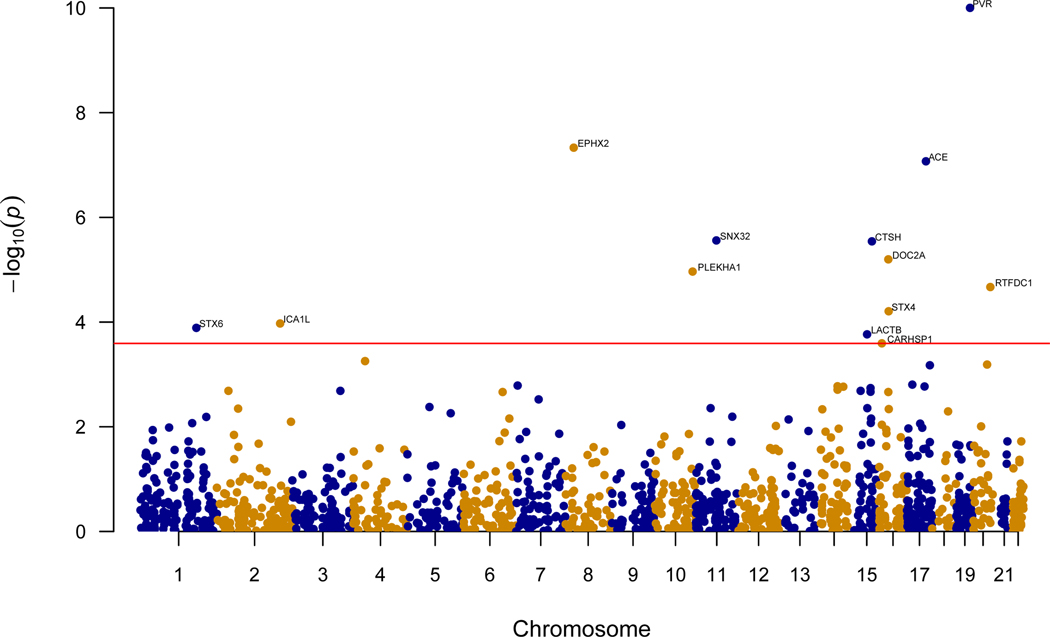
Genome-wide association studies (GWAS) have identified many risk loci for Alzheimer's disease (AD)1,2, but how these loci confer AD risk is unclear. Here, we aimed to identify loci that confer AD risk through their effects on brain protein abundance to provide new insights into AD pathogenesis. To that end, we integrated AD GWAS results with human brain proteomes to perform a proteome-wide association study (PWAS) of AD, followed by Mendelian randomization and colocalization analysis. We identified 11 genes that are consistent with being causal in AD, acting via their cis-regulated brain protein abundance. Nine replicated in a confirmation PWAS and eight represent new AD risk genes not identified before by AD GWAS. Furthermore, we demonstrated that our results were independent of APOE e4. Together, our findings provide new insights into AD pathogenesis and promising targets for further mechanistic and therapeutic studies.
Figures
References
-
- Ballard C, et al. Alzheimer’s disease. Lancet (London, England) 377, 1019–1031 (2011). - PubMed
Publication types
MeSH terms
Substances
Grants and funding
- U01 AG046152/AG/NIA NIH HHS/United States
- IK4 BX005219/BX/BLRD VA/United States
- R01 AG061800/AG/NIA NIH HHS/United States
- P30 AG066511/AG/NIA NIH HHS/United States
- U01 AG061356/AG/NIA NIH HHS/United States
- R01 AG053960/AG/NIA NIH HHS/United States
- R01 AG017917/AG/NIA NIH HHS/United States
- U01 AG061357/AG/NIA NIH HHS/United States
- P30 AG010161/AG/NIA NIH HHS/United States
- RC2 AG036547/AG/NIA NIH HHS/United States
- RF1 AG057470/AG/NIA NIH HHS/United States
- U01 MH115484/MH/NIMH NIH HHS/United States
- RF1 AG015819/AG/NIA NIH HHS/United States
- R01 AG056533/AG/NIA NIH HHS/United States
- I01 BX003853/BX/BLRD VA/United States
- R56 AG062256/AG/NIA NIH HHS/United States
- R56 AG062633/AG/NIA NIH HHS/United States
- R01 AG057911/AG/NIA NIH HHS/United States
- R56 AG060757/AG/NIA NIH HHS/United States
- P50 AG025688/AG/NIA NIH HHS/United States
- U24 NS072026/NS/NINDS NIH HHS/United States
- U01 AG046161/AG/NIA NIH HHS/United States
- P30 NS055077/NS/NINDS NIH HHS/United States
- R01 AG015819/AG/NIA NIH HHS/United States
LinkOut - more resources
Full Text Sources
Other Literature Sources
Medical
Miscellaneous
