. 2021 Jun;39(6):697-704.
doi: 10.1038/s41587-020-00806-2. Epub 2021 Jan 28.

Noncanonical open reading frames encode functional proteins essential for cancer cell survival

Affiliations

Noncanonical open reading frames encode functional proteins essential for cancer cell survival

John R Prensner et al. Nat Biotechnol. 2021 Jun.

Abstract

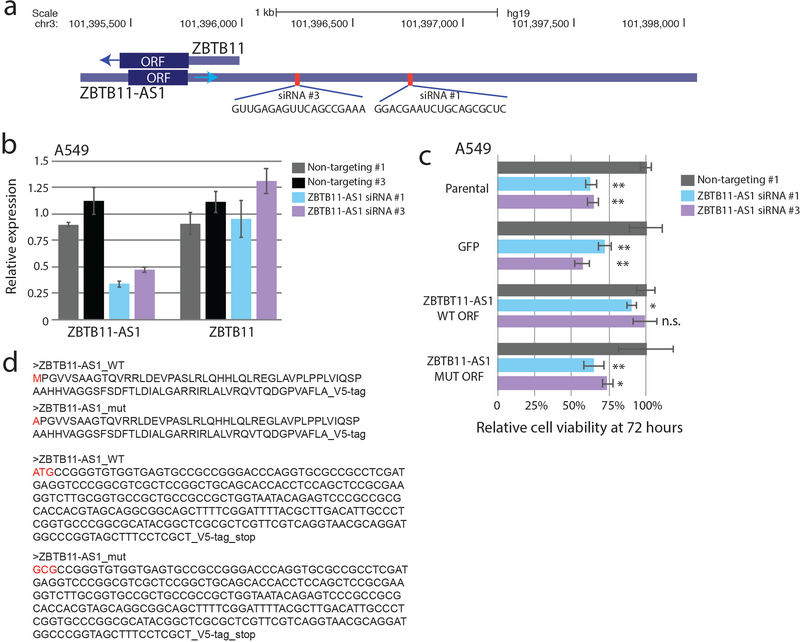
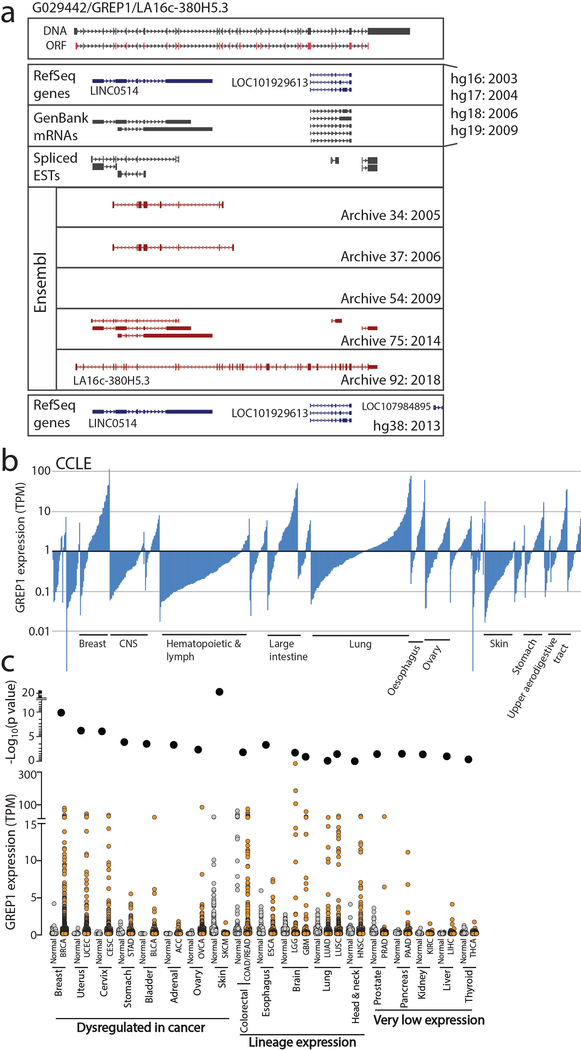
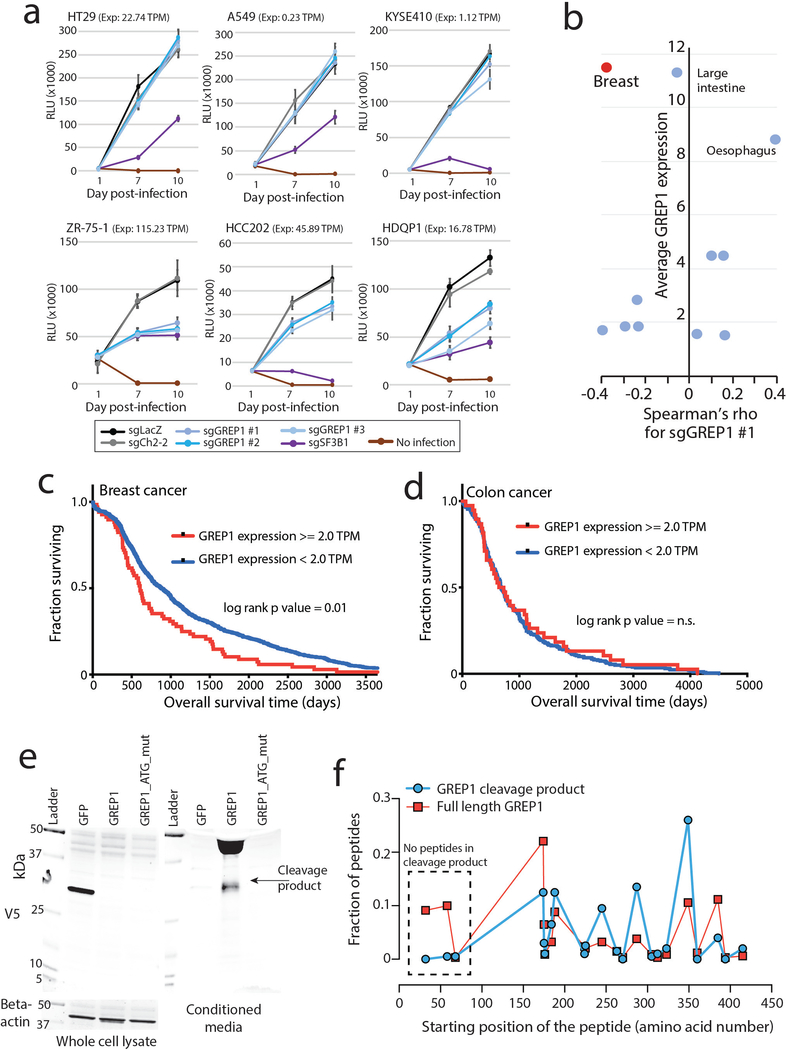
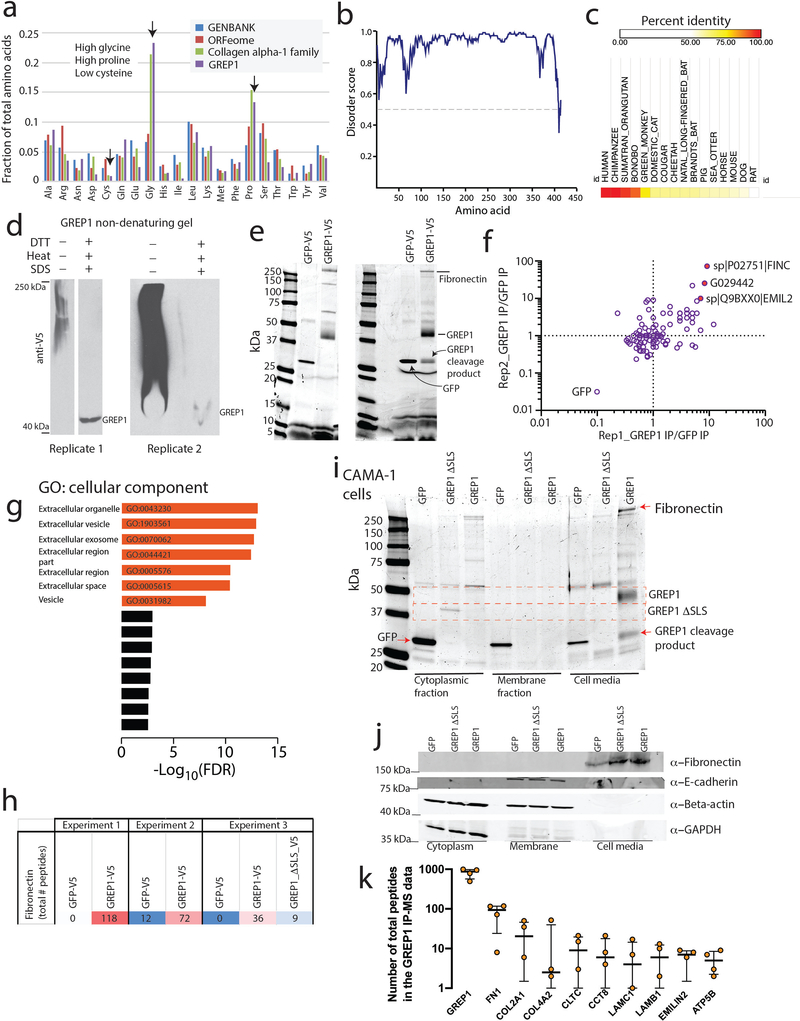
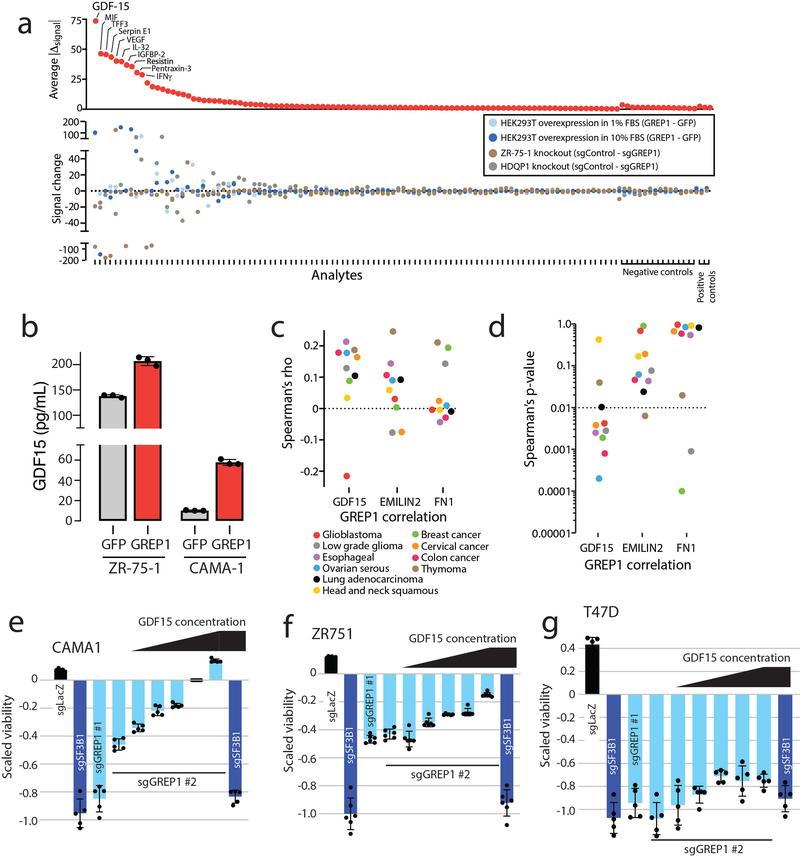
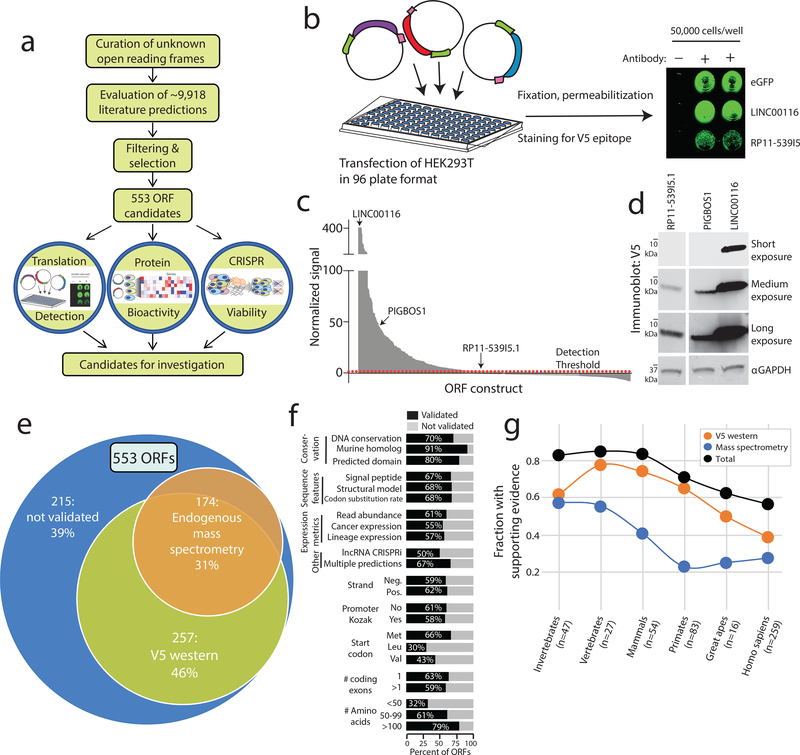
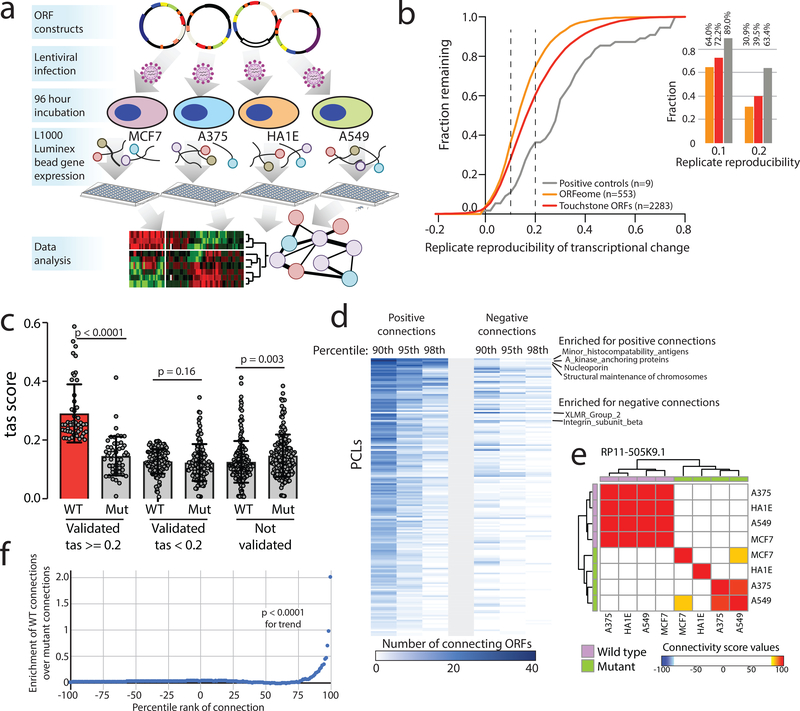
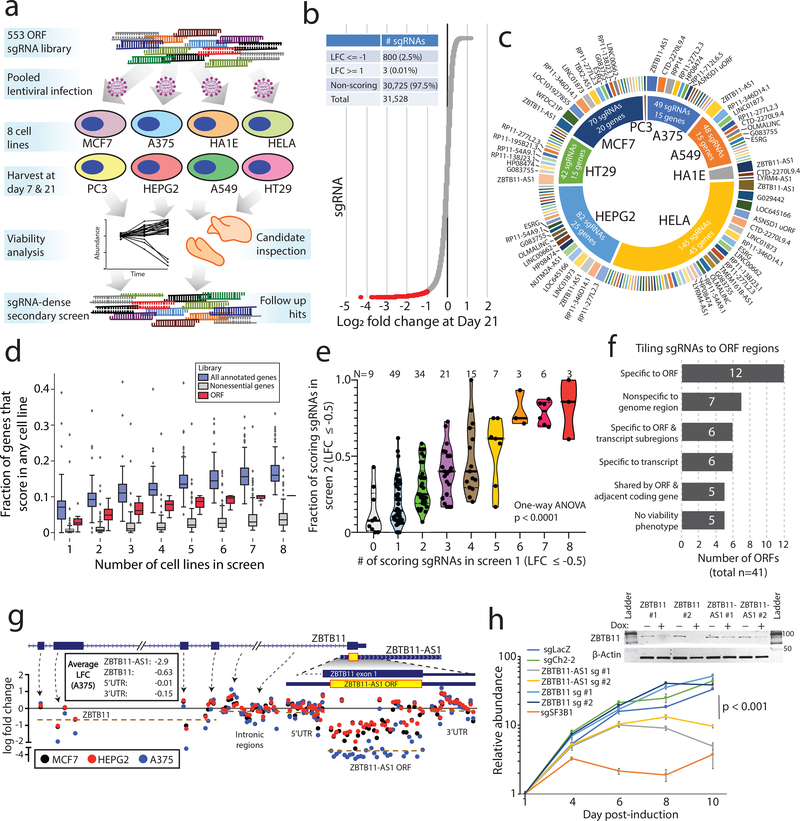
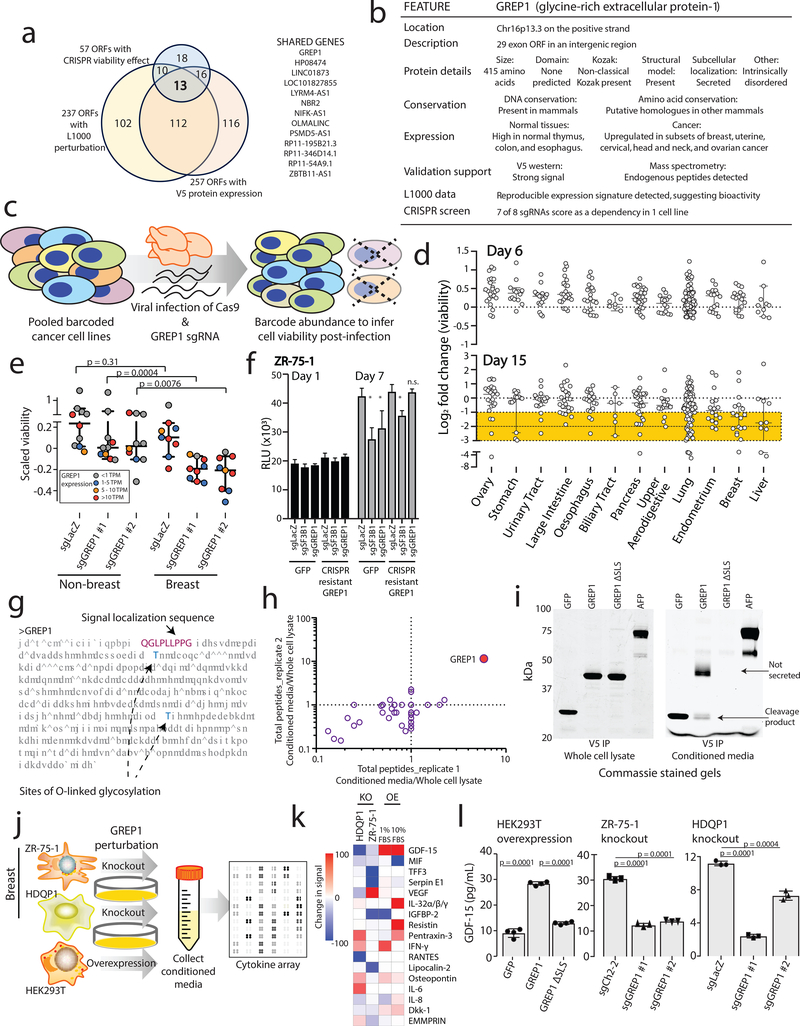
Although genomic analyses predict many noncanonical open reading frames (ORFs) in the human genome, it is unclear whether they encode biologically active proteins. Here we experimentally interrogated 553 candidates selected from noncanonical ORF datasets. Of these, 57 induced viability defects when knocked out in human cancer cell lines. Following ectopic expression, 257 showed evidence of protein expression and 401 induced gene expression changes. Clustered regularly interspaced short palindromic repeat (CRISPR) tiling and start codon mutagenesis indicated that their biological effects required translation as opposed to RNA-mediated effects. We found that one of these ORFs, G029442-renamed glycine-rich extracellular protein-1 (GREP1)-encodes a secreted protein highly expressed in breast cancer, and its knockout in 263 cancer cell lines showed preferential essentiality in breast cancer-derived lines. The secretome of GREP1-expressing cells has an increased abundance of the oncogenic cytokine GDF15, and GDF15 supplementation mitigated the growth-inhibitory effect of GREP1 knockout. Our experiments suggest that noncanonical ORFs can express biologically active proteins that are potential therapeutic targets.


Conflict of interest statement

Competing Interests Statement

The authors declare no relevant competing interests.

Figures

Extended Data Fig. 1
Extended Data Fig. 1. Generation and validation of a noncanonical ORF cDNA library.
a) Vector design and sequence details for the ORF library. The vector used is a modified version of the plx307 vector developed by the Genomic Perturbation Platform at the Broad Institute. b) Titration analyses of in cell western experiments. Three ORFs were chosen: eGFP (positive control), LINC00116 (high-expressing ORF), and RP11–539I5 (low expressing ORF). Increasing amounts of plasmid were transfected into increasing numbers of HEK293T cells as shown. c) Quantification the in cell western titration shown in b, demonstrating signal detection over noise and signal plateau. Signal was quantified using pixel density in the 800nM green color channel. d) Replicate experiments assessing signal-to-noise thresholds for a low-expressing ORF transfected into HEK293T cells with a low DNA plasmid concentration, as well as a high-expressing ORF (eGFP) transfected into HEK293T cells at a high DNA plasmid concentration. e) Example in cell western data in triplicate experiments for selected ORFs. f) Abrogation of protein translation via mutation of the ORF for selected examples. g) A systematic evaluation of in cell western signal for wild type and mutant ORFs for all pairs. ORFs are separated into those with signal above the baseline threshold, and those without reproducible signal. h) An immunoblot showing in vitro transcription/translation of selected tag-free ORFs using a wheat germ lysate system. Red arrows indicate the translated ORFs. Results were repeated in two independent experiments.
Extended Data Fig. 2
Extended Data Fig. 2. Analysis of paired wild-type and mutant constructs in L1000 data
a) A strategy for ORF mutagenesis strategy in which the start codon and downstream methionines were mutated to alanine. The shown amino acid sequence is a fictional sequence. b) A pie chart showing the number and percentage of amino acids changed per ORF from the mutagenesis. c) A violin plot showing the number of Perturbational Class (PCL) connections made at the 98th percentile for matched mutant and wild type constructs (n=47 for each, all data points are biologically independent experiments). P value by a two-tailed Wilcoxon matched pairs rank test. d) Left, the overall distribution of PCL connections across all ranks in wild type and mutant constructs (n=19,012 independent comparisons for each). Right, an inset image of distribution of PCL connections at high connectivity, showing a bias in connections made with wild type compared to mutant constructs (n=1,920 independent comparisons each). P value by a two-tailed Wilcoxon matched pairs rank test. e) All PCL connections in wild type constructs at either the >=95th percentile or <= −95th percentile, with the matched percentile connectivity in the mutant constructs. f) The distribution of percentile connectivity results in wild type or mutant constructs for the indicated genes. In brief, all ORF L1000 signatures were queried against all PCL classes and a percentile connectivity was generated for each individual cell line and for both wild type and mutant constructs. Cell line and construct data was then aggregated and ranked from highest to lowest connectivity. The rank positions of wild type and mutant ORFs were then plotted to reveal a depletion of mutant constructs at high connectivity scores. g) Two example heatmaps for the TINCR and SLC35A4 uORF plasmids showing clustering of PCL connectivity among wild type constructs that is not shared with mutant constructs. Purple bars denote wild type ORF experiments and green bars denote mutant ORF experiments. h) L1000 signature replicate reproducibility for all wild type and mutant pairs across all cell lines. All ORF signatures with at least one reproducible wild type signature are shown.
Extended Data Fig. 3
Extended Data Fig. 3. Validation of CRISPR hits via manual assays
a-i) CRISPR assays using doxycycline-inducible Cas9 in HeLa cells. Targets are divided in ones that validated and ones that did not. For each experiment, the right-set panel is qPCR data of expression 96 hours after induction of Cas9 with doxycycline. a) ZBTB11-AS1 b) HP08474 c) GREP1 d) RP11–54A9.1 e) G083755 f) OLMALINC g) CTD-2270L9.4 h) RP11–277L2.3 i) ASNSD1 uORF. j-k) CRISPR assays using stably-expressing A375 Cas9 cells. j) CTD-2270L9.4 k) ASNSD1 uORF. For all data in this figure, n=6 technical replicates for each data point. Error bars represent standard deviation. Data was also acquired a 3 independent biological replicates based on doxycycline dose level (0.2 ug/mL, 1.0 ug/mL and 2.0 ug/mL doxycycline, as well as 0 ug/mL doxycycline). The data shown are the 1.0 ug/mL dosing level, with similar results observed for the 0.2 ug/mL and 2.0 ug/mL doxycycline dosing levels.
Extended Data Fig. 4
Extended Data Fig. 4. Tiling CRISPR assays to elucidate functional non-canonical ORFs
a) A heatmap showing log fold change viability loss at Day +21 in the secondary CRISPR screen for the indicated non-canonical ORFs tested by multiple tiling sgRNA regions. b-e) Examples of non-canonical ORFs with a CRISPR tiling phenotype. b-e) Graphical representation of tiling CRISPR assays in which each dot represents an individual sgRNA. sgRNAs are mapped to their genomic loci and the genomic region of the tiling assay is shown. The location of the putative non-canonical ORF is shown in the gene annotation above. b) CTD-2270L9.4 c) OLMALINC d) RP11–54A9.1 e) RPP14 dORF / HTD2. f - k) Representative sgRNA log fold change data for the indicated transcripts. Each tiling experiment is classified as indicated. f) LINC00662 g) RP11–195B21.3 h) LYRM4-AS1 i) ESRG j) TCONS_I2_00007040 k) LINC01184.
Extended Data Fig. 5
Extended Data Fig. 5. Specific siRNA knockdown of ZBTB11-AS1 mRNA transcript causes a viability phenotype which is specifically rescued by the wild type ZBTB11-AS1 ORF
a) A schematic showing the genomic location and sequences for the two siRNAs used for ZBTB11-AS1. b) mRNA expression levels for ZBTB11-AS1 or ZBTB11 transcripts 48 hours after siRNA knockdown of ZBTB11-AS1 in A549 cells. N=3 independent replicates for all conditions. Barplots represent mean +/− standard deviation. c) Relative cell viability of A549 cells treated with ZBTB11-AS1 siRNAs at 72 hours. Parental A549 cells were used along with A549 cells expressing cDNAs for GFP, wild type ZBTB11-AS1 ORF sequence, or mutant ZBTB11-AS1 ORF lacking translational start sites. Only the wild-type ZBTB11-AS1 ORF sequence rescues the viability phenotype. N=6 independent replicates for all conditions. Barplots represent mean +/− standard deviation. d) DNA and amino acid sequences of the wild type and mutant ZBTB11-AS1 ORF cDNAs. * p < 0.05, ** p < 0.01. n.s., non-significant. For P values: Parental, non-targeting vs siRNA #1 P < 0.0001, non-targeting vs siRNA #2 P < 0.0001; GFP, non-targeting vs siRNA #1 P = 0.0008, non-targeting vs siRNA #2, P < 0.0001; WT ORF, non-targeting vs siRNA #1 P = 0.04, non-targeting vs siRNA #2 P = 0.83; MUT ORF, non-targeting vs siRNA #1 P = 0.001, non-targeting vs siRNA #2 P = 0.02. P values by a two-tailed Student’s T test.
Extended Data Fig. 6
Extended Data Fig. 6. The GREP1 locus and expression
a) A schematic representation of the GREP1 gene structure and the annotation of this locus in the indicated databases. The year of release for each database is indicated. b) mRNA expression level of GREP1 across tumor lineages in the Cancer Cell Line Encyclopedia. The Y axis is in a log10 scale. c) mRNA expression of GREP1 across tumor types using TCGA and GTex data. A two-tailed Student’s t-test was used to calculate significance of change between normal and cancer tissues. Cell lineages are grouped according to whether GREP1 expression is specifically modulated in cancer, universally expressed as a lineage gene, or not robustly expressed in the indicated lineage.
Extended Data Fig. 7
Extended Data Fig. 7. GREP1 is implicated in cell proliferation and breast cancer patient outcomes
a) Cell viability curves following GREP1 knockout in three sensitive and three insensitive cell lines. GREP1 expression in the Cancer Cell Line Encyclopedia is indicated in transcripts per million (TPM) b) A scatter plot showing lineage-specific correlation between cell viability and GREP1 mRNA expression on the X axis with the average GREP1 expression level on the Y axis. c) Overall survival for breast cancer patients in the TCGA database stratified by GREP1 expression. N=1,036 individual patients. N=969 GREP1-high and N=67 GREP1-low patients. Significance by a one-sided log-rank P value. d) Overall survival for colon cancer patients in the TCGA database stratified by GREP1 expression. N=296 individual patients. N=38 GREP1-high and N=258 GREP1-low patients. Significance by a one-sided log-rank P value. e) Immunoblot of V5-tagged GREP1 or GFP in HEK293T cells in both whole cell lysate and conditioned media. A mutant GREP1, in which translational start sites were mutated to alanine, lacks protein translation initiation ability. Results were repeated in three independent experiments. i) Abundance of mass spec peptides detected in the full length GREP1 or cleavage product GREP1 proteins. Peptide abundance is represented as a fraction of total peptides detected. All error bars represent standard deviation.
Extended Data Fig. 8
Extended Data Fig. 8. GREP1 is associated with the extracellular matrix
a) Total fraction of amino acid usage in the ORFeome, GENBANK, GREP1, and the Collagen alpha-1 family. Sequence similarities between GREP1 and the collagen family are indicated. b) Predicted disorder score for the GREP1 amino acid sequence. c) Amino acid conservation for detected homologs of GREP1 in the indicated species. d) Non-denaturing native western blot of GREP1 in conditioned media from HEK293T cells expressing V5-tagged GREP1. e) Representative Commassie-stained gels for immunoprecipitation of GREP1 from the conditioned media of HEK293T cells. Two representative biological replicates are shown. f) Enrichment of extracellular matrix proteins in the IP-MS data for GREP1 compared to IP-MS data for GFP. g) Gene Ontology Cellular Component analysis of proteins >= 2 fold enriched in GREP1 immunoprecipitation compared to GFP immunoprecipitations. h) IP MS total peptide count for fibronectin shown for three separate experiments. i) Commassie stain of V5 immunoprecapitation of V5-tagged GFP, GREP1 del_SLS or GREP1 constructs expressed in CAMA-1 cells following fractionation of cell lysate into cytoplasmic, membrane and cell media components. Results were repeated in 2 independent experiments. j) Western blot of endogenous fibronectin, E-cadherin, beta-actin and GAPDH in cell lysate or cell culture media for CAMA-1 cells expressing GFP, GREP1 del_SLS or GREP1 constructs as in panel i. Results were repeated in two independent experiments. k) IP mass spectrometry data showing the total peptide count for GREP1 and other top-scoring proteins following IP of V5-tagged GREP1 in HEK293T, ZR-75–1, and CAMA-1 cells. N=4 independent IP MS experiments. Lines represent median +/− interquartile (25–75%) range.
Extended Data Fig. 9
Extended Data Fig. 9. GREP1 regulates GDF15 in vitro and correlates with GDF15 expression in patient tumor tissues.
a) Cytokine profiling in HEK293T cells with transient ectopic GREP1 or GFP overexpression, ZR-75–1 cells with stable GREP1 knockout, or HDQP1 cells with stable GREP1 knockout. The change in signal abundance was calculated for each control/GREP1 pair. To rank cytokines, the average of the absolute values for the individual signal changes was plotted. b) GDF15 abundance by ELISA in ZR-75–1 and CAMA-1 cells overexpressing a GREP1 or GFP cDNA plasmid. N=3 technical replicates. N=2 independent experiments performed, with representative results shown. c) Spearman’s rho for GREP1 expression correlation with GDF15, EMILIN2, or FN1 in the indicated TCGA datasets. d) Spearman’s p value for the GREP1 correlation coefficient for GREP1 correlation with GDF15, EMILIN2, or FN1 in the indicated TCGA datasets. e-g) Recombinant GDF15 partially rescues GREP1 knockout. CAMA-1, ZR-75–1 or T47D Cas9 cells were infected with the indicated sgRNAs. 24 hours after infection, cells were treated with vehicle control or increasing concentration of recombinant human GDF15 as shown. Relative abundance was measured 7 days after infection. N=5 for all conditions in panel e. N=6 for all conditions in panel f. N=5 for all conditions in panel g. All error bars represent standard deviation. Two independent experiments were performed for panels e-g.
Figure 1:
Figure 1:. Identification of translated unannotated or unstudied open reading frames.
a) A schematic overview of the research project. b) The experimental set-up for in vitro detection of protein translation by transfection of V5-tagged cDNAs into HEK293T cells followed by in-cell western blotting. c) In-cell western blot signal for each ORF. Values are the average of three replicates. d) Immunoblot correlates for three ORFs identified by in-cell western blotting, marked in panel c. Results were repeated in three independent experiments. e) An overview of biological support for translation of a subset of ORFs. f) Subgroup analyses of ORF biological features demonstrating fractions of ORFs supported by ectopic V5 translation assays, mass spectrometry or both. g) The fraction of ORFs supported by evidence of translation across major epochs in evolutionary time. Evidence of translation shown as the fraction of ORFs with V5 western blot signal, endogenous mass spectrometry peptides, and the summation of both.
Figure 2:
Figure 2:. Defining bioactive ORFs through gene expression profiling.
a) A schematic showing the experimental set-up. Briefly, ORFs were individually transduced into 4 cell lines and expression was profiled 96 hours after infection using the L1000 platform. b) The fraction of ORFs resulting in transcriptional perturbation when overexpressed in 4 cell lines (A375, MCF7, HA1E, A549) compared to all profiled known genes and assay positive controls. Inset at the right, a barplot enumerating the percentage of ORFs in each group with a transcriptional signature above the indicated reproducibility threshold. c) A barplot showing the strength of transcriptional perturbation following expression of the indicated groups of wild-type or mutant ORF constructs. N for each pair of wild-type or mutant ORF data is indicated in the figure. P value by a two-sided Wilcoxon test. Error bars represent standard deviation. d) A heatmap showing the number of ORFs demonstrating positive or negative connections with individual Perturbational Classes (PCLs) at the indicated percentile rank. e) An example of RP11–505K9.1 showing the high concordance of connectivity signatures when the wild type ORF is expressed compared to the ORF with mutated translational start sites. f) Bland-Altman analysis demonstrating enrichment of high-ranking connectivity values following expression of wild type ORFs compared to mutant ORFs (N=19,012 for each). P value by a two-sided Wilcoxon test.
Figure 3:
Figure 3:. CRISPR screening to identify unknown ORFs implicated in cancer cell viability.
a) A schematic showing the experimental design, including a primary screen in 8 cancer cell lines and a secondary screen in 3 cancer cell lines. b) The distribution of sgRNA depletion at day +21 following lentiviral infection in the CRISPR screen across 8 cell lines. 2.5% of sgRNAs were identified as depleted in a particular cell line with a log2 fold change of <= −1. c) The distribution of nominated ORFs. For each cell line, the inner circle, the number of sgRNAs with a log2 fold change of <= −1, and the number of nominated genes are shown. The outer circle shows the ORFs nominated in that cell line, with the ORFs ranked by the number of supporting sgRNAs. The thickness of the outer circle boxes reflects the number of sgRNAs supporting that ORF’s nomination. Only ORFs nominated with >= 2 sgRNAs are shown. d) A boxplot showing the fraction of annotated genes, new ORF genes, and RNAi-defined nonessential genes that score as a vulnerability gene in the indicated number of cell lines. Each data point represents a unique cell line. The cell lines for ORF genes represent the cell lines used in this study. For annotated genes, the randomly selected cell lines from the Dependency Map were used. Box plots represent median with interquartile ranges (25% - 75%); the whiskers extend to the last data point up to 1.5x the interquartile distance from the box with individual data points shown beyond this range. e) The correlation between the number of sgRNAs producing a viability phenotype for a given ORF in the primary and the fraction of sgRNAs producing a viability phenotype in the secondary screen. The number of ORFs included in each group is indicated. P value by a one-way ANOVA. f) A barplot showing the number of ORFs with each category of viability phenotype in the tiling sgRNA CRISPR screens. g) An example of ZBTB11 and ZBTB11-AS1 for tiling CRISPR data, showing enhanced cell killing when the ZBTB11-AS1 ORF is knocked-out. Each data point represents a sgRNA. Data points are color-coded for the indicated cell lines. h) Individual CRISPR knockout experiments in a doxycycline-inducible Cas9 HeLa cell line using two sgRNAs targeting exclusively ZBTB11 or two sgRNAs targeting both the ZBTB11-AS1 ORF and ZBTB11. The line plot shows cell viability measured by cellular ATP following induction of Cas9 activity with 2ug/mL doxycycline. sgLacZ and sgCh2–2 are non-cutting and cutting negative controls, respectively, and sgSF3B1 is a pan-lethal positive control. N=6 technical replicates for each data point with two independent experiments performed. The inset western blot shows ZBTB11 protein abundance upon induction of Cas9. P value by a two-tailed Student’s t-test. Error bars represent standard deviation.
Figure 4:
Figure 4:. Characterizing GREP1 as a cancer dependency gene in breast cancer.
a) Nomination of candidate ORFs with evidence for protein translation, gene expression effect, and CRISPR phenotype. b) A table summarizing the characteristics of the GREP1 gene. c) A schematic showing the overview of pooled CRISPR screening. d) Log2 fold change abundance of cancer cell lines at Day 6 and Day 15 following pooled CRISPR screening. Cell lineages are ranked based on the median log2 fold change at Day 15. Each data point represents a unique cell line. e) Individual CRISPR validation experiments for GREP1 in a panel of non-breast (n=10) and breast (n=9) cell lines. Data are scaled so that 0 reflects the sgCh2–2 negative cutting control and −1 reflects the degree of viability loss from the sgSF3B1 positive control. Data were obtained 7 days after lentiviral infection. P value by a two-tailed Mann-Whitney test. f) Rescue of the CRISPR phenotype with overexpression of a CRISPR resistant GREP1 construct and not GFP. An asterisk (*) indicates a P value < 0.05. P values are as follows: for GFP cells, sgLacZ vs sgSF3B1 P = 0.0005, sgLacZ vs sgGREP1 P = 0.013; for GREP1 cells, sgLacZ vs sgSF3B1 P = 0.0005, sgLacZ vs sgGREP1 P = 0.08. P values by a two-tailed Student’s t-test. N=4 technical replicates per data point with two independent experiments performed. g) The GREP1 amino acid sequence with the signal localization sequence and the sites of glycosylation indicated. h) Immunoprecipitation followed by mass spectrometry of HEK293T conditioned media and whole cell lysate following ectopic expression of a pool of V5-tagged ORFs. The x and y axes represent the total number of MS peptides detected in two independent experiments. i) Expression of V5-tagged GREP1 or a truncated GREP1 lacking the N-terminal signal localization sequence in HEK293T cells. Cell lysates or conditioned media were subjected to V5 immunoprecipitation and then protein was visualized by Commassie stain. Two independent biological experiments performed. j) Experimental design for secreted cytokine profiling following GREP1 perturbation. k) A heatmap showing individual cell line changes in cytokine abundance following GREP1 perturbation. Cytokines are ranked according to the average of the absolute value of signal change for each cell line. l) Validation of GDF15 modulation upon GREP1 perturbation by ELISA in the indicated cell lines. N = 4 (HEK293T) or 3 (ZR-75–1, HDQP1) technical replicates per sample with either two (HDQP1) or three (ZR-75–1, HEK293T) independent experiments performed. P value by a two-tailed Student’s t-test. All error bars represent standard deviation.

References

    1. Ewing B & Green P Analysis of expressed sequence tags indicates 35,000 human genes. Nat. Genet 25, 232–234 (2000). - PubMed
    1. Fields C, Adams MD, White O & Venter JC How many genes in the human genome? Nat. Genet 7, 345–346 (1994). - PubMed
    1. Liang F et al. Gene index analysis of the human genome estimates approximately 120,000 genes. Nat. Genet 25, 239–240 (2000). - PubMed
    1. Omenn GS et al. Progress on Identifying and Characterizing the Human Proteome: 2018 Metrics from the HUPO Human Proteome Project. J. Proteome Res. 17, 4031–4041 (2018). - PMC - PubMed
    1. Ingolia NT et al. Ribosome profiling reveals pervasive translation outside of annotated protein-coding genes. Cell Rep. 8, 1365–1379 (2014). - PMC - PubMed

Methods-Only References

    1. Xie W et al. Epigenomic analysis of multilineage differentiation of human embryonic stem cells. Cell 153, 1134–1148 (2013). - PMC - PubMed
    1. Chen J et al. Evolutionary analysis across mammals reveals distinct classes of long non-coding RNAs. Genome Biol. 17, 19 (2016). - PMC - PubMed
    1. Liu SJ et al. CRISPRi-based genome-scale identification of functional long noncoding RNA loci in human cells. Science 355 (2017). - PMC - PubMed
    1. Petersen TN, Brunak S, von Heijne G & Nielsen H SignalP 4.0: discriminating signal peptides from transmembrane regions. Nat. Methods 8, 785–786 (2011). - PubMed
    1. Kelley LA, Mezulis S, Yates CM, Wass MN & Sternberg MJ The Phyre2 web portal for protein modeling, prediction and analysis. Nat. Protoc 10, 845–858 (2015). - PMC - PubMed

Publication types

Substances