. 2021 Jan 12:11:610000.
doi: 10.3389/fphys.2020.610000. eCollection 2020.

Human Adaptations to Multiday Saturation on NASA NEEMO

Affiliations

Human Adaptations to Multiday Saturation on NASA NEEMO

Andrew P Koutnik et al. Front Physiol. .

Abstract

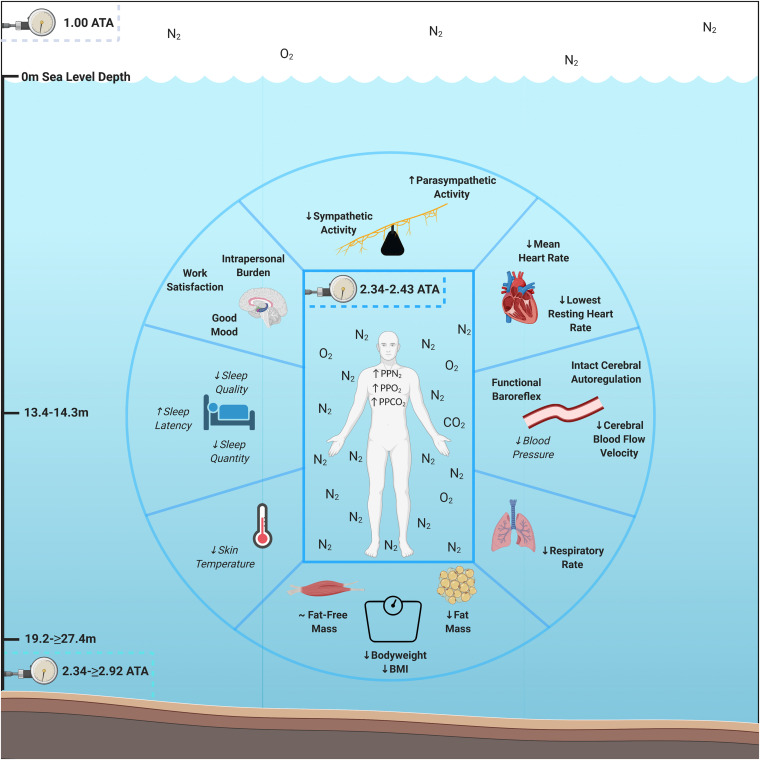
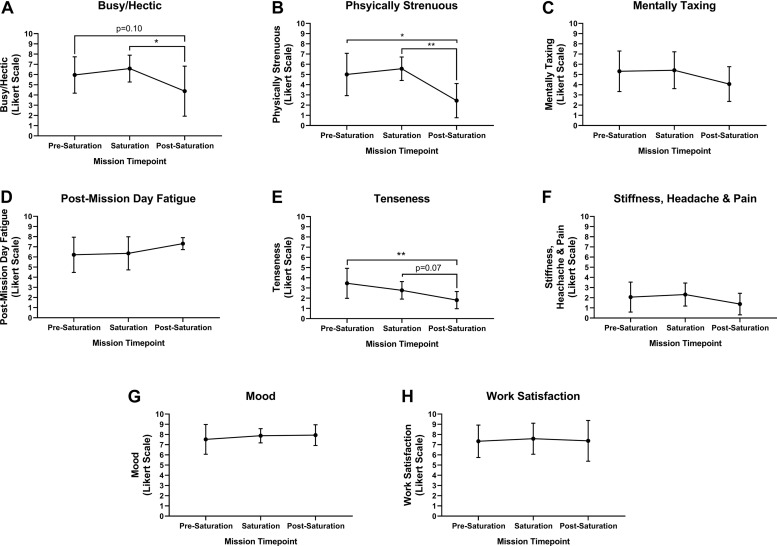
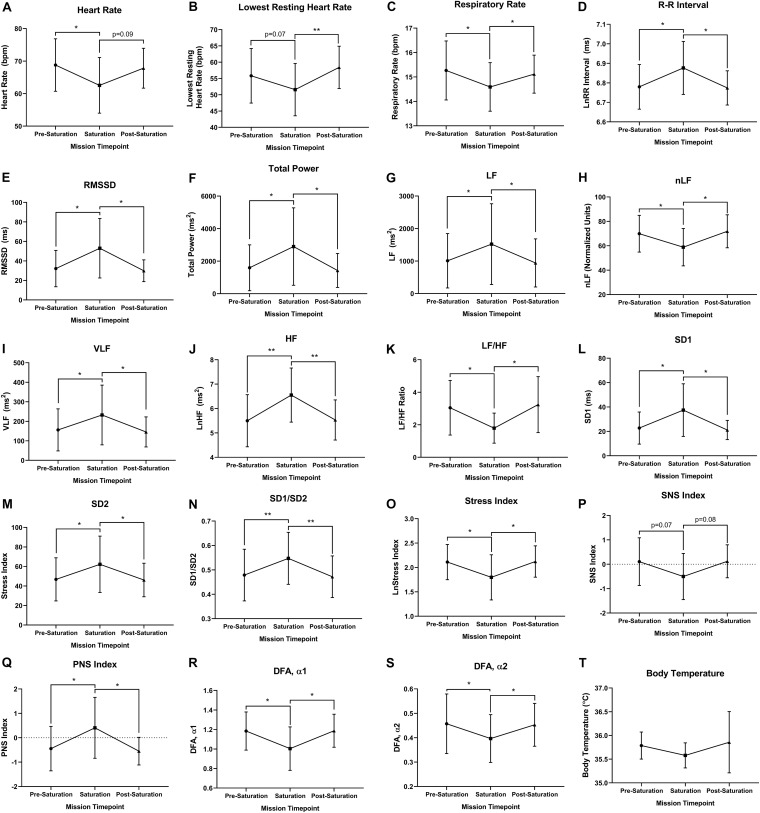
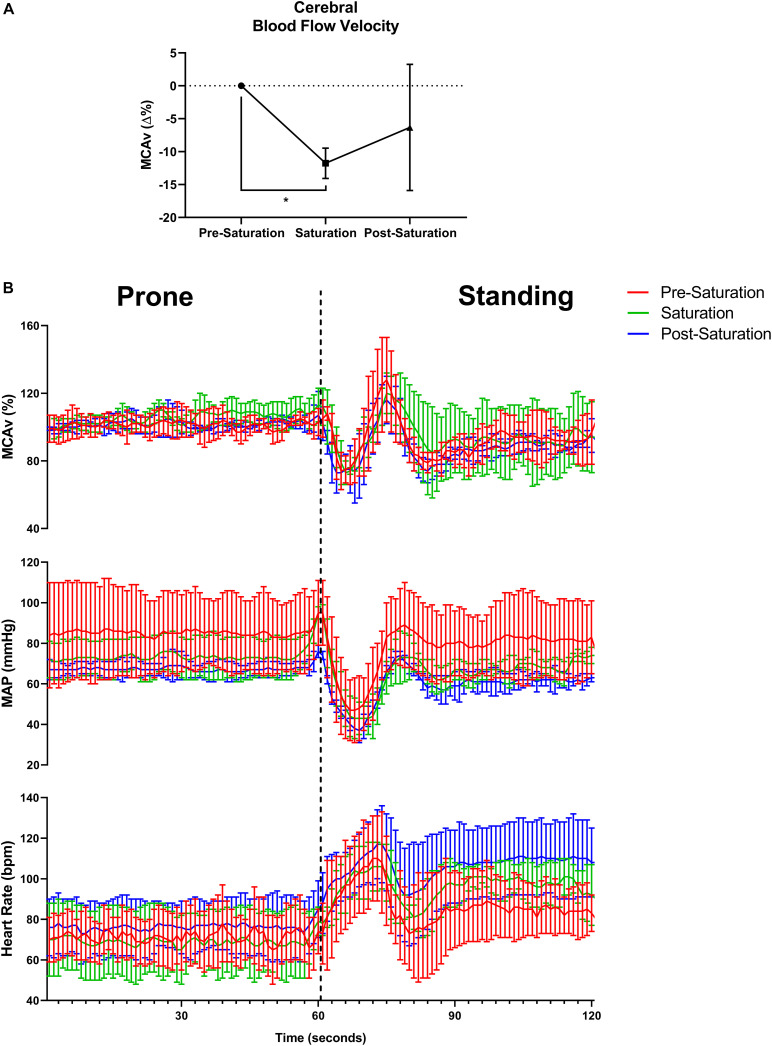
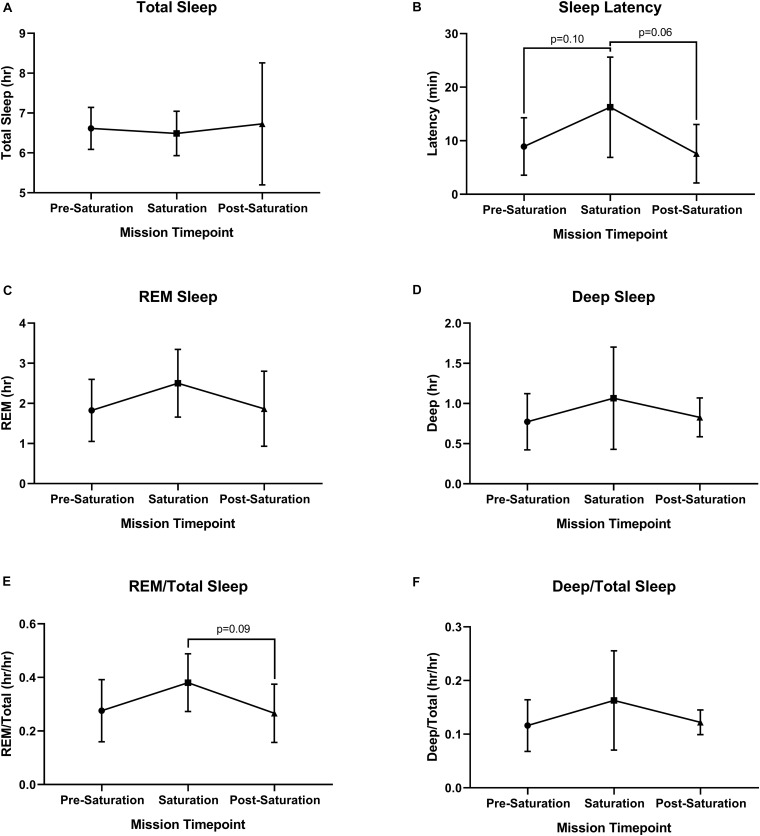
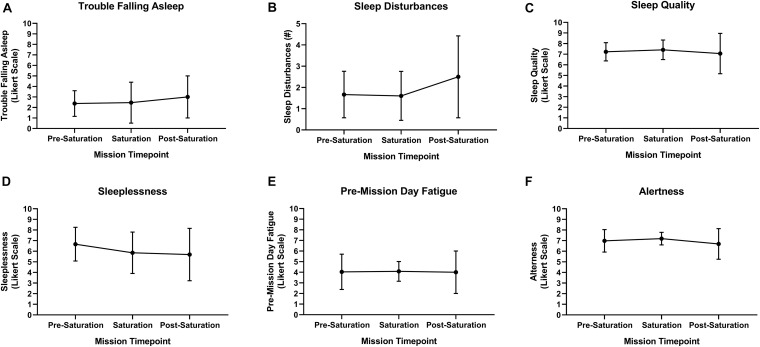
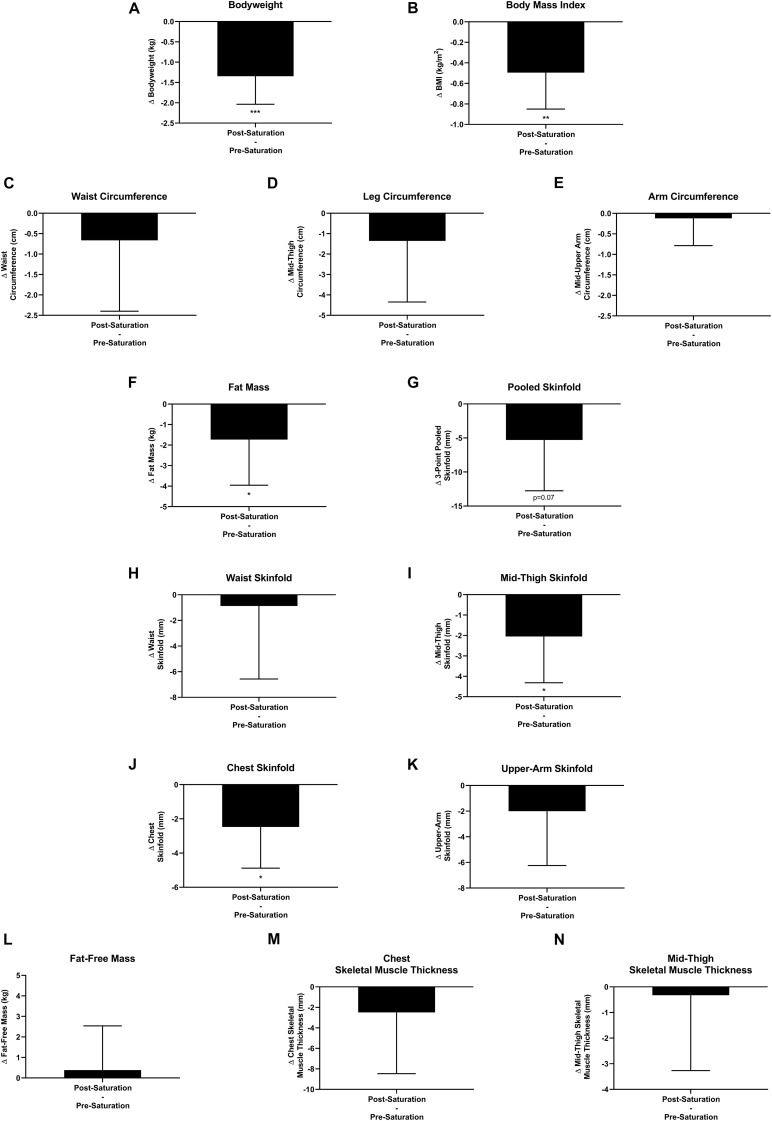
Human adaptation to extreme environments has been explored for over a century to understand human psychology, integrated physiology, comparative pathologies, and exploratory potential. It has been demonstrated that these environments can provide multiple external stimuli and stressors, which are sufficient to disrupt internal homeostasis and induce adaptation processes. Multiday hyperbaric and/or saturated (HBS) environments represent the most understudied of environmental extremes due to inherent experimental, analytical, technical, temporal, and safety limitations. National Aeronautic Space Agency (NASA) Extreme Environment Mission Operation (NEEMO) is a space-flight analog mission conducted within Florida International University's Aquarius Undersea Research Laboratory (AURL), the only existing operational and habitable undersea saturated environment. To investigate human objective and subjective adaptations to multiday HBS, we evaluated aquanauts living at saturation for 9-10 days via NASA NEEMO 22 and 23, across psychologic, cardiac, respiratory, autonomic, thermic, hemodynamic, sleep, and body composition parameters. We found that aquanauts exposed to saturation over 9-10 days experienced intrapersonal physical and mental burden, sustained good mood and work satisfaction, decreased heart and respiratory rates, increased parasympathetic and reduced sympathetic modulation, lower cerebral blood flow velocity, intact cerebral autoregulation and maintenance of baroreflex functionality, as well as losses in systemic bodyweight and adipose tissue. Together, these findings illustrate novel insights into human adaptation across multiple body systems in response to multiday hyperbaric saturation.

Keywords: NASA; adaptation; extreme environment; hyperbaric (underwater); saturation.


Conflict of interest statement

The authors declare that this study received funding from Ketone Technologies LLC. Ketone Technologies LLC is an entity which supports research on extreme environments for which CA and DD serve as CEO and CSO, respectively. CA and DD received no personal compensation for these studies and were involved in project development, logistical implementation, and final manuscript development. These interests have been reviewed and managed by NASA in accordance with its Institutional and Individual Conflict of Interest policies. The remaining authors declare that the research was conducted in the absence of any commercial or financial relationships that could be construed as a potential conflict of interest.

Figures

FIGURE 1
FIGURE 1
Psychological and physiological adaptations to multiday saturation. Aquanauts exposed to hyperbaric saturation from 2.34 to ≥2.92 atmospheres absolute (ATA) over 9–10 days experienced intrapersonal physical and mental burden, sustained good mood and work satisfaction, decreased heart and respiratory rates, increased parasympathetic and reduced sympathetic modulation, lower cerebral blood flow velocity, intact cerebral autoregulation and maintenance of baroreflex functionality, and losses in systemic bodyweight and adipose tissue. Reductions in skin temperature (5/6 aquanauts) and blood pressure (3/3 aquanauts), as well as elevations in sleep quality (4/6 aquanauts) were observed. Abbreviations: ATA, atmospheres absolute; PP, partial pressure; O2, oxygen; N2, nitrogen, CO2, carbon dioxide; BMI, Body Mass Index. Italicized and un-bolded text indicates non-significance changes.
FIGURE 2
FIGURE 2
Intrapersonal burden, mood and work satisfaction. Subjective assessment of (A) Busy/Hectic, (B) Physical Strenuous, (C) Mentally Taxing, (D) Post-Mission Day Fatigue, (E) Tenseness, (F) Stiffness, Headaches and Pain were assessed using Likert Scaling to determine intrapersonal physical and mental burden. Subjective assessment of (G) Mood and (H) Work Satisfaction were quantified using Likert Scaling. N = 8 (male, n = 6; female, n = 2). Data: Mean ± SD. *p < 0.05, **p < 0.01. Raw p-values are reported for non-significant changes where p ≤ 0.10.
FIGURE 3
FIGURE 3
Cardiorespiratory, autonomic, and thermal regulation. (A) Mean and (B) lowest heart rate were quantified via electrocardiography at rest. (C) Respiratory rate was algorithmically determined via beat-by-beat R–R intervals at rest. (D) Autonomic time domain mean R–R intervals and (E) mean Root Mean Square of Successive Differences (RMSSD) were derived from electrocardiography R to R time intervals at rest. R–R intervals were not normally distributed and logarithmically transformed lnRR. (F) Autonomic frequency domain mean Total power, (G) very low frequency (VLF; <0.04 Hz), (H) low frequency (LF; 0.04–0.15 Hz), (I) normalized low frequency [nLF; nLF = (LF/(Total Power-VLF)], (J) high frequency (HF; 0.15–0.4 Hz), and (K) ratio of low frequency to high frequency (LF/HF) were all quantified from resting electrocardiography R to R time intervals at rest. (L) Poincaré perpendicular (SD1), (M) parallel (SD2) standard deviation, and (N) SD1/SD2 were determined via non-linear assessment of heart rate variability by quantitative two-dimensional vector analysis of a Poincaré plot at rest. (O) Short- (DFAα1) and (P) long-term detrended fluctuation analysis (DFAα2) used to analyze non-stationary systems at rest. (Q) Stress, (R) sympathetic nervous system (SNS), and (S) parasympathetic nervous system (PNS) were analyzed as composite metrics of each respective arm of autonomic regulation at rest. (T) Body temperature was gathered via skin thermistor during rest. (A,D–S) N = 7 (male, n = 5; female, n = 2). (B,C,T) N = 6 (male, n = 6) Data: Mean ± SD. RMSSD, Root Mean Square of Successive Differences; VLF, very low frequency; LF, low frequency; nLF, normalized low frequency; HF, high frequency; SD1, Poincaré Perpendicular Standard Deviation; SD2, Poincaré Parallel Standard Deviation; DFAα1, short-term detrended fluctuation analysis; DFAα2, long-term detrended fluctuation analysis; SNS, sympathetic nervous system; PNS, parasympathetic nervous system. *p < 0.05, **p < 0.01. Raw p-values are reported for non-significant changes where p ≤ 0.10.
FIGURE 4
FIGURE 4
Baseline cerebral blood flow velocity, cerebral autoregulatory and baroreflex responses. (A) Percent change in baseline cerebral blood flow velocity from pre-saturation measured at the middle cerebral artery (MCAv%) across timepoints. N = 4 (male, n = 4). (B) One-second averages of beat-by-beat MCAv, mean arterial pressure (MAP), and estimated heart rate derived from systolic blood pressure peaks during waking prone (lying) position into standing position capturing the cerebral autoregulatory and baroreflex responses. N = 3 (male, n = 3). Data: Mean ± SD. MCAv%, middle cerebral artery velocity percent change; MAP, mean arterial pressure. *p < 0.05.
FIGURE 5
FIGURE 5
Objective sleep quantity and quality. (A) Total, (B) Latency, (C) Rapid Eye Movement (REM), (D) Deep, (E) ratio of REM to Total Sleep (REM/Total), and (F) ratio of Deep to Total Sleep (Deep/Total) were assessed during rest across timepoints. N = 6 (male, n = 6) Data: Mean ± SD. REM, rapid eye movement. Raw p-values are reported for non-significant changes where p ≤ 0.10.
FIGURE 6
FIGURE 6
Subject sleep quality. (A) Trouble falling asleep, (B) sleep disturbances, (C) sleep quality, (D) sleeplessness, (E) pre-mission day fatigue, and (F) alertness were subjectively assessed upon waking via sleep diary. N = 8 (male, n = 6; female, n = 2). Data: Mean ± SD.
FIGURE 7
FIGURE 7
Body composition. Changes (Δ) in (A) body weight, (B) body mass index (BMI), and (C–E) multipoint circumference measurements, (F) fat mass, (G–K) multipoint skinfold, (L) fat-free mass, and (M,N) muscle thickness measurements were assessed pre-saturation and post-saturation. Data: Mean ± SD. (A–L) N = 9 (male, n = 7; female, n = 2). (M,N) N = 6 (male, n = 6). BMI, Body Mass Index. p < 0.05, ∗∗p < 0.01, ∗∗∗p < 0.001. Raw p-values are reported for non-significant changes where p ≤ 0.10.

References

    1. Aaslid R., Markwalder T. M., Nornes H. (1982). Noninvasive transcranial Doppler ultrasound recording of flow velocity in basal cerebral arteries. J. Neurosurg. 57 769–774. 10.3171/jns.1982.57.6.0769 - DOI - PubMed
    1. Adamiec L. (1977). Effect of hyperbaric oxygen therapy on some basic vital functions. Acta Physiol. Pol. 28 215–224. - PubMed
    1. Ainslie P. N., Ogoh S., Burgess K., Celi L., McGrattan K., Peebles K., et al. (2008). Differential effects of acute hypoxia and high altitude on cerebral blood flow velocity and dynamic cerebral autoregulation: alterations with hyperoxia. J. Appl. Physiol. 104 490–498. 10.1152/japplphysiol.00778.2007 - DOI - PubMed
    1. Anderson D. G., Herrmann H. G. (1971). Technical Report - Seafloor Foundations: Analysis of Case Histories. Port Hueneme, CA: Naval Civil Engineering Laboratory.
    1. Ari C. S., D’Agostino D. P., Bharwani S., Rehsi A., Moss S., Schmer-Galunder S., et al. (2020c). Changes in Motor Function in Response to Living in an Extreme Underwater Saturation Environment under High Stress and Increased Workload. FASEB J. 34:9603 10.1096/fasebj.2020.34.s1.09603 - DOI

LinkOut - more resources