. 2021 Jan 12:11:619404.
doi: 10.3389/fpls.2020.619404. eCollection 2020.

Barley Anther and Meiocyte Transcriptome Dynamics in Meiotic Prophase I

Affiliations

Barley Anther and Meiocyte Transcriptome Dynamics in Meiotic Prophase I

Abdellah Barakate et al. Front Plant Sci. .

Abstract

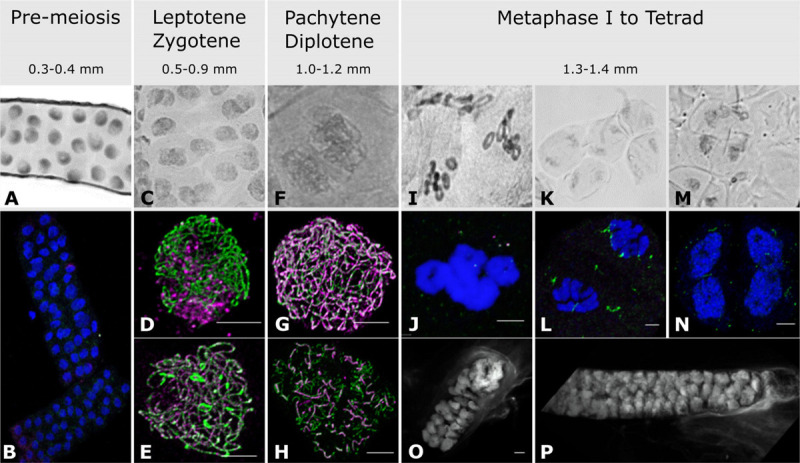
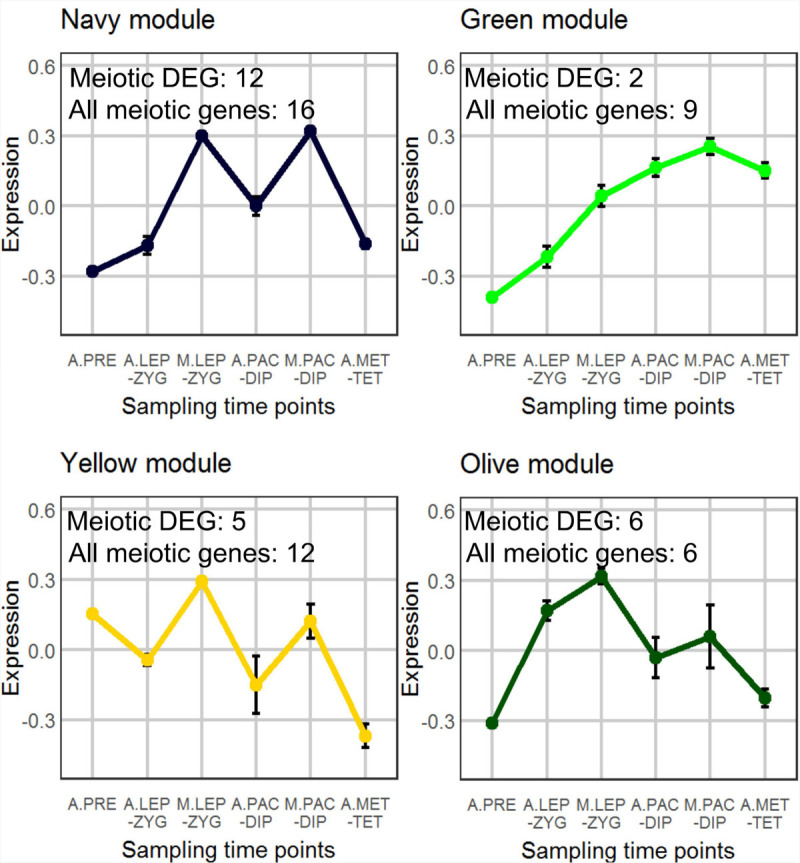
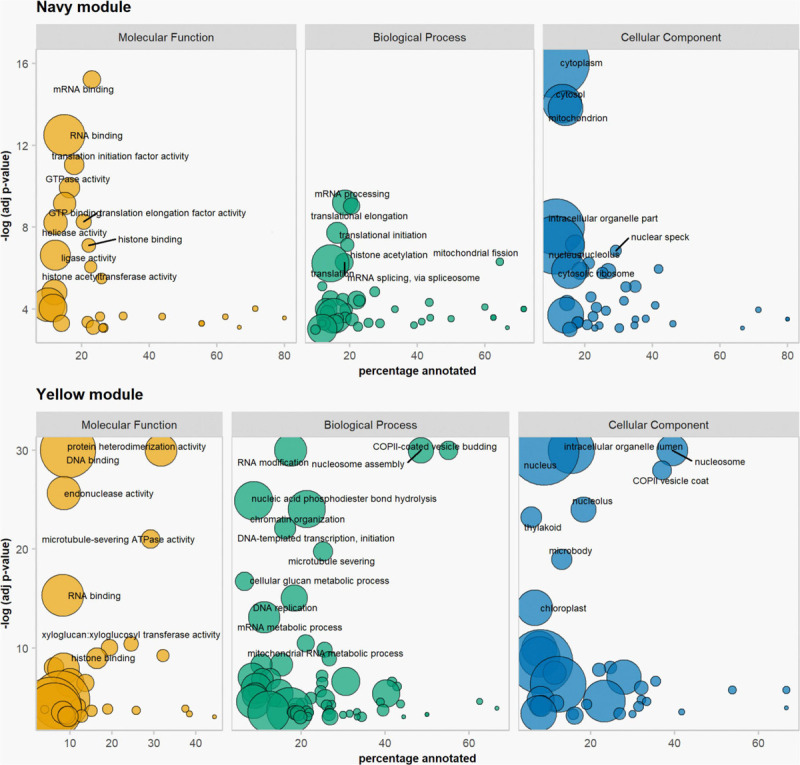
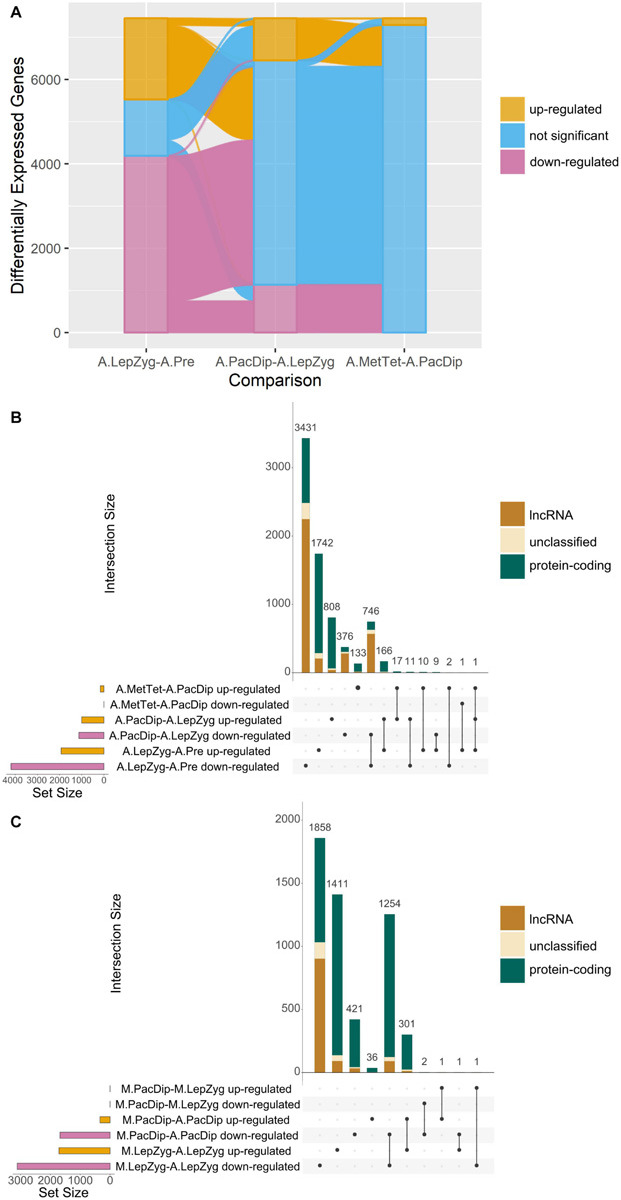
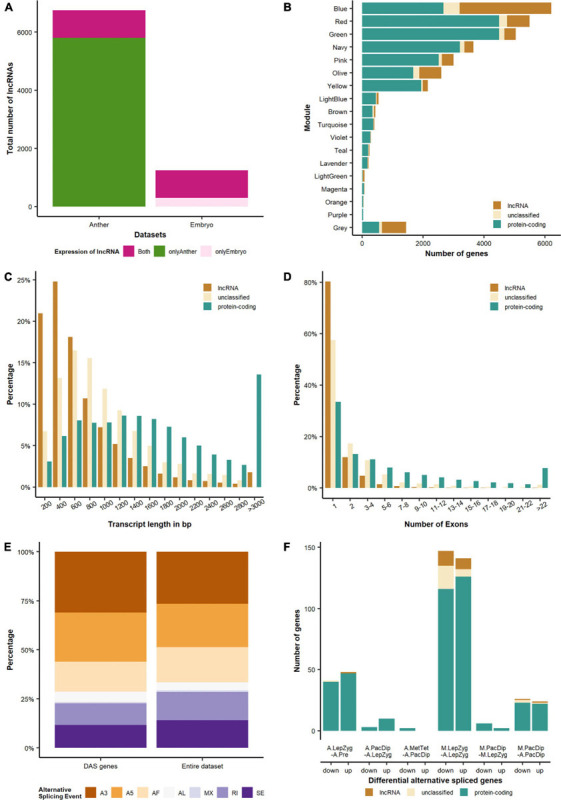
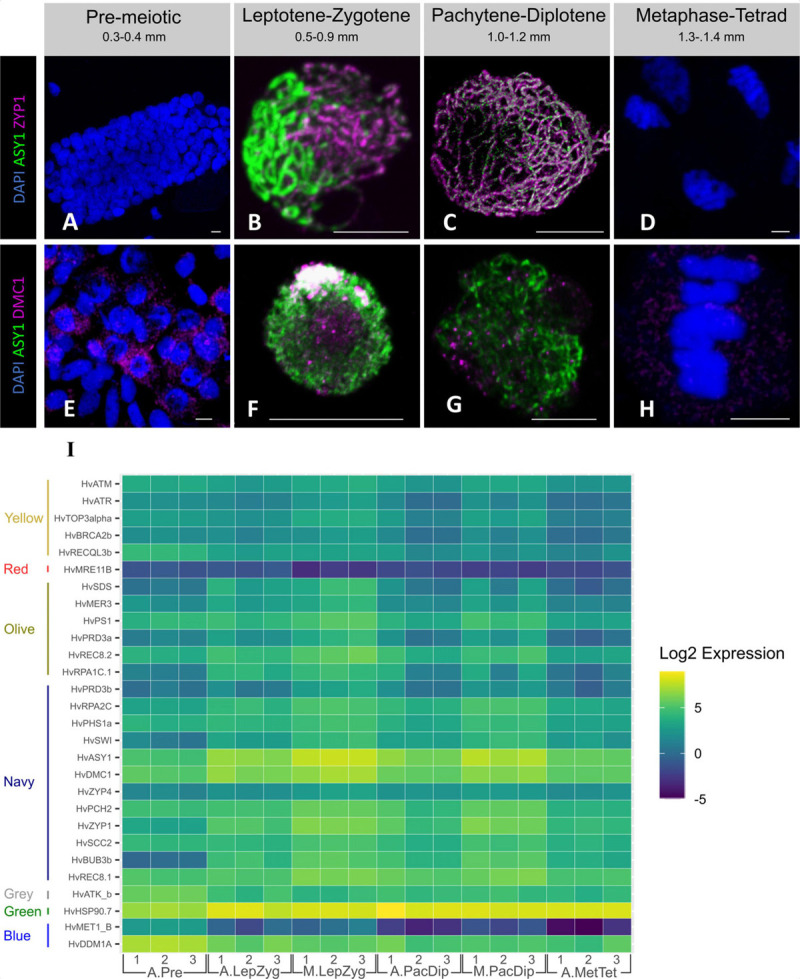
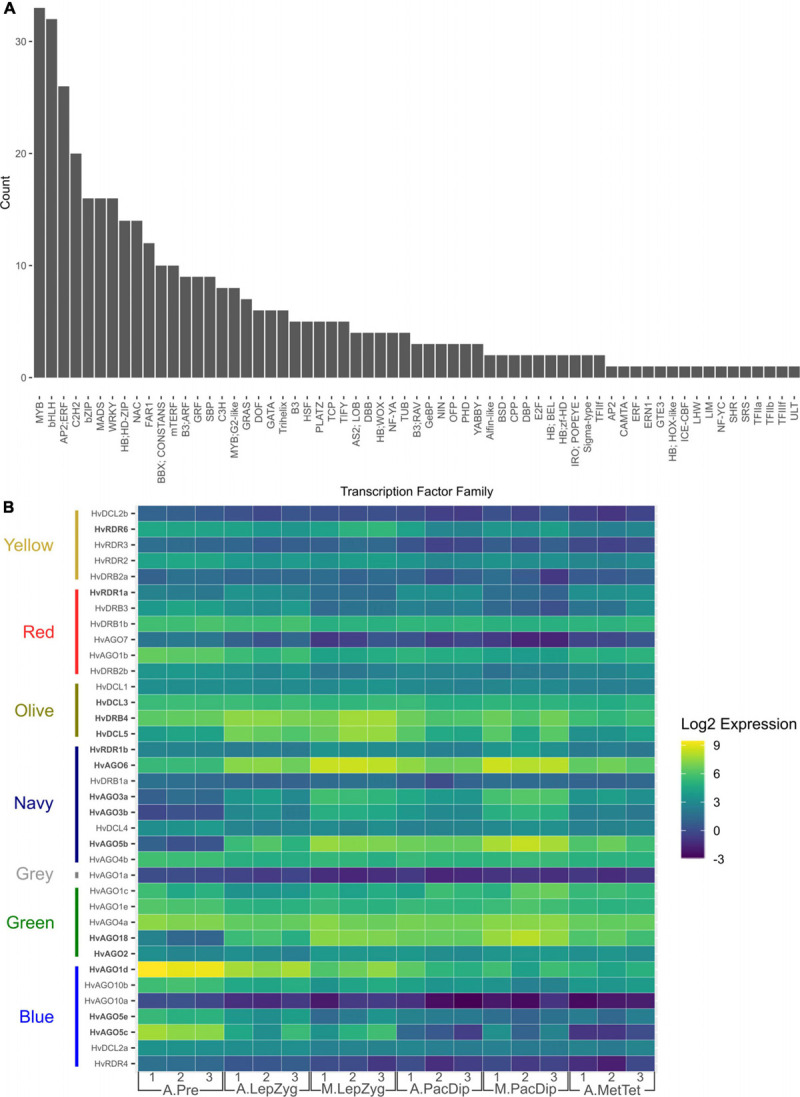
In flowering plants, successful germinal cell development and meiotic recombination depend upon a combination of environmental and genetic factors. To gain insights into this specialized reproductive development program we used short- and long-read RNA-sequencing (RNA-seq) to study the temporal dynamics of transcript abundance in immuno-cytologically staged barley (Hordeum vulgare) anthers and meiocytes. We show that the most significant transcriptional changes in anthers occur at the transition from pre-meiosis to leptotene-zygotene, which is followed by increasingly stable transcript abundance throughout prophase I into metaphase I-tetrad. Our analysis reveals that the pre-meiotic anthers are enriched in long non-coding RNAs (lncRNAs) and that entry to meiosis is characterized by their robust and significant down regulation. Intriguingly, only 24% of a collection of putative meiotic gene orthologs showed differential transcript abundance in at least one stage or tissue comparison. Argonautes, E3 ubiquitin ligases, and lys48 specific de-ubiquitinating enzymes were enriched in prophase I meiocyte samples. These developmental, time-resolved transcriptomes demonstrate remarkable stability in transcript abundance in meiocytes throughout prophase I after the initial and substantial reprogramming at meiosis entry and the complexity of the regulatory networks involved in early meiotic processes.

Keywords: anther; argonaute; barley; lncRNAs; meiocyte; meiosis; transcriptome; ubiquitin.


Conflict of interest statement

The authors declare that the research was conducted in the absence of any commercial or financial relationships that could be construed as a potential conflict of interest.

Figures

FIGURE 1
FIGURE 1
Anther and meiocyte collection and staging. Anthers were collected according to their size and staged with both acetocarmine (A,C,F,I,K,M) and immuno-cytology (B,D,E,G,H,J,L,N). (A,B) Pre-meiotic stage; (C) leptotene/zygotene stage; (D) leptotene stage; (E) zygotene stage; (F) pachytene stage; (G) pachytene stage; (H) diplotene stage; (I,J) metaphase I; (K,L) anaphase I; (M,N) tetrads; (O,P) isolated fresh meiocyte clusters at leptotene/zygotene and pachytene/diplotene, respectively. Acetocarmine (Gray), DAPI (Blue and White for images O,P), ASY1 (Green), ZYP1 (Magenta). Scale bar 5 μm. Note images (O,P) have associated videos.
FIGURE 2
FIGURE 2
WGCNA analysis of co-expressed genes. A total of 17 modules were found and the selected four show an interesting pattern for meiocyte enriched genes. The samples (3 replicates each) are A.PRE, anther pre-meiosis; A.LEP-ZYG, anther leptotene–zygotene; M.LEP-ZYG, meiocyte leptotene–zygotene; A.PAC-DIP, anther pachytene–diplotene; M.PAC-DIP, meiocyte pachytene–diplotene; A.MET-TET, anther metaphase I–tetrad. The prefixes A. and M. in the sample names depict anther and meiocyte samples, respectively.
FIGURE 3
FIGURE 3
Gene ontology enrichment analysis. Results from the navy and the yellow modules of the WGCNA. Size of bubbles correspond to total number of proteins associated with the GO term.
FIGURE 4
FIGURE 4
Comparisons of differential gene expression. (A) Alluvial plot showing up- or down-regulation of genes significantly differentially expressed in all anther (A) meiotic stage comparisons. The comparisons are: A.LepZyg-A.Pre, leptotene–zygotene versus pre-meiosis; A.PacDip-A.LepZyg, pachytene–diplotene versus leptotene–zygotene; and A.MetTet-A.PacDip, metaphase I–tetrad versus pachytene–diplotene. The bar at each stage represents the total complement of genes which are differentially expressed in any anther comparison, the bar is colored by the proportion of genes in each successive meiotic stage comparison on the x axis which is up-regulated (yellow), down-regulated (pink), or not significant (blue). The lines connecting the bars between x axis comparisons represent movement of genes from one expression category to another between successive meiotic stage comparisons. The vast majority of all DEGs (pink and yellow) at any stage are present in the comparison of leptotene–zygotene anthers to pre-meiotic anthers. A large proportion of DEGs in the first comparison do not show a significant change in expression between pachytene–diplotene and leptotene–zygotene, as represented by the pink and yellow lines connecting to the blue shaded area in the second x-axis comparison. (B) UpSet plot of the same anther meiotic stage comparisons and (C) UpSet plot of meiocyte (M) stage and meiocyte-anther tissue comparisons. UpSet plots are similar in principal to the more commonly used Venn and Euler diagrams in that they represent the intersection of distinct groups (sets) but are better at representing large numbers of groups (Lex et al., 2014). The total number of genes in each group (the set size) is represented by a histogram on the left-hand side of the x-axis. The black dots underneath the x-axis indicate which groups are represented in the histogram above showing the number of genes represented by this group. Where only one dot is present the histogram above represents the number of genes unique to this group. Where two or more dots are connected by a line the histogram above represents the number of genes which occur in the connected groups. The comparisons are: M.PacDip-M.LepZyg, meiocytes at pachytene–diplotene versus meiocytes at leptotene–zygotene; M.LepZyg-A.LepZyg, meiocytes at leptotene–zygotene versus anthers at the same stage; M.PacDip-A.PacDip, meiocytes at pachytene–diplotene versus anthers at the same stage. The prefixes A. and M. in the sample names depict anther and meiocyte samples, respectively.
FIGURE 5
FIGURE 5
Differential expression and alternative splicing of different gene categories. (A) Compared with germinating embryos, anthers are enriched in lncRNAs. (B) Distribution of coding, non-coding and undefined genes in different modules. The modules Violet, Turquoise, Navy, Green, Yellow and Olive are enriched in meiocytes. (C) Length and (D) exon number distributions of different transcript categories. (E) Distribution of alternative splicing events for the entire dataset and the DAS (differential alternative spliced) genes. A3, alternative 3′ splice-site; A5, alternative 5′ splice-site; AF, alternative first exon; AL, alternative last exon; MX, mutually exclusive exons; RI, retained intron; SE, skipping exon. (F) Differential alternative spliced genes. The comparisons are: A.LepZyg-A.Pre, anther leptotene–zygotene versus anther pre-meiosis; A.PacDip-A.LepZyg, anther pachytene–diplotene versus anther leptotene–zygotene; A.MetTet-A.PacDip, anther metaphase I–tetrad versus anther pachytene–diplotene; M.LepZyg-A.LepZyg, meiocyte leptotene–zygotene versus anther leptotene–zygotene; M.LepZyg-M.LepZyg, meiocyte leptotene–zygotene versus meiocyte leptotene–zygotene; M.PacDip-A.PacDip, meiocyte pachytene–diplotene versus anther pachytene–diplotene. The prefixes A. and M. in the sample names depict anther and meiocyte samples, respectively.
FIGURE 6
FIGURE 6
Expression of selected meiotic genes. Immuno-staining of meiotic nuclei at four developmental stages for HvZYP1 (magenta, A–D), and HvDMC1 (red, E–H) proteins. All samples were stained with anti-ASY1 antibody (green) and counterstained with DAPI (blue). (A,E) Pre-meiosis, (B,F), leptotene—zygotene, (C,G), pachytene—diplotene, (D,H), anaphase I—metaphase I. Scale bar 10 μm. (I) Heatmap expression profile of meiotic genes with a statistically significant log fold change in at least one tissue or stage comparison. The genes are ordered and grouped by WGCNA module on the vertical axis. Genes were extracted from the total dataset, transcript counts log transformed, and plotted using ggplot2 (Wickham, 2016) in R (script available at https://github.com/BioJNO/BAnTr). The samples (3 replicates each) are A.Pre, anther pre-meiosis; A.LepZyg, anther leptotene–zygotene; A.PacDip, anther pachytene–diplotene; A.MetTet, anther metaphase I–tetrad; M.LepZyg, meiocyte leptotene–zygotene; M.PacDip, meiocyte pachytene–diplotene. The prefixes A. and M. in the sample names depict anther and meiocyte samples, respectively.
FIGURE 7
FIGURE 7
Expression of transcription factor (TF) families in anthers and meiocytes. (A) Total number of TFs per family that are expressed in anthers and meiocytes. (B) Number of differentially expressed TFs determined by comparing their transcript levels in anthers at different stages. The comparisons are: A.LepZyg-A.Pre, anther leptotene–zygotene versus anther pre-meiosis; A.PacDip-A.LepZyg, anther pachytene–diplotene versus anther leptotene–zygotene; A.MetTet-A.PacDip, anther metaphase I–tetrad versus anther pachytene–diplotene. The prefixes A. and M. in the sample names depict anther and meiocyte samples, respectively.

References

    1. Alamancos G. P., Pagès A., Trincado J. L., Bellora N., Eyras E. (2015). Leveraging transcript quantification for fast computation of alternative splicing profiles. RNA 21 1521–1531. 10.1261/rna.051557.115 - DOI - PMC - PubMed
    1. Alexa A., Rahnenführer J., Lengauer T. (2006). Improved scoring of functional groups from gene expression data by decorrelating GO graph structure. Bioinformatics 22 1600–1607. 10.1093/bioinformatics/btl140 - DOI - PubMed
    1. Altschul S. F., Gish W., Miller W., Myers E. W., Lipman D. J. (1990). Basic local alignment search tool. J. Mol. Biol. 215 403–410. 10.1016/S0022-2836(05)80360-2 - DOI - PubMed
    1. Ariel F., Jegu T., Latrasse D., Romero-Barrios N., Christ A., Benhamed M., et al. (2014). Noncoding transcription by alternative RNA polymerases dynamically regulates an auxin-driven chromatin loop. Mol. Cell. 55 383–396. 10.1016/j.molcel.2014.06.011 - DOI - PubMed
    1. Ariel F., Romero-Barrios N., Jégu T., Benhamed M., Crespi M. (2015). Battles and hijacks: noncoding transcription in plants. Trends Plant Sci. 20 362–371. 10.1016/j.tplants.2015.03.003 - DOI - PubMed

LinkOut - more resources