. 2021 Feb 26;49(4):2266-2288.
doi: 10.1093/nar/gkab020.

Dynamics of the HD regulatory subdomain of PARP-1; substrate access and allostery in PARP activation and inhibition

Affiliations

Dynamics of the HD regulatory subdomain of PARP-1; substrate access and allostery in PARP activation and inhibition

Tom E H Ogden et al. Nucleic Acids Res. .

Abstract

PARP-1 is a key early responder to DNA damage in eukaryotic cells. An allosteric mechanism links initial sensing of DNA single-strand breaks by PARP-1's F1 and F2 domains via a process of further domain assembly to activation of the catalytic domain (CAT); synthesis and attachment of poly(ADP-ribose) (PAR) chains to protein sidechains then signals for assembly of DNA repair components. A key component in transmission of the allosteric signal is the HD subdomain of CAT, which alone bridges between the assembled DNA-binding domains and the active site in the ART subdomain of CAT. Here we present a study of isolated CAT domain from human PARP-1, using NMR-based dynamics experiments to analyse WT apo-protein as well as a set of inhibitor complexes (with veliparib, olaparib, talazoparib and EB-47) and point mutants (L713F, L765A and L765F), together with new crystal structures of the free CAT domain and inhibitor complexes. Variations in both dynamics and structures amongst these species point to a model for full-length PARP-1 activation where first DNA binding and then substrate interaction successively destabilise the folded structure of the HD subdomain to the point where its steric blockade of the active site is released and PAR synthesis can proceed.


Figures

Figure 1.
Figure 1.
(A) PARP-1 domain structure. (B, C) Model of PARP-1 bound to a DNA single-strand break, showing how the HD subdomain acts as a bridge between the DNA-interacting domains (F1, F2, F3 and WGR, shown as semi-transparent spheres) and the ART subdomain (shown as cartoon; the BRCT domain and interdomain linkers are not represented). The model was built by combining co-ordinates from PDB 4DQY (F1, F3 and WGR-CAT bound to a DNA blunt end) and PDB 2N8A (F1 and F2 bound to a 45-nucleotide DNA dumbbell that mimics a single-strand break) as described previously (14). (D) PARP-1 CAT domain showing locations of the HD subdomain mutations studied here (L713 and L765; also shown is the location L768, for mutants of which activity data was measured as a comparator), the parts of the surfaces of the WGR and F3 domains with which the HD subdomain interacts (shown as semi-transparent spheres), and a summary of the previously published HXMS data (16) showing NH exchange rate changes upon DNA binding for the CAT domain in the context of full-length PARP-1; progressively darker shades of red indicate progressively greater increases in NH exchange upon PARP-1 binding to the 45nt DNA dumbbell (see Dawicki-McKenna et al. (16) for a complete description). (E, F) Superpositions of PDB 1A26, PDB 2PAW and PDB 4DQY onto the structure of PDB 7AAA, using the backbone N, Cα, C′ atoms of helices D, E and F; for all four molecules, helices D, E and F are shown as solid, while the remainder of the structure is shown for 7AAA only and is semi-transparent. Changes caused by DNA binding (in 4DQY) include particularly a realignment of helix D and straightening of helix F. The H-bonds linking Tyr710 to Asp766 (at the site of the kink in helix F) and Thr887 to Gln717 are indicated (shown for 7AAA only), as is the position of the 723–725 loop. (G) Covalent structures of the four inhibitors studied here (veliparib, olaparib, talazoparib and EB-47) and PARP-1’s natural substrate, NAD+. (H) Binding affinities, association and dissociation rates for interaction of veliparib, olaparib, talazoparib and EB-47 with full-length PARP-1, measured using surface plasmon resonance. (I) Isothermal calorimetry determination of KD for the binding of PARP-1 CAT domain with EB-47. (J) Catalytic activity of isolated PARP-1 CAT domain and mutants, tested using a colorimetric assay that measures the incorporation of ADP-ribose into PAR using biotinylated NAD+ (22). (K) Thermal melt data for WT PARP-1 CAT domain and the L713F, L765F and L764A mutants, measured using nanoDSF (differential scanning fluorimetry); the corresponding raw data are shown in Supplementary Figure S4.
Figure 2.
Figure 2.
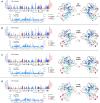
Backbone amide group chemical shift perturbations measured at 25°C and 800 MHz for complexes of PARP-1 CAT domain with (A) veliparib, (B) olaparib, (C) talazoparib, (D) EB-47, and backbone amide group chemical shift differences between WT PARP-1 CAT domain and the mutants (E) L765F, (F) L765A and (G) L713F, in each case shown both as histograms and mapped to the relevant CAT domain complex crystal structure or (for the mutants) the WT protein crystal structure. The largest difference in any of the datasets is 1.247 ppm (for G888 in the talazoparib complex, shown truncated in the figure). The bar to the right of each histogram shows the colour code used to map these CSP values to the structures: values between 0 and 0.249 (0.2 times the largest CSP value, shown with a horizontal line in the histograms) are shown using a colour ramp running from grey to yellow, while values >0.249 are uniformly shown as yellow; this approach was followed to prevent the mapping being excessively dominated by a small number of the largest differences. Small coloured bars beneath the sequence scale and matching colors on the structures are used to indicate the positions of prolines (pale green), overlapped or unassigned signals (pink) and the Ala823–Asn827 loop for which no signals were seen in any spectrum (orange). Secondary structure elements are shown beneath the histograms.
Figure 3.
Figure 3.
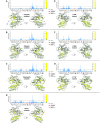
Steady-state {1H} 15N NOE data recorded at 25°C and 800 MHz for (A) PARP-1 CAT domain, its complexes with (B) veliparib, (C) olaparib, (D) talazoparib and (E) EB-47, as well as the point mutants (F) L765F, (G) L765A and (H) L713F. In each case, the data are shown both as histograms and mapped to the relevant CAT domain crystal structure or (for the mutants) the WT protein crystal structure. The bar to the right of each histogram shows the colour code used to map these data to the structures: the colour ramp runs from grey (0.8, the approximate value expected for NH groups that show no internal motions faster than overall tumbling of the protein) to red (0.0), with values above 0.8 uniformly grey and values below 0.0 uniformly red. Small coloured bars beneath the sequence scale and matching colours on the structures are used to indicate the positions of prolines (pale green), overlapped or unassigned signals (pink) and the Ala823-Asn827 loop for which no signals were seen in any spectrum (orange). Further histograms of steady-state {1H}15N NOE, T1 and T1ρ data appear in Supplementary Figures S7–S18.
Figure 4.
Figure 4.
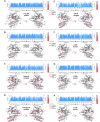
Backbone amide solvent NH exchange data and sequential [NH(i), NH(i+1)] NOESY cross-peak data (denoted dNN) for the HD subdomain, each shown for (A) PARP-1 CAT domain, and its complexes with (B) veliparib, (C) olaparib, (D) talazoparib and (E) EB-47. In each case, the data are shown both as histograms and mapped to the relevant CAT domain complex crystal structure. For the NH exchange data, red bars indicate normalised peak intensities measured in CLEANEX-PM experiments, which detect the fastest exchange rates, while the blue bars represent intensities measured in real-time 2H2O exchange series, which detect slowly exchanging NHs; light blue represents intensity after 3 h, mid-blue after 12 h and dark blue after 39 h, respectively; for details of how these colours were mapped to the structures, see materials and methods section. For the NOESY cross-peak data, runs of continuous (NH, NH) sequential cross peaks indicate stretches of helical conformation (in each case the spectra contain two symmetry-related cross peaks that would ideally have identical intensity; the blue bar represents the lower of these intensities, the grey bar represents the average intensity over both). Small coloured bars beneath the sequence scale and matching colours on the structures are used to indicate the positions of prolines (pale green), overlapped or unassigned signals (pink) and the Ala823–Asn827 loop for which no signals were seen in any spectrum (orange). All data were recorded at 25°C and 800 MHz.
Figure 5.
Figure 5.
Backbone amide solvent NH exchange data and sequential [NH(i), NH(i +1)] NOESY cross-peak data (denoted dNN) for the HD subdomain, each shown for for (A) PARP-1 CAT domain, (B) L765F mutant, (C) L765A mutant and (D) L713F mutant. All other details as for Figure 4.
Figure 6.
Figure 6.
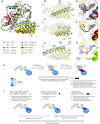
(A-D) Superposition of PARP-1 CAT domain in the apo-protein and in inhibitor complexes with veliparib (PDB 7AAC and 2RD6), olaparib (PDB: 7AAD), talazoparib (PDB: 4PJT and 4UND) and EB-47 (PDB 7AAB and PDBB:6VKQ), in each case superposing using only the ART subdomain (N, Cα, C′ of residues 790–936, 939–1009) of 7AAA; in each case chain A was used for superposition and is shown, except for 4PJT where chain C was used and is shown. The inhibitor structures themselves are omitted from these views. (E) Close up of the same superposition as in A-D), showing the inhibitors bound in the nicotinamide binding pocket; those parts of inhibitors that approach closely to helix F are labelled. The apo-protein is omitted from this view. (F) Close up of the same superposition as in E), showing only the two EB-47 complexes (PDB 7AAB and PDB 6VKQ), demonstrating the different binding poses of the adenosine moiety in the two cases. (G) Hypothetical binding pose of the non-hydrolysable NAD+ analogue benzamide adenine dinucleotide (BAD) in the presence of the HD subdomain of PARP-1. The model was obtained by superposing the ART domains (N, Cα, C′ of residues 790–936, 939–1009) of the BAD complex with PARP-1 ΔHD-CAT (PDB 6BHV) and the EB-47 complex (PDB: 7AAB) with that of the apo-protein (PDB 7AAA), then displaying the structure of BAD (as sticks) with the backbone of the EB-47 complex. Note the prediction that this arrangement would lead to a severe electrostatic clash between the pyrophosphate linker of BAD and the acidic sidechains on helix F. (H, I) Schematic model for contributions of dynamics to allostery in H) PARP-1 activation and I) PARP-1 inhibitor binding. (H) Shows the proposed two-stage nature of activation by successive interaction with DNA damage and substrate, while (I) shows the different contributions to allostery for inhibitors of types I, II and II as defined in Zandrashvili et al. (60).

Similar articles

Cited by

References

    1. Polo S.E., Jackson S.P.. Dynamics of DNA damage response proteins at DNA breaks: a focus on protein modifications. Genes Dev. 2011; 25:409–433. - PMC - PubMed
    1. Caldecott K.W. Single-strand break repair and genetic disease. Nat. Rev. Genet. 2008; 9:619–631. - PubMed
    1. D’Amours D., Desnoyers S., D'Silva I., Poirier G.G.. Poly(ADP-ribosyl)ation reactions in the regulation of nuclear functions. Biochem. J. 1999; 342:249–268. - PMC - PubMed
    1. Krishnakumar R., Kraus W.L.. The PARP side of the nucleus: molecular actions, physiological outcomes, and clinical targets. Mol. Cell. 2010; 39:8–24. - PMC - PubMed
    1. Bryant H.E., Schultz N., Thomas H.D., Parker K.M., Flower D., Lopez E., Kyle S., Meuth M., Curtin N.J., Helleday T.. Specific killing of BRCA2-deficient tumours with inhibitors of poly(ADP-ribose) polymerase. Nature. 2005; 434:913–917. - PubMed

Publication types

MeSH terms