

Identification of TOR-responsive slow-cycling neoblasts in planarians
- PMID: 33511776
- PMCID: PMC7926258
- DOI: 10.15252/embr.202050292
Identification of TOR-responsive slow-cycling neoblasts in planarians
Abstract
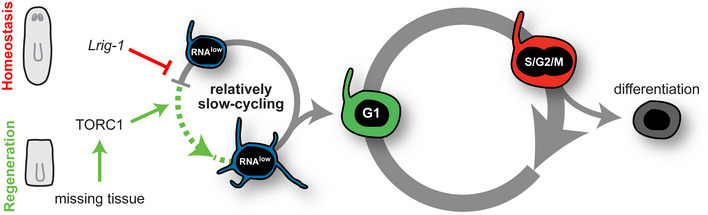
Epimorphic regeneration commonly relies on the activation of reserved stem cells to drive new cell production. The planarian Schmidtea mediterranea is among the best regenerators in nature, thanks to its large population of adult stem cells, called neoblasts. While neoblasts have long been known to drive regeneration, whether a subset of neoblasts is reserved for this purpose is unknown. Here, we revisit the idea of reserved neoblasts by approaching neoblast heterogeneity from a regulatory perspective. By implementing a new fluorescence-activated cell sorting strategy in planarians, we identify a population of neoblasts defined by low transcriptional activity. These RNAlow neoblasts are relatively slow-cycling at homeostasis and undergo a morphological regeneration response characterized by cell growth at 48 h post-amputation. At this time, RNAlow neoblasts proliferate in a TOR-dependent manner. Additionally, knockdown of the tumour suppressor Lrig-1, which is enriched in RNAlow neoblasts, results in RNAlow neoblast growth and hyperproliferation at homeostasis, and ultimately delays regeneration. We propose that slow-cycling RNAlow neoblasts represent a regeneration-reserved neoblast population.
Keywords: TORC1; planarians; quiescence; regeneration; stem cells.
© 2021 The Authors.
Conflict of interest statement
The authors declare that they have no conflict of interest.
Figures
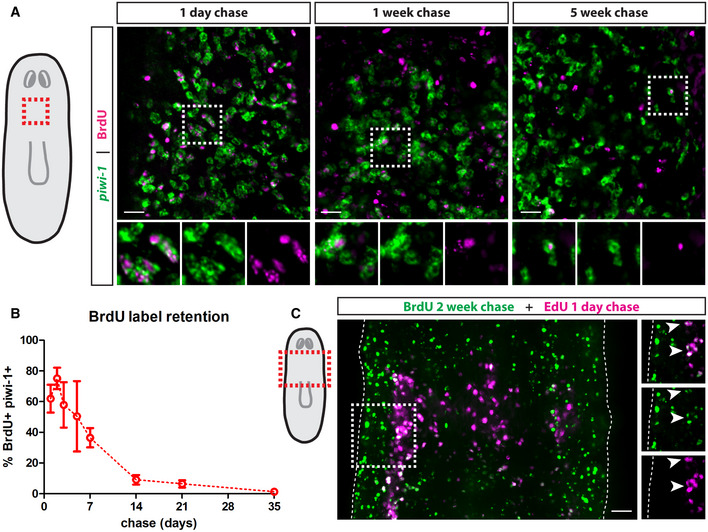
Whole‐mount FISH for piwi‐1 and immunostaining for BrdU at 1‐day, 1‐week and 5‐weeks post‐BrdU administration. White boxes denote the magnified regions shown in the bottom panels. Scale bars, 30 µm.
Quantification of the percentage of BrdU label‐retaining neoblasts. Data are presented as mean ± s.d. (n = 4–6 animals per time point).
Double‐pulse experiment showing colocalization of BrdU after a 2‐week chase period with EdU after a 1‐day chase period. White boxes denote the magnified region shown on the left. Dashed lines mark the edges of the animal and white arrows mark colocalization. Scale bar, 50 µm.
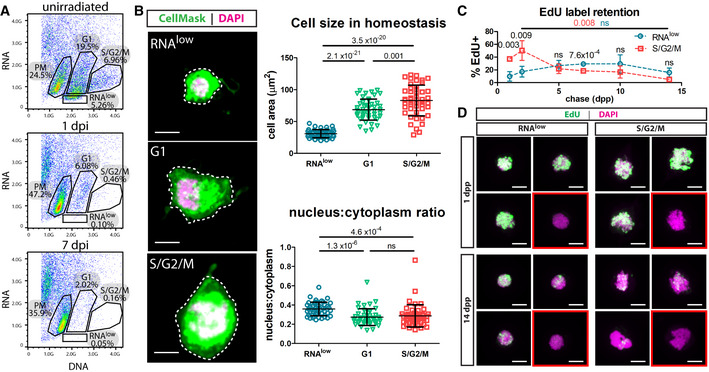
Dissociated cells from unirradiated, 1 dpi or 7 dpi animals (60 Gy of irradiation) were stained with Hoechst (DNA) and Pyronin Y (RNA) and sorted by FACS to reveal an RNAlow population. Percentages indicate the proportion of events within each gate.
Cell size and nucleus:cytoplasm ratio measured by CellMask (cytoplasm) and DAPI (nucleus) staining of FACS sorted cells at homeostasis (n ≥ 47 per sample). Representative images are shown, with dashed lines to indicate the area measured. Scale bars, 5 µm.
EdU pulse‐chase time course of label retention in sorted RNAlow and S/G2/M neoblasts (n ≥ 3 individual experiments per time point). Red and blue P values indicate the statistical significance of EdU dilution from 2 to 14 dpp in S/G2/M or RNAlow neoblasts, respectively. Black P values indicate the statistical significance of EdU retention in RNAlow neoblasts compared to S/G2/M neoblasts.
Maximum projection confocal images showing examples of cells from the beginning and end of the EdU label‐retention time course in (C). Red boxes denote examples of EdU− cells. Scale bars, 5 µm.
- A
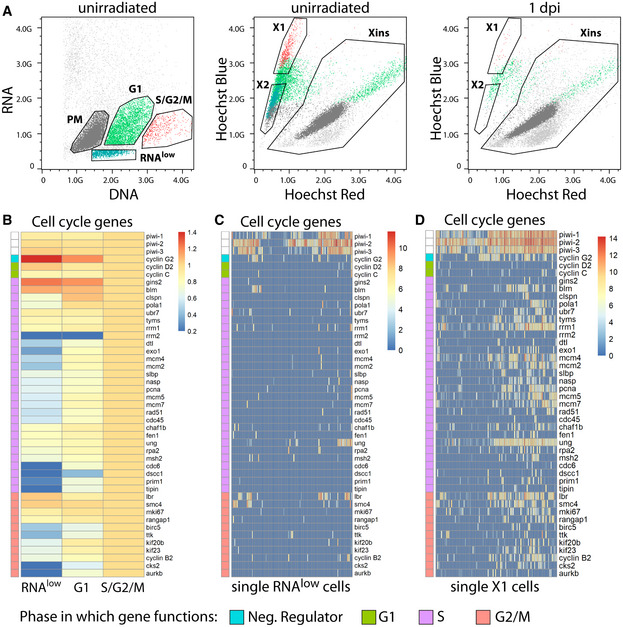
Backgating of the RNAlow, G1, S/G2/M, and PM populations from Hoechst/pyronin Y stained cells (left) onto a classic Hoechst side population plot (middle, unirradiated; right, 1 day post 60 Gy irradiation). Plots are representative of n > 3 independent experiments.
- B
Expression of cell cycle genes in bulk RNAseq data of RNAlow, G1 and S/G2/M cells. Heatmap scale, fold change of log2 normalized expression compared to S/G2/M.
- C, D
Expression of cell cycle genes in scRNAseq of 96 RNAlow neoblasts (C) or 96 previously sequenced X1 neoblasts (D, data ref: Molinaro & Pearson, 2016). Heatmap scale, log2 normalized expression level.
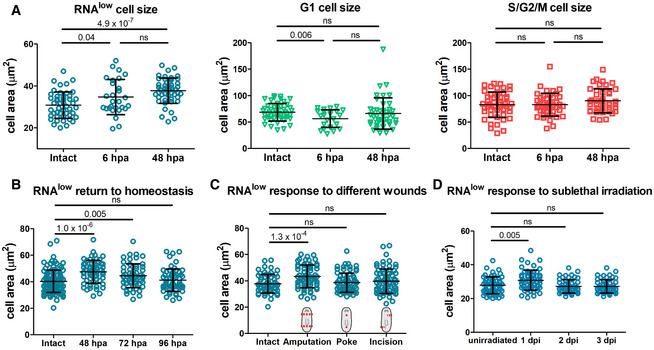
Area measurements of cells from the RNAlow, G1 and S/G2/M gates in intact animals and at 6 and 48 hpa (n ≥ 28 for each sample in the RNAlow plot, n ≥ 24 in the G1 plot, n ≥ 42 in the S/G2/M plot).
RNAlow neoblast size in intact animals and at 48, 72 and 96 hpa (n ≥ 54).
RNAlow neoblast size in intact animals and at 48 h following amputation, poke or incision injuries (n ≥ 61).
RNAlow neoblast size in unirradiated animals and at 1, 2 and 3 dpi (12.5 Gy. of irradiation, n ≥ 52).
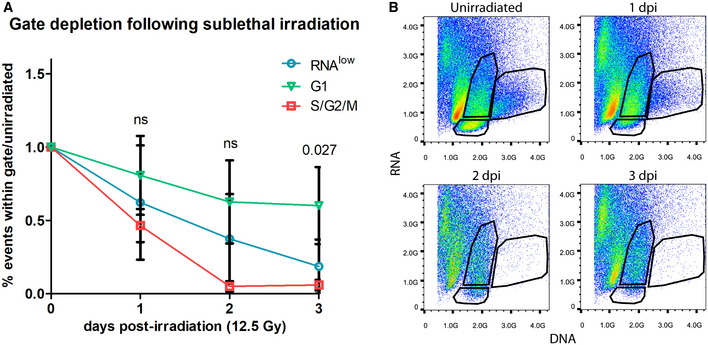
Quantification of the proportion of events within the RNAlow, G1 or S/G2/M FACS gates in unirradiated controls and at 1–3 dpi (12.5 Gy of irradiation, n = 3 biological replicates). Data are normalized to unirradiated controls and presented as mean ± s.d. A one‐way ANOVA was conducted to compare the depletion of each gate at a given time point. Gate depletion was not significant at 1 dpi (F(2,6) = 1.12, P = 0.38) or 2 dpi (F(2,6) = 4.31, P = 0.069). Gate depletion was significant at 3 dpi (F(2,6) = 6.94, P = 0.027). A post‐hoc Turkey HSD test identified a significant difference between the G1 and S/G2/M gates at 3 dpi (P = 0.027).
Representative FACS plots of the time course in (A). Plots are representative of n = 3 independent experiments.
- A
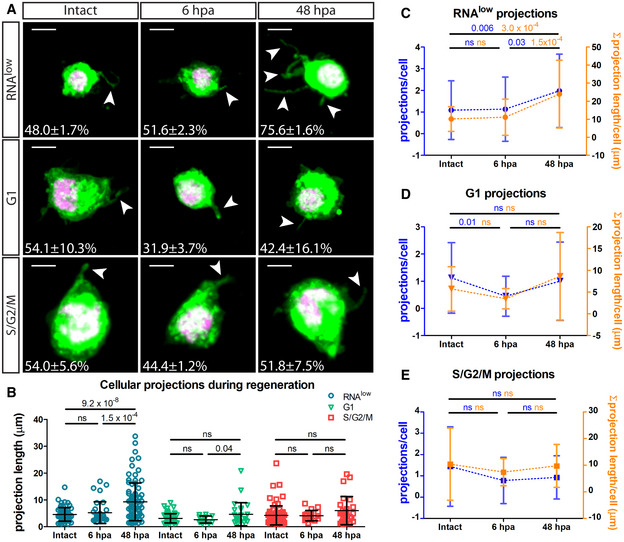
Representative images of RNAlow, G1 and S/G2/M cells stained with CellMask and DAPI in intact animals and at 6 and 48 hpa. All images shown are from samples processed in the same experiment. Intact images are duplicated from Fig 2B. White arrows mark projections. Percentage of cells displaying projections in each condition is noted (n > 100 cells counted). Scale bars, 5 µm.
- B
Average projection length in RNAlow, G1 and S/G2/M cells from intact animals and at 6 and 48 hpa (n ≥ 13).
- C–E
Quantification of the number of projections per cell (blue data) and the sum total projection length per cell (orange data) in RNAlow (C), G1 (D) or S/G2/M (E) cells isolated from intact animals and at 6 and 48 hpa (n ≥ 23 for projections/cell, n ≥ 10 for Σ projection length/cell).
- A, B
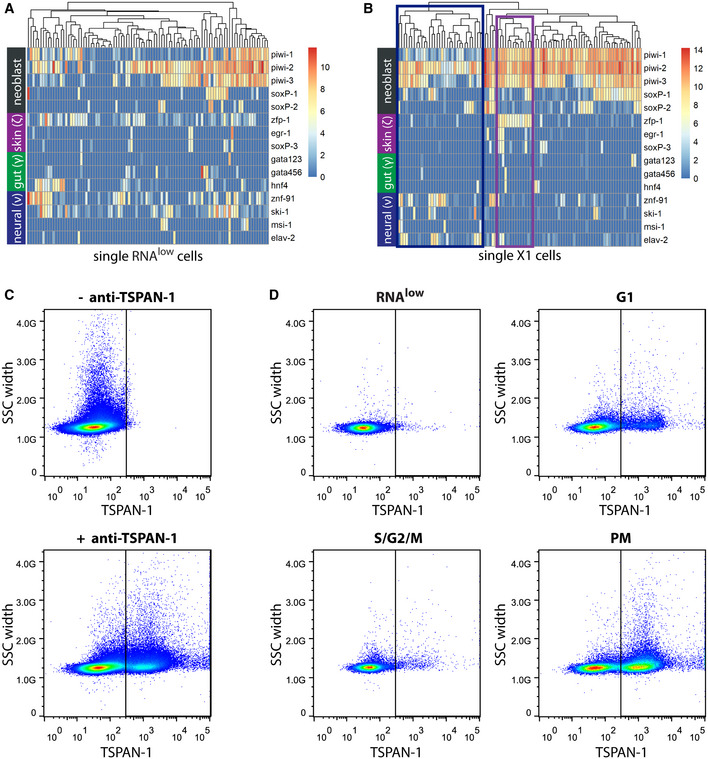
Expression levels of general and lineage‐committed neoblast markers in scRNAseq data of cells from the RNAlow gate (A) or previously sequenced X1 neoblasts (B, data ref: Molinaro & Pearson, 2016).Heatmap scale, log2 normalized expression level. Blue box, putative neural progenitor cluster; purple box, putative epithelial progenitor cluster.
- C
FACS plots showing TSPAN‐1 immunostaining of whole dissociated animals without (top) or with (bottom) anti‐TSPAN‐1 antibody.
- D
FACS plots showing TSPAN‐1 immunostaining of cells from the RNAlow, G1, S/G2/M, or PM gates.
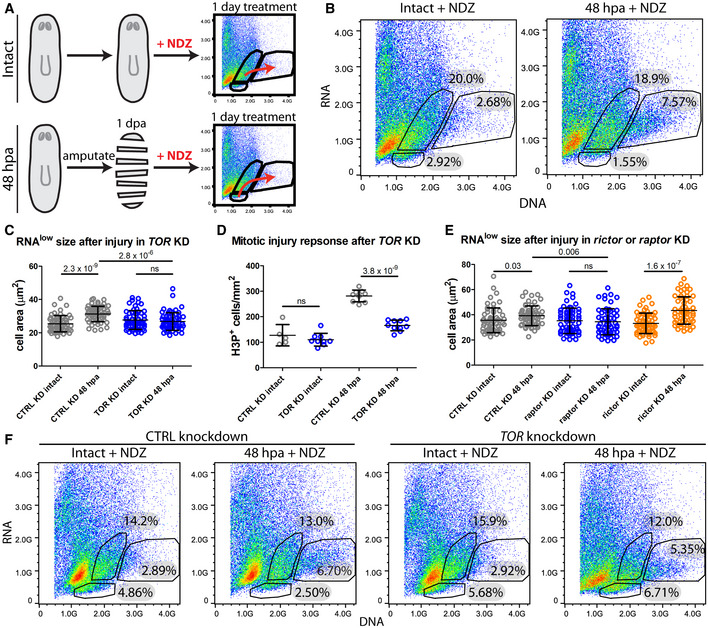
Schematic of the experimental design.
FACS plots of Hoechst and Pyronin Y stained cells isolated from intact and 48 hpa regenerating animals following 1 day of NDZ treatment.
RNAlow neoblast size in intact animals and at 48 hpa in control or TOR KD animals (n ≥ 55).
Quantification of H3P immunostaining in intact animals and at 48 hpa in control or TOR KD animals (n = 5–10).
RNAlow neoblast size in intact animals and at 48 hpa in control, raptor or rictor KD animals (n ≥ 54).
FACS plots of Hoechst and Pyronin Y stained cells isolated from intact and regenerating animals following 1 day of nocodazole treatment in control or TOR KD animals. Percentages indicate the proportion of events within each gate.
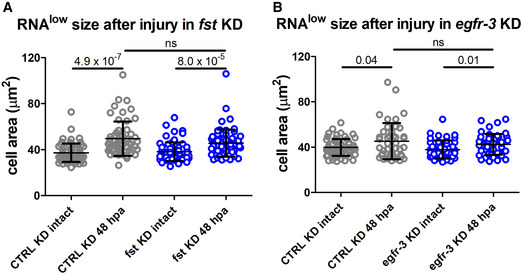
RNAlow neoblast size in intact animals and at 48‐hpa in control or fst KD animals (n ≥ 56).
RNAlow neoblast size in intact animals and at 48‐hpa in control or egfr‐3 KD animals (n ≥ 43).
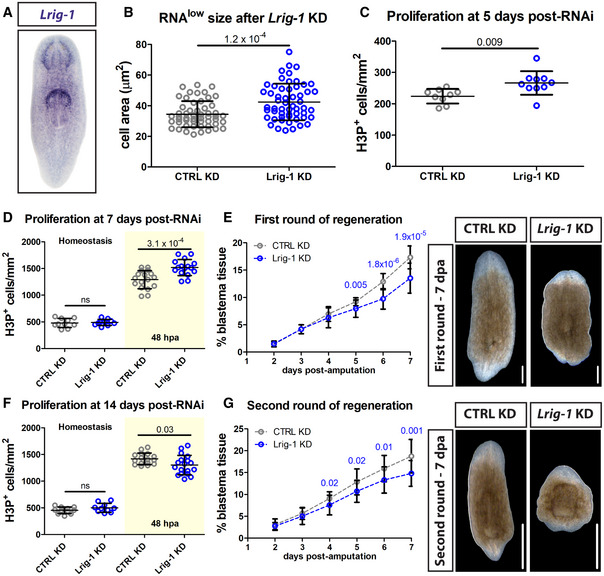
Representative WISH images for Lrig‐1.
RNAlow neoblast size in intact animals following control or Lrig‐1 knockdown (n ≥ 53 technical replicates).
Quantification of H3P immunostaining in intact animals following control or Lrig‐1 knockdown (n = 9–10 technical replicates).
Quantification of H3P immunostaining at homeostasis (fixed at 7 days post‐RNAi, white region) and at 48 hpa (amputated at 5 days post‐RNAi and fixed at 7 days post‐RNAi, yellow region) during the first round of regeneration in control or Lrig‐1 KD animals (n = 10–17).
Quantification of unpigmented blastema area (as % total tissue area) in regenerating control or Lrig‐1 KD animals from 2 to 7 dpa during the first round of regeneration (n = 10 animals per condition per time point). The same animals were used for all time points. Representative images from 7 dpa are shown. Scale bars, 500 µm.
Quantification of H3P immunostaining at homeostasis (fixed at 14 days post‐RNAi, white region) and at 48 hpa (amputated at 12 days post‐RNAi and fixed at 14 days post‐RNAi, yellow region) during a second round of regeneration in control or Lrig‐1 KD animals (n = 10–18).
Quantification of unpigmented blastema area (as % total tissue area) in regenerating control or Lrig‐1 KD animals from 2 to 7 dpa during the second round of regeneration (n = 9–10 animals per condition per time point). The same animals were used for all time points. Representative images from 7 dpa are shown. Scale bars, 500 µm.
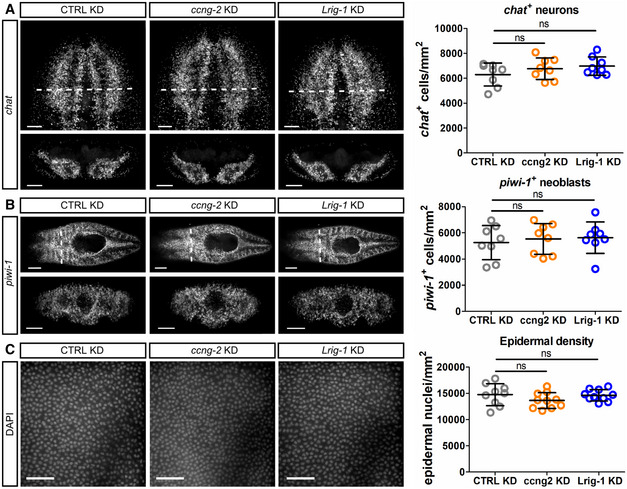
- A–C
Representative confocal images and quantifications of chat + neurons (A), piwi‐1 + neoblasts (B) and cell nuclei in the epidermis marked by DAPI (C) following control, ccng2, or Lrig‐1 knockdown at homeostasis (n = 8 technical replicates for all). Scale bars, 100 µm in (A); 250 µm in (B) (top panels) and 100 µm in (B) (bottom panels); 50 µm in (C).
References
Publication types
MeSH terms
Associated data
- Actions
- Actions
- Actions
Grants and funding
LinkOut - more resources
Full Text Sources
Other Literature Sources
Miscellaneous
