. 2021 Mar;73(3):478-489.
doi: 10.1002/art.41532. Epub 2021 Jan 29.

Type I Interferon-Activated STAT4 Regulation of Follicular Helper T Cell-Dependent Cytokine and Immunoglobulin Production in Lupus

Affiliations

Type I Interferon-Activated STAT4 Regulation of Follicular Helper T Cell-Dependent Cytokine and Immunoglobulin Production in Lupus

Xuemei Dong et al. Arthritis Rheumatol. 2021 Mar.

Abstract

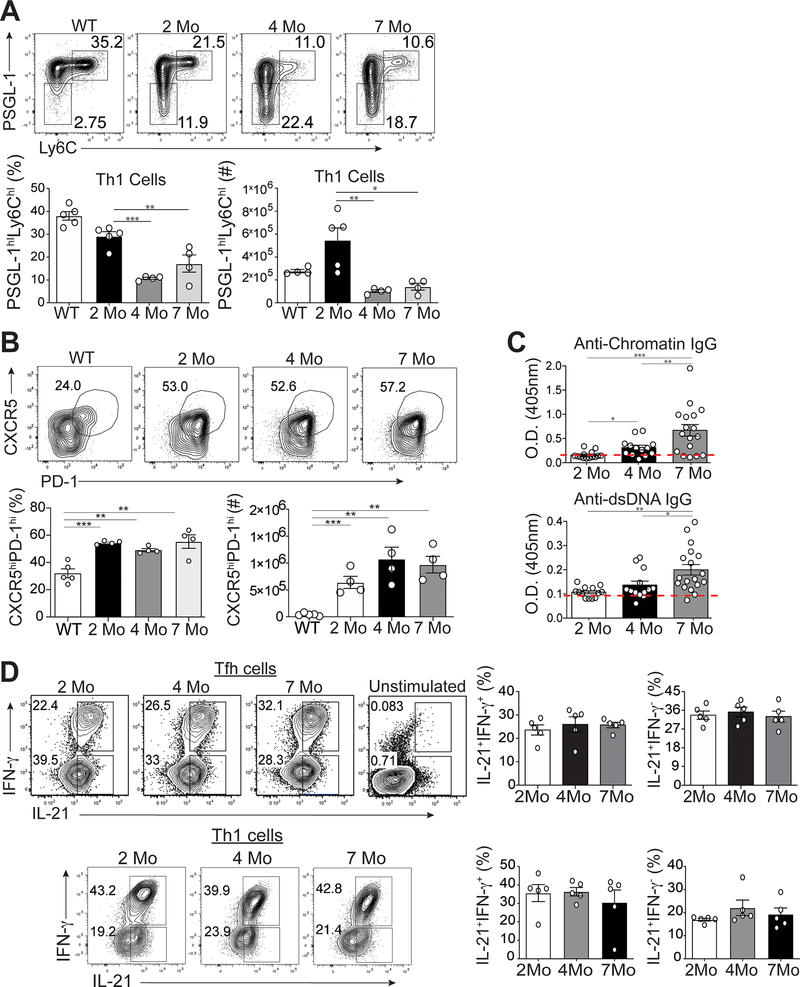
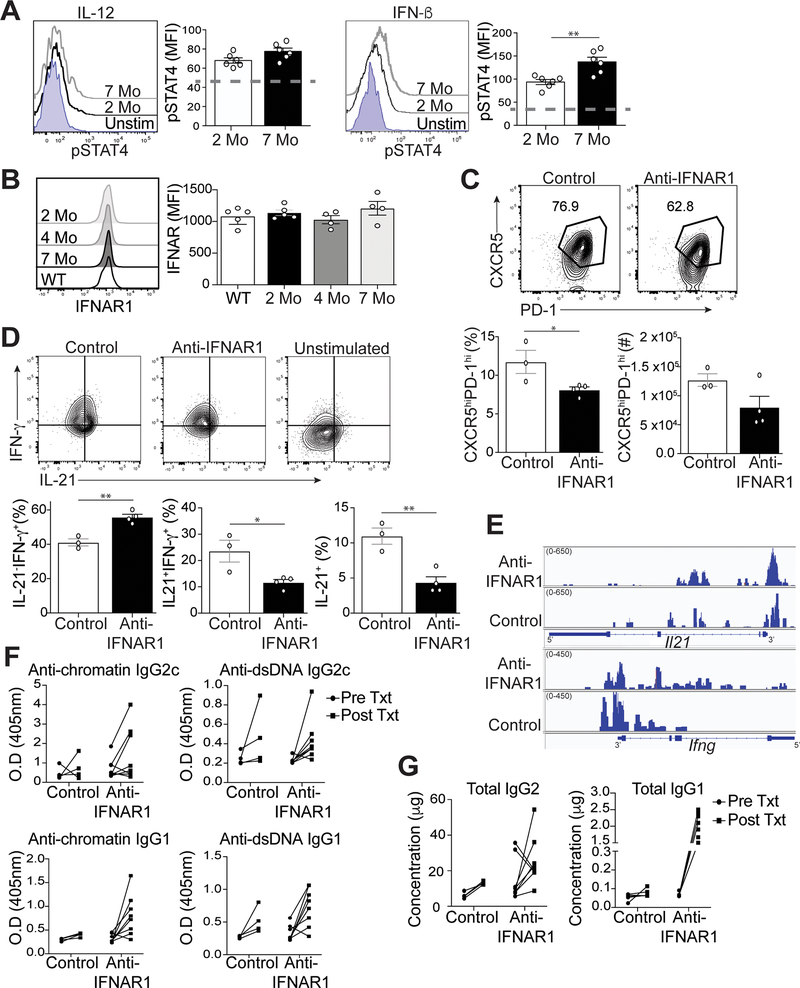
Objective: To assess the role of STAT4 activation in driving pathogenic follicular helper T (Tfh) cell secretion of the cytokines interleukin-21 (IL-21) and interferon-γ (IFNγ) in murine and human lupus.

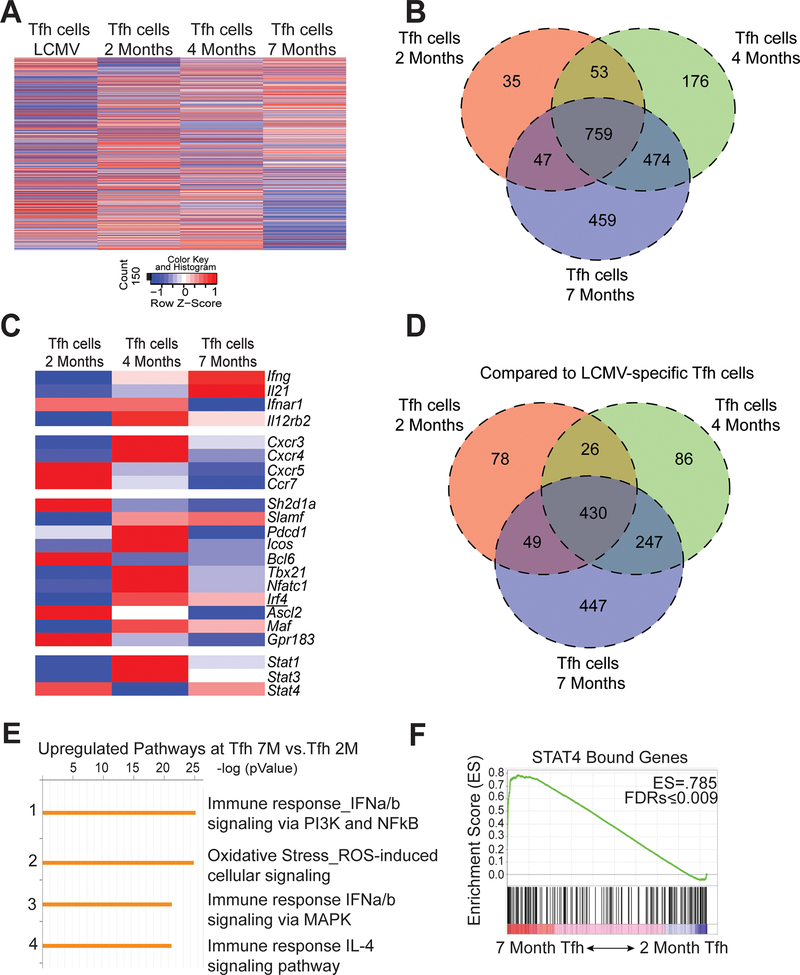
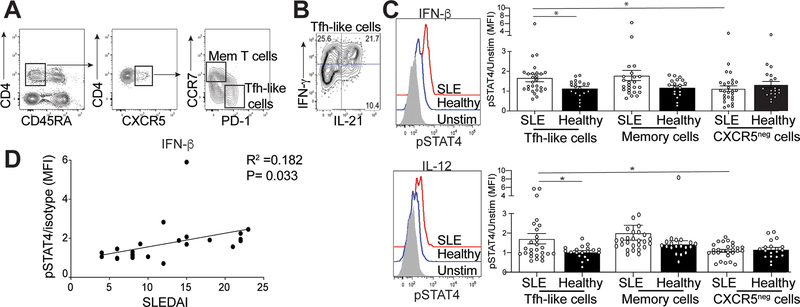
Methods: The effect of STAT4-dependent Tfh cell signaling on cytokine production and autoreactive B cell maturation was assessed temporally during the course of lupus in a murine model, with further assessment of Tfh cell gene transcription performed using RNA-Seq technology. STAT4-dependent signaling and cytokine production were also determined in circulating Tfh-like cells in patients with systemic lupus erythematosus (SLE), as compared to cells from healthy control subjects, and correlations with disease activity were assessed in the Tfh-like cells from SLE patients.

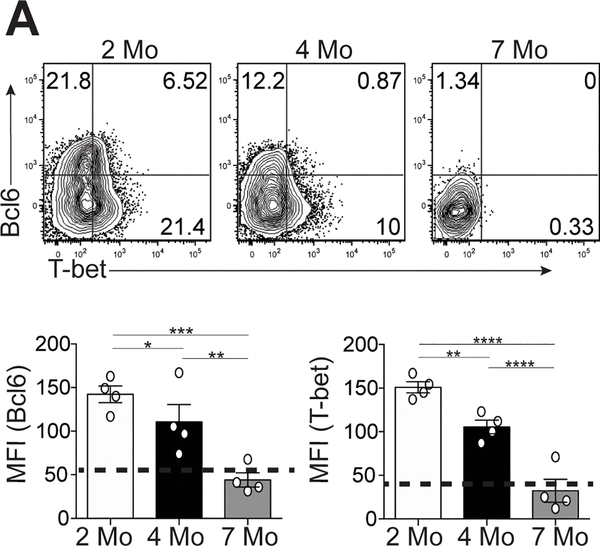
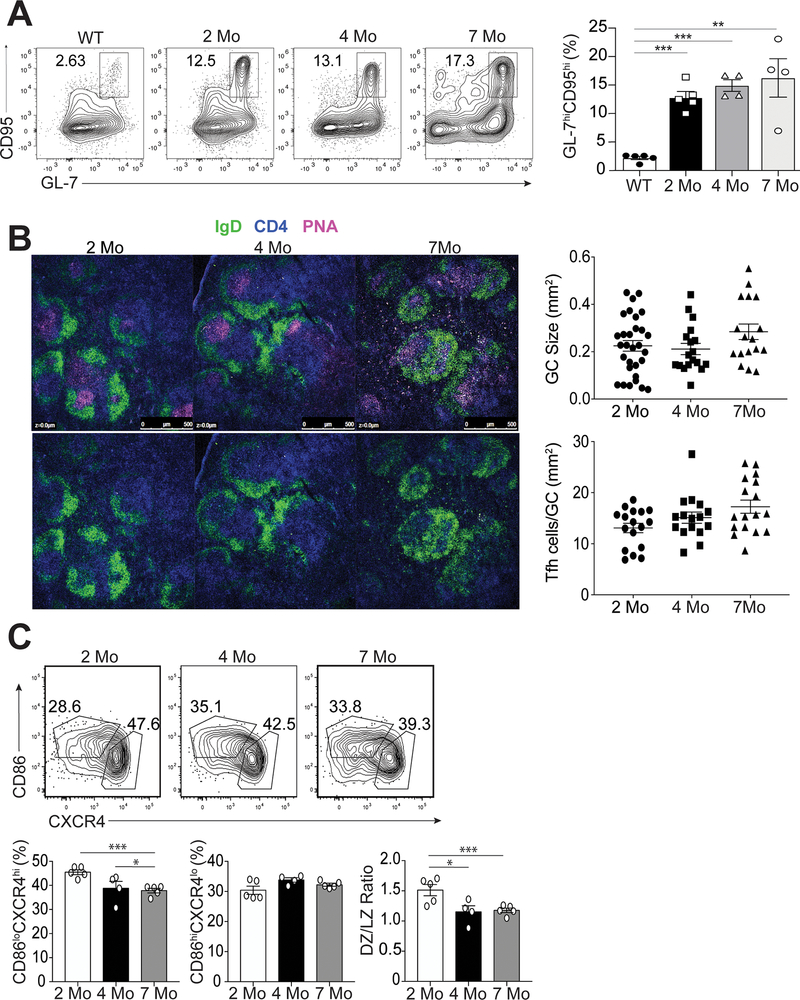
Results: IL-21- and IFNγ-coproducing Tfh cells expanded prior to the detection of potentially pathogenic IgG2c autoantibodies in lupus-prone mice. Tfh cells transcriptionally evolved during the course of disease with acquisition of a STAT4-dependent gene signature. Maintenance of Tfh cell cytokine synthesis was dependent upon STAT4 signaling, driven by type I IFNs. Circulating Tfh-like cells from patients with SLE also secreted IL-21 and IFNγ, with STAT4 phosphorylation enhanced by IFNβ, in association with the extent of clinical disease activity.

Conclusion: We identified a role for type I IFN signaling in driving STAT4 activation and production of IL-21 and IFNγ by Tfh cells in murine and human lupus. Enhanced STAT4 activation in Tfh cells may underlie pathogenic B cell responses in both murine and human lupus. These data indicate that STAT4 guides pathogenic cytokine and immunoglobulin production in SLE, demonstrating a potential therapeutic target to modulate autoimmunity.


Conflict of interest statement

The authors have declared that no conflict of interest exists.

Figures

Figure 1.
Figure 1.
Temporal formation of Tfh and Th1 cells during different stages of disease. Spleens were harvested from either B6.Sle1.Yaa at 2, 4, and 7 months of age or control 2 months of age wild type B6 mice. (A) Representative flow cytometry plots of Ly6chiPSGL-1hi Th1 cells from B6.Sle1.Yaa mice with percentages and numbers of cells (bottom left and right, respectively) (B) Representative flow cytometry plots of CXCR5hiPD-1hi Tfh cells from B6.Sle1.Yaa mice with percentages and numbers cells (bottom left and right, respectively). (C) Anti-Chromatin IgG (left), and Anti-IgG antibodies (right) in sera of mice B6.Sle1.Yaa at 2, 4, and 7 months of age, with a dashed line representing the average O.D. from 6-month-old wild type B6 mice. (D) Intracellular IL-21 and IFN-γ staining in Tfh cells (top) and Th1 cells (bottom) with percentages (right) of cytokine-positive cells. Cytokine positive cells gates were based on unstimulated Tfh cells (top right). Data are representative of 3 experiments with 3–5 mice per group. ***p < 0.001; **p < 0.01; *p < 0.05 by Student’s t-test. Error bars represent SEM.
Figure 2.
Figure 2.
Temporal expression of T-bet and Bcl6 in Tfh cells in lupus-prone mice. Spleens were harvested from either B6.Sle1.Yaa at 2, 4, and 7 months of age. (A) Representative flow cytometry plots of intracellular Bcl6 and T-bet in splenic Ly6cloPSGL-1loCXCR5hiPD-1hi Tfh cells, with bar graphs that summarize the quantified geometric mean fluorescence intensity of staining (MFI) of Bcl6 (left) or T-bet (right). Data are representative of 3 experiments with 3–5 mice per group. ****p < 0.0001; ***p < 0.001; **p < 0.01; *p < 0.05 by Student’s t-test. Error bars represent SEM.
Figure 3.
Figure 3.
Characterization of GC B cells during the progression of disease. Spleens were harvested from B6.Sle1.Yaa at 2, 4, and 7 months of age or control 2 months of age wild type B6 mice. (A) Representative flow cytometry plots of CD4-B220+IgDloCD95hiGL-7hi GC B cells at each time point with cell percentages (right). (B) Splenic B cell follicles of B6.Sle1.Yaa mice stained with anti-IgD (green), anti-CD4 (blue) and PNA (magenta), with GC sizes quantified (top right) and the numbers of T cells per GC size (bottom right). (C) Representative flow cytometry plots of dark zone (CD86-CXCR4+) and light zone (CD86+CXCR4-) GC B cells gated on CD4-B220+IgDloCD95hiGL-7hi GC B cells, with cell percentages and numbers (right). Data are representative of 3 experiments with 3–5 mice per group. ***p < 0.001; *p < 0.05 by Student’s t-test. Error bars represent SEM.
Figure 4.
Figure 4.
Evolving transcriptional profile of Tfh cells during the progression of disease. Spleens were harvested from B6.Sle1.Yaa at 2, 4, and 7 months of age or from LCMV infected mice 8 days post infection. (A) Heat map of normalized hit counts for differentially expressed genes at 7 or 2 months (rows) in Tfh cells (columns). (B) Venn diagram of differentially expressed genes comparing Tfh cells from 2, 4, and 7 months of age mice to 2-month naïve control. (C) Heatmap of selected T cell-related genes. * FDR-adjusted q < 0.05 comparing Tfh cells at 7 months or 2 months. (D) Venn diagram comparing differentially expressed genes of Tfh cells from 2, 4, and 7 months of age mice to Tfh cells from Day 8 LCMV. (E) Enrichment pathways analysis of the upregulated genes in Tfh cells at 7 months to 2 months, with the top four pathways listed, including the enrichment p value. (F) GSEA revealed a significant enrichment in Stat4-dependent genes at 7-Mo vs. 2-Mo in Tfh cells. Number in top-right corner is the enrichment score. Data are representative of 2 replicates with 3 mice per group.
Figure 5.
Figure 5.
IFN-I regulates Tfh cell-IL-21 and IFN-γ production in lupus. Spleens were harvested from B6.Sle1.Yaa mice at 2 and 7 months of age. (A) Splenocytes were stimulated with IL-12 or IFN-I. Representative flow histogram of pSTAT4 in Tfh cells was determined by intracellular staining (dashed line represents unstimulated control). (B) Representative flow cytometry plots of IFNAR1 on Tfh cells from B6.Sle1.Yaa mice with the MFI of IFNAR1 (right). (C) Splenocytes from 5-month B6.Sle1.Yaa mice treated twice a week for 4 weeks with either anti-IFNAR1 (375ug) or anti-rat IgG (1mg/mL). Representative flow cytometry plots of CXCR5hiPD-1hi Tfh cells from treated B6.Sle1.Yaa mice with percentages and numbers cells (bottom left and right, respectively). (D) Representative flow cytometry plots of intracellular IL-21 and IFN-γ staining in Tfh cells (top) with percentages of (bottom) of cytokine positive cells. Gates were based on unstimulated Tfh cells (top right). (E) Assay for transposase-accessible chromatin using sequencing (ATAC-seq) for Il21 and Ifng loci. (F) Anti-chromatin (left), anti-dsDNA antibodies (right), and (G) total Ig from sera of pre and post-treated mice. Data are representative of 2 experiments with 3–5 mice per group. **p < 0.01; *p < 0.05 by Student’s t-test. Error bars represent SEM.
Figure 6.
Figure 6.
Activation of STAT4 is correlated with increased disease activity. Isolated mononuclear cells from the peripheral blood from SLE patients or healthy controls were rested in 10% complete DMEM solution overnight, then stimulated by IL-12 of IFN-β. (A) Representative gating strategy to identify memory T cells or Tfh-like cells. (B) Intracellular IL-21 and IFN-γ staining in Tfh-like cells from an SLE patient. (C) Representative flow histogram of pSTAT4 from cells stimulated with either IFN-β (top) or IL-12 (bottom), graphs summarizing the ratio of MFI of stimulated pSTAT4 in Tfh-like (left), memory T (middle) or activated CXCR5- cells (right) to their unstimulated pSTAT4 MFI for each individual sample. (D) Linear regression analysis of the pSTAT4/unstimulated ratio in SLE patients compared to their disease activity measured by SLEDAI. Data are representative of 27 SLE and 19 HC, *p < 0.05 by Mann-Whitney. Error bars represent SEM. Pearson R =0.182, P=0.033

Comment in

References

    1. Choi JY, Ho JH, Pasoto SG, Bunin V, Kim ST, Carrasco S, et al. Circulating follicular helper-like T cells in systemic lupus erythematosus: association with disease activity . Arthritis & rheumatology (Hoboken, NJ). 2015;67(4):988–99. - PMC - PubMed
    1. Simpson N, Gatenby PA, Wilson A, Malik S, Fulcher DA, Tangye SG, et al. Expansion of circulating T cells resembling follicular helper T cells is a fixed phenotype that identifies a subset of severe systemic lupus erythematosus. Arthritis Rheum. 2010;62(1):234–44. - PubMed
    1. Linterman MA, Beaton L, Yu D, Ramiscal RR, Srivastava M, Hogan JJ, et al. IL-21 acts directly on B cells to regulate Bcl-6 expression and germinal center responses. J Exp Med. 2010;207(2):353–63. - PMC - PubMed
    1. Zotos D, Coquet JM, Zhang Y, Light A, D’Costa K, Kallies A, et al. IL-21 regulates germinal center B cell differentiation and proliferation through a B cell-intrinsic mechanism. J Exp Med. 2010;207(2):365–78. - PMC - PubMed
    1. Lee SK, Silva DG, Martin JL, Pratama A, Hu X, Chang PP, et al. Interferon-gamma excess leads to pathogenic accumulation of follicular helper T cells and germinal centers. Immunity. 2012;37(5):880–92. - PubMed

Publication types

MeSH terms