. 2021 Mar 1;153(3):e202012604.
doi: 10.1085/jgp.202012604.

Multiscale modeling of twitch contractions in cardiac trabeculae

Affiliations

Multiscale modeling of twitch contractions in cardiac trabeculae

Srboljub M Mijailovich et al. J Gen Physiol. .

Abstract

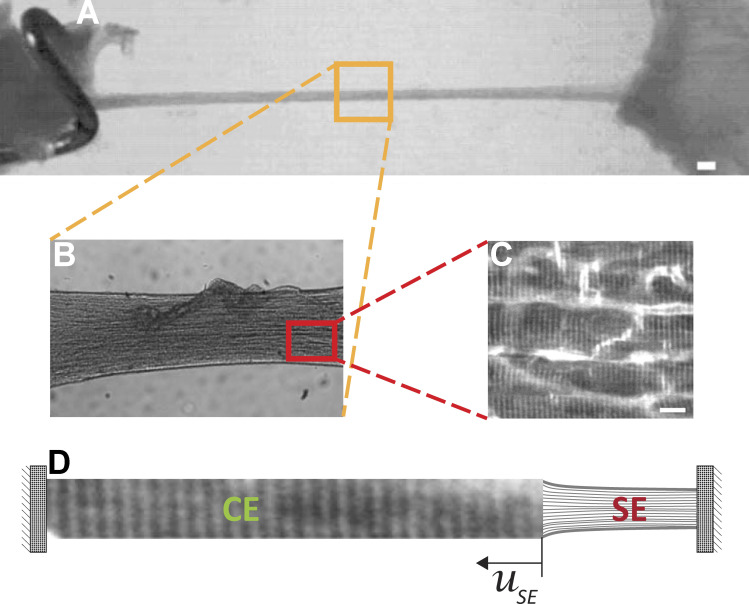
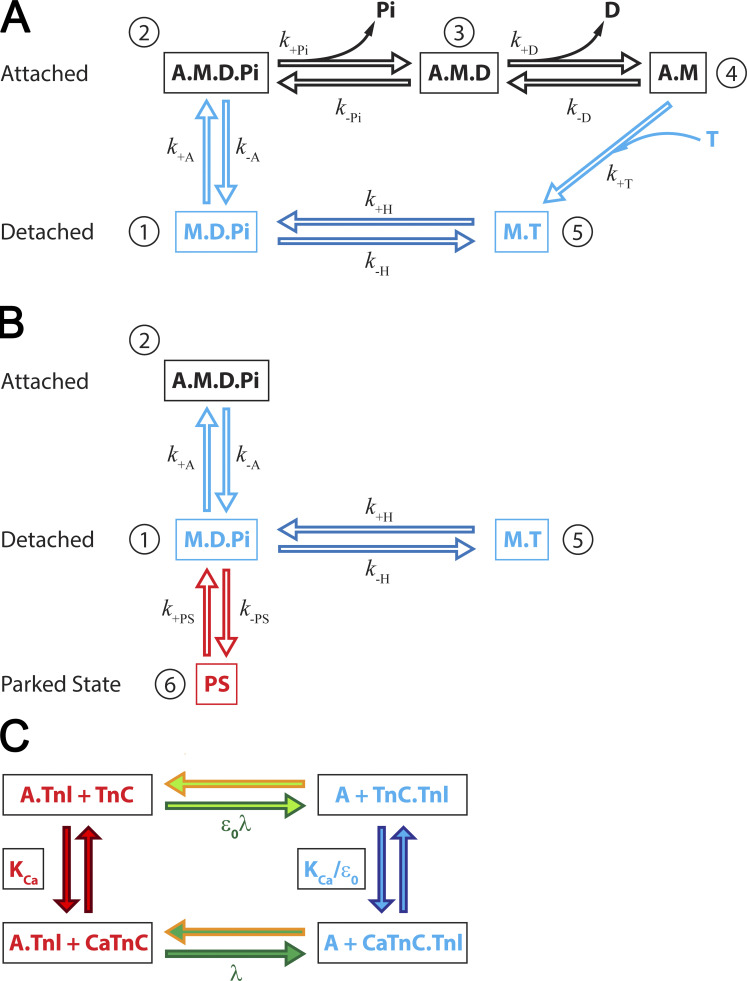
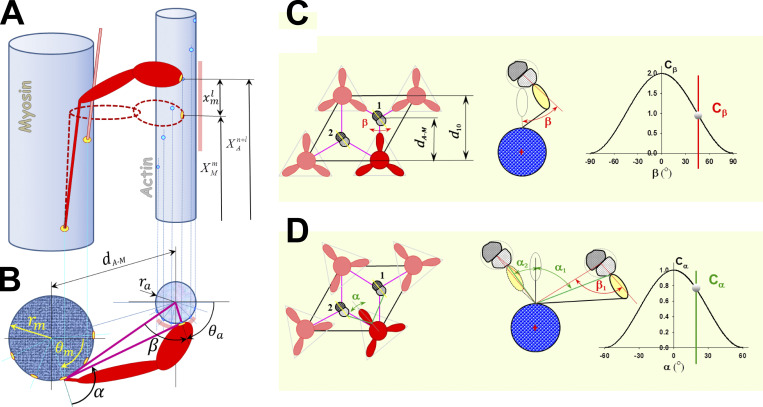
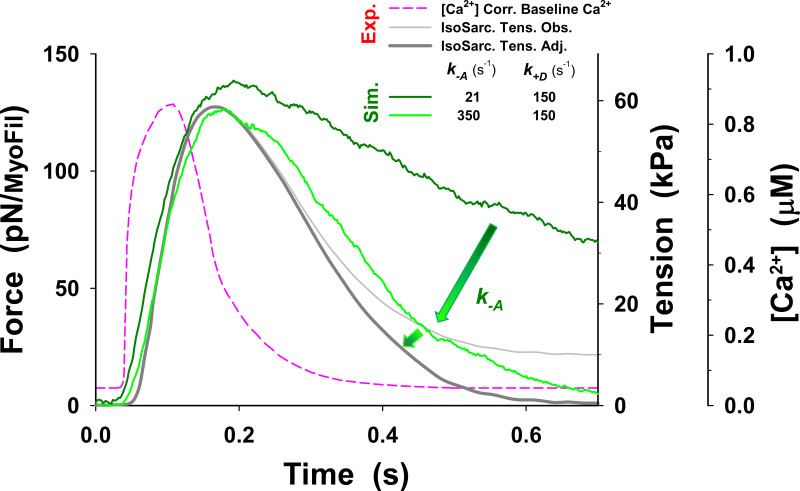
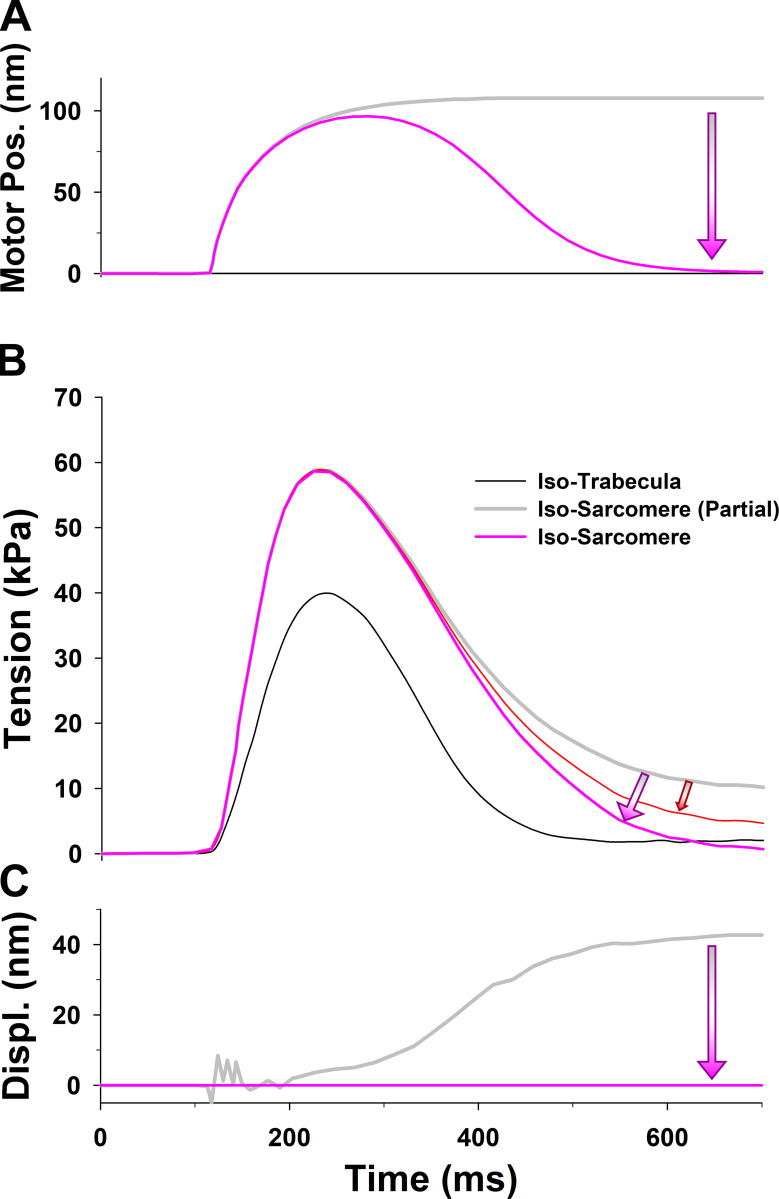
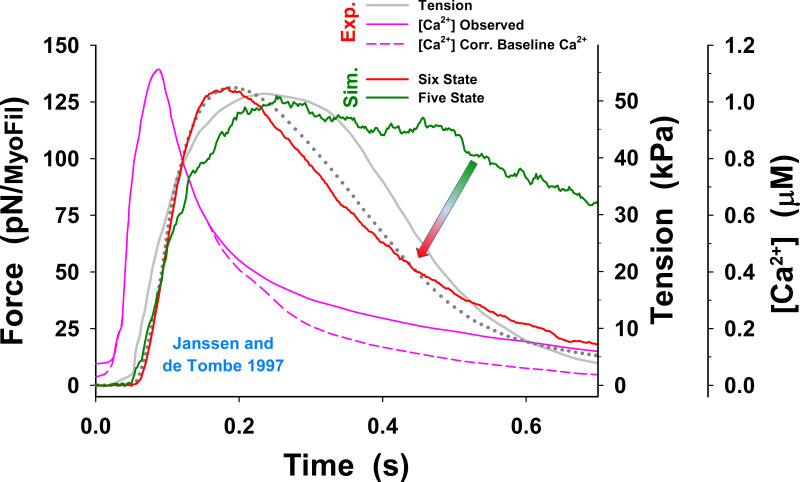
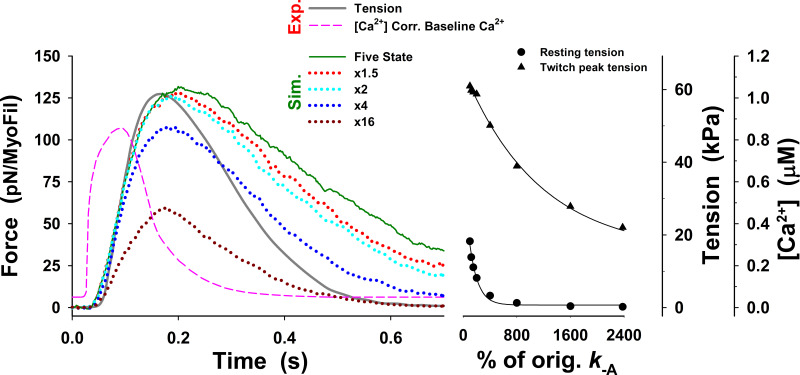
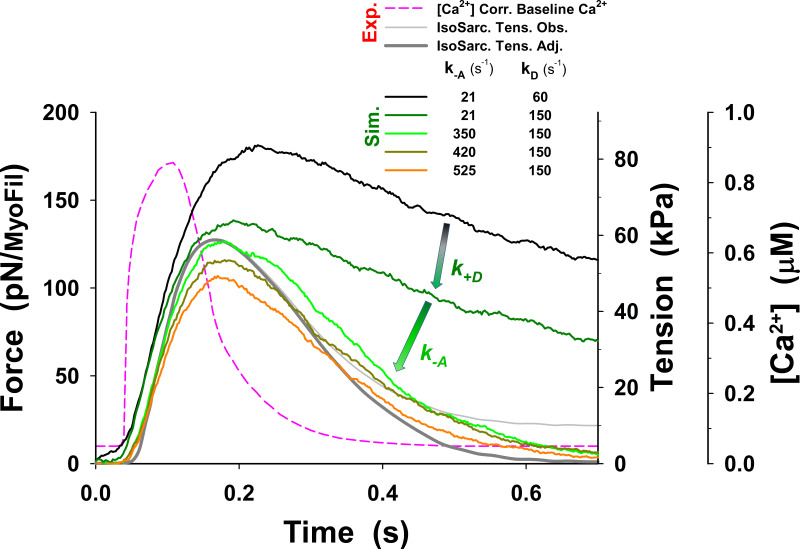
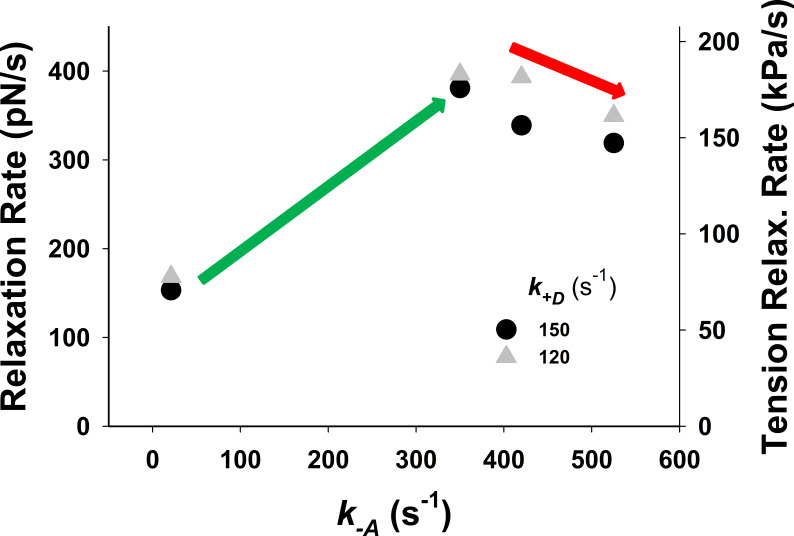
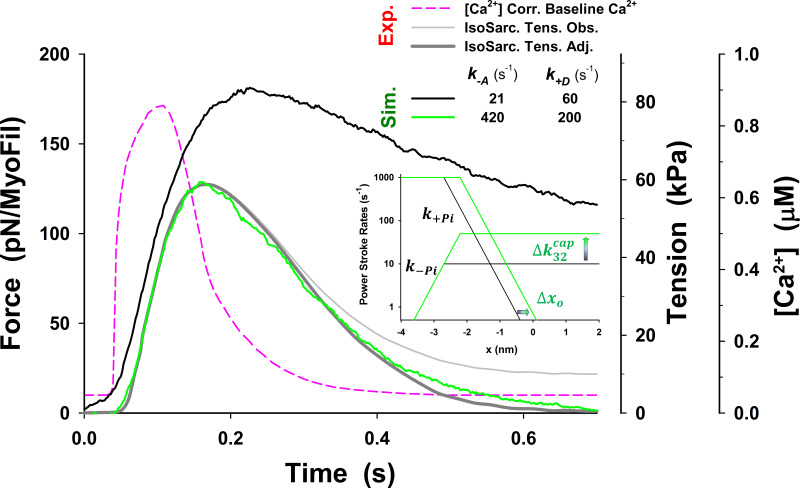
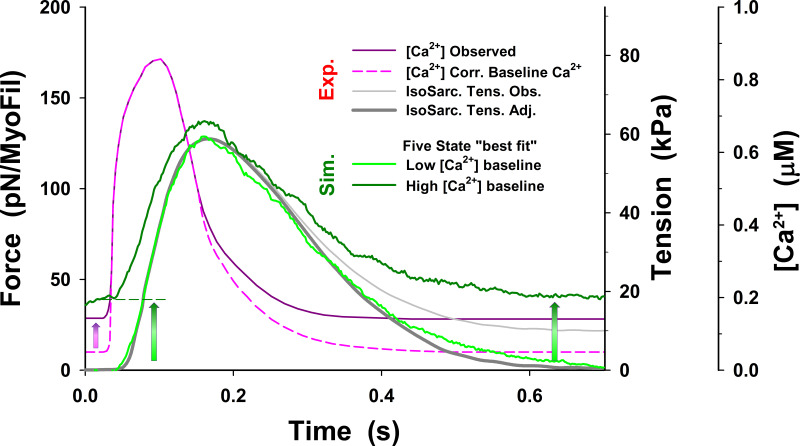
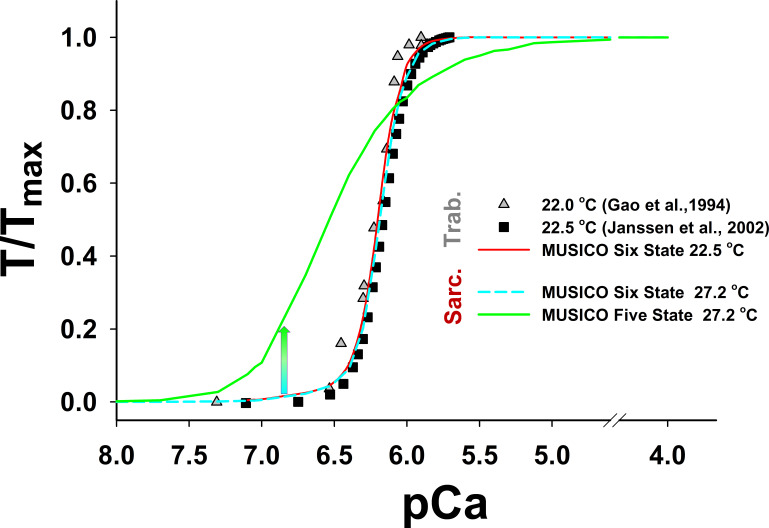
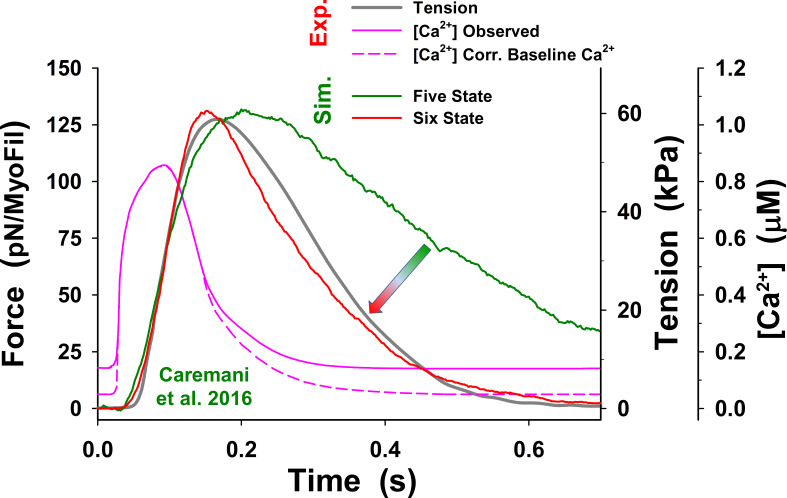
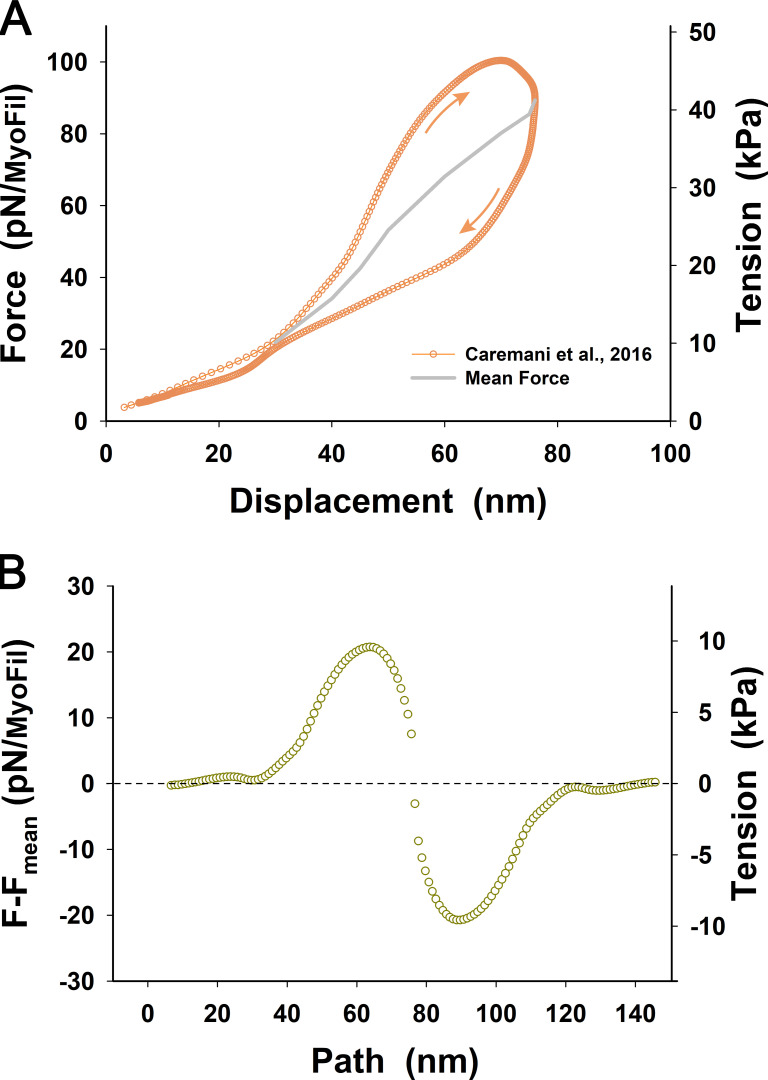
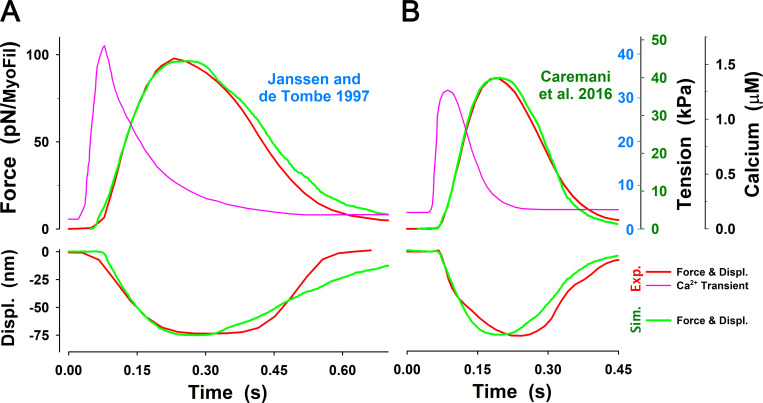
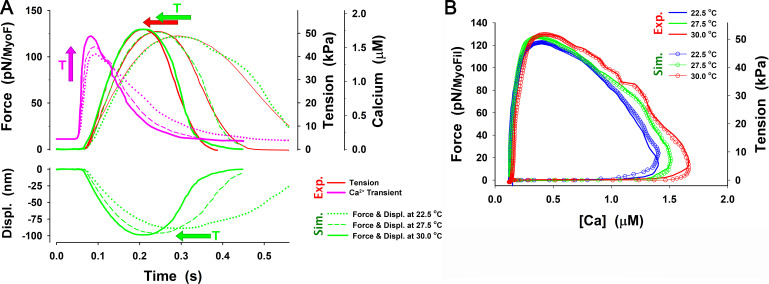
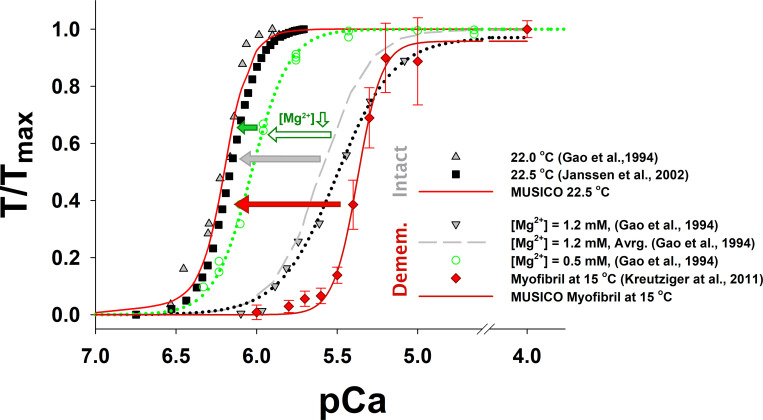
Understanding the dynamics of a cardiac muscle twitch contraction is complex because it requires a detailed understanding of the kinetic processes of the Ca2+ transient, thin-filament activation, and the myosin-actin cross-bridge chemomechanical cycle. Each of these steps has been well defined individually, but understanding how all three of the processes operate in combination is a far more complex problem. Computational modeling has the potential to provide detailed insight into each of these processes, how the dynamics of each process affect the complexity of contractile behavior, and how perturbations such as mutations in sarcomere proteins affect the complex interactions of all of these processes. The mechanisms involved in relaxation of tension during a cardiac twitch have been particularly difficult to discern due to nonhomogeneous sarcomere lengthening during relaxation. Here we use the multiscale MUSICO platform to model rat trabecular twitches. Validation of computational models is dependent on being able to simulate different experimental datasets, but there has been a paucity of data that can provide all of the required parameters in a single experiment, such as simultaneous measurements of force, intracellular Ca2+ transients, and sarcomere length dynamics. In this study, we used data from different studies collected under similar experimental conditions to provide information for all the required parameters. Our simulations established that twitches either in an isometric sarcomere or in fixed-length, multiple-sarcomere trabeculae replicate the experimental observations if models incorporate a length-tension relationship for the nonlinear series elasticity of muscle preparations and a scheme for thick-filament regulation. The thick-filament regulation assumes an off state in which myosin heads are parked onto the thick-filament backbone and are unable to interact with actin, a state analogous to the super-relaxed state. Including these two mechanisms provided simulations that accurately predict twitch contractions over a range of different conditions.


Figures

Figure 1.
Figure 1.
Origin of trabecula series elasticity is complex and might include muscle fiber alignment and connective tissue serial elasticity. (A) A rat right ventricular trabecula mounted between a force transducer and a motor (scale bar, 50 µm). (B) The magnified region displays alignment of muscle fibers along trabeculae. (C) Higher magnification shows stratifications along muscle fibers as well as imperfect alignments showing gaps between and along muscle fibers (scale bar, 10 µm). (D) The simplest method is to include trabecula elasticity (SE) in series with the CE consisting of multiplesarcomere muscle fibers. The change of SE element length uSE is equal to change in multisarcomere fiber length.
Figure 2.
Figure 2.
Model of the cross-bridge cycle. (A) Five-state model of the actomyosin cycle includes biochemical states consistent with observed structural states: a detached state 1, M.D.Pi; weakly bound state 2, A.M.D.Pi; strongly bound post–power stroke state 3, A.M.D; rigor-like state 4, A.M; and detached state 5, M.T. The strain-dependent state transition rates are also associated with conformational changes defining the structural conformations of myosin in each state (i.e., power stroke, d, associated with Pi release, and stroke, δ, associated with the ADP release, ATP binding and cross-bridge detachment, and hydrolysis and reverse stroke). (B) Addition of a state representing interaction of myosin heads with the thick filament backbone, the so-called “parked state”, PS, denoted as state 6, into a five-state model from A. The PS is a partial M.D.Pi state with structural conformation associated with thick-filament backbone, reducing the population of the M.D.Pi state capable of binding to actin and therefore fluxes from M.D.Pi state to A.M.D.Pi state (myosin binding to actin) or the reverse hydrolysis to M.T state. The transition rate from PS to M.D.Pi, k+PS, is assumed to be strongly dependent on [Ca2+], and the transition rate from M.D.Pi state to PS, kPS, is independent on [Ca2+]. (C) Kinetic scheme of calcium binding to TnC and interaction of TnI with actin in cardiac muscle. Calcium binding to TnC, with the equilibrium rate KCa= kCa(Ca2+)/kCa, forms a Ca2+.TnC complex and reduces affinity of TnI to actin. The detachment rate of TnI from actin is defined by the equilibrium rate λ forming the CaTnC.TnI state. In CaTnC state, Tpm is free to move, mostly azimuthally, permitting myosin binding and force generation. The dissociation from A.TnI to TnC.TnI state without bound Ca2+ is slow, attenuated by εo1, and the calcium binding to TnC.TnI into the CaTnC.TnI complex is accelerated by a factor 1/εo.
Figure S1.
Figure S1.
Interaction between myosin heads and actin filaments in 3-D is defined by the triple-helical arrangement of myosin molecules along the myosin filament and the double-helical arrangement of monomers (myosin-binding sites) along the actin filaments. The 3-D geometry of myosin head binding domains and binding sites on actin in a sarcomere requires both longitudinal position matching and angular matching in the azimuthal plane. (A) Each myosin head m can move from its undeformed position XMm along actin filament due to thermal agitation and can reach a few neighboring binding sites on actin. The myosin-binding domain is shown as a yellow oval at the tip of the myosin head, and binding sites on actin are shown as bright blue circles. The range of axial movement is shown as a pale red bar. The relative axial position of a myosin head (cross-bridge) XMmt and adjacent actin sites XAn+lt, where superscripts n+l and l denote the index of an adjacent site on actin, and l=0, 1, 2,La1 is the index of accessible sites on actin in neighborhood of m, respectively. The maximum number of adjacent sites on actin reachable by a myosin head m is denoted as La. To bind the site +l, the cross-bridge, including S2 and a myosin head, needs to stretch or compress axially for displacement xml. (B) In the 3-D sarcomere lattice, the actin and myosin filaments are separated by spacing dAM, and sites on the actin filament (strand) are at an azimuthal angle β. In addition, a cross-bridge needs to turn from its equilibrium position by an angle α to reach an actin filament that is not aligned with its equilibrium angular position. For precise calculations of the angles, it is necessary to know the myosin equilibrium angular positions θm, angular position of site on actin filament θa, and diameters of myosin and actin filaments 2rm and 2ra, respectively. The angular range of movement is denoted as a pale red arc around the actin filament. The azimuthal weight factors Cβ and Cα of myosin binding in 3-D sarcomere lattice are defined as in C and D. (C) When myosin heads in crown 1 are directly aligned with three actin filaments, then Cα = 1 and Cβ weights the azimuthal departure of a myosin-binding site on the actin filament from the plane passing through myosin and actin longitudinal axes, where the angle β is a function of the axial departure from perfect matching, ξ, which resembles the preference for myosin heads to bind to favorably oriented sites on the actin filament. (D) When myosin heads are not directly aligned with the surrounding actin filaments, such as with crowns 2 and 3, the weight factor Cα takes into account the departure by the angle α from perfect alignment between the heads on the crown and the reachable actin filaments. Figure S1 is adapted from Mijailovich et al. (2016).
Figure S2.
Figure S2.
Effect of the five-state cross-bridge model rate kAo on relaxation of twitch tension in isometric half-sarcomeres (IoSarc.). The simulation, with parameters obtained from fits of isometric half-sarcomere tension at 27.2°C (Fig. 3), shows slow relaxation (dark green line). An additional increase of kAo by ∼17-fold significantly increases the rate of relaxation (green line and arrows), but it is still insufficient to reach the observation (dark gray line). The superscript o is omitted from the figure display for clarity.
Figure S3.
Figure S3.
SL controlled isometric tension of a half-sarcomere. (A) Observed change in length of trabeculae per half-sarcomere (gray line) and corrected length of trabeculae to truly keep a half-sarcomere length isometric (pink line), which shows a decrease in trabecula length (i.e., motor position) toward the initial length of relaxed muscle. (B) Correction of the tension transient during the twitch due the change in SL (gray line in C). The observed tension (gray line) and the tension after correcting for the PE passive tension due to change of half-sarcomere length (red line) and also after additional correction for titin (passive) forces (pink line). (C) Change in half-sarcomere length (gray line) shows the effect of losing control of HS length that apparently should be constant (pink line). The tension of the trabecula length was fixed (black line in B) is shown for reference. The direction and color of the arrows signify changes in length and tension.
Figure S4.
Figure S4.
Significance of the PS in twitch relaxation phase. The simulations of a half-sarcomere isometric twitch with the five-state model showed slow relaxation (dark green line) compared with adjusted observations of Janssen and de Tombe, 1997 (gray line), even when the baseline [Ca2+] was reduced (pink dashed line). The simulations also showed high muscle resting tension at observed baseline [Ca2+] (not shown), similar to that shown by Prodanovic et al. (2020) at comparable low [Ca2+]. In contrast, the simulations with the six-state model, which includes the PS, significantly increased the speed of relaxation (indicated by arrow), but the model predictions state (red line) followed the poorly observed unusual flat top to the tension transient reported by Janssen and de Tombe, 1997. However, the model predictions approximately matched the simulation of tension reported by Niederer et al. (2006) (dark gray dotted line), suggesting possible inconsistency of the observation with other similar data. In the simulations, we used the same model parameters as shown in Table 1, except k+Ao, kAo, and k+Do, which are presented in the text here for the five-state model and in Table 2 for the six-state cross-bridge cycle. For comparison, mean force per myosin filament and corresponding (observed) muscle tension are shown on the vertical axes. For consistency, resting tension is subtracted in all plots; thus, the responses to calcium transient display net change in active tension.
Figure S5.
Figure S5.
Comparative tension–displacement loops obtained from Janssen and de Tombe and Caremani et al. (red and orange symbols and lines, respectively). Related to Janssen and de Tombe, 1997; Caremani et al., 2016. Both loops indicated viscoelastic behavior showing higher tension during shortening and lower tension during relaxation accompanied with lengthening. In both cases, the peak force per myofilament and maximum shortening were about the same, but Janssen and de Tombe’s loop is much wider and more asymmetric about the mean value than that of Caremani et al. (see also Fig. 4 B). The Janssen and de Tombe loop (red line) also shows a large drop in tension after reaching maximum shortening and, after the drop in tension, relaxes slowly during lengthening, having a higher value of tension than the initial value at displacement <4 nm. This deviation of the descending part of the loop shows some uncertainty in the measurements compared with that of Caremani et al. Thus, for simplicity, we derived a nonlinear serial springlike elasticity from Caremani et al.’s average tension–displacement relationship (thick gray line) that shows more consistent behavior at displacement <40 nm and a nicely rounded loop at the tip of shortening. Because the conversion factor between force per myofilament and tension depends on the length at which the trabecula cross-section was measured, the corresponding tensions are shown in red letters for Janssen and de Tombe’s loop and in orange letters for Caremani et al.’s loop.
Figure S6.
Figure S6.
Comparison of ATP consumption rate, ATPase, during twitch contractions of isometric half-sarcomere and fixed-length trabeculae. During twitch in an isomeric half-sarcomere, the ATPase rate increases up to 15% due to relative movement between extensible filaments compared with the ATPase with rigid filaments (Mijailovich et al., 1996). Therefore, ATPase shows only a minor increase if the extensibility of thick and thin filaments is taken into account. In contrast, the ATPase in fixed-length trabeculae shows more than an order of magnitude change during tension rise, having a peak value ∼21 s−1. This large increase is associated with a large degree of sarcomere shortening (80 nm) that requires multiple detachments and reattachments of the cross-bridges. The ATPase is calculated as the rate of cross-bridge detachment over the number of cross-bridges participating in an active cross-bridge cycle; that is, the cross-bridge in PS is excluded.
Figure S7.
Figure S7.
ATPase is strongly correlated to sarcomere-shortening velocities in fixed-length trabeculae during force development (in SL per second). The nondimensional ratio of the ATPase and sarcomere-shortening velocity slowly increases from ∼25 at 1 SL/s to ∼50 at 0.25 SL/s. The progressive increase of the normalized ATPase suggests that there is a steady-state component of ATPase that becomes more evident at low shortening velocities <0.25 SL/s. Interestingly, about the same behavior is observed for the simulations of twitches and force development in fixed-length trabeculae. The shortening velocities rise sharply up to 3 SL/s and quickly drop to ∼1 SL/s and further decrease as the rate of force rise decreases.
Figure S8.
Figure S8.
Changes in twitch tension from Fig. 5 B (black line) by ±20% variation in binding rate, k+Ao. Increase in k+Ao increases the peak of the twitch tension and shows delay in relaxation. The superscript o is omitted from the figure display for clarity.
Figure S9.
Figure S9.
Changes in twitch tension from Fig. 5 B (black line) by ±20% variation in detachment rate, kAo. Increase in kAo increases the rate in tension relaxation. The superscript o is omitted from the figure display for clarity.
Figure S10.
Figure S10.
Changes in twitch tension from Fig. 5 B (black line) by ±20% variation in ADP release rate, k+Do. Increase in k+Do only slightly increases the peak of the twitch tension and the relaxation starts at earlier times. The superscript o is omitted from the figure display for clarity.
Figure S11.
Figure S11.
Changes in twitch tension from Fig. 5 B (black line) by ±40% variation in Hill coefficient of the rate sigmoidal rise, b. Increase in b decreases the peak of the twitch tension, and the relaxation starts earlier. These changes are much smaller for values of b>5.
Figure S12.
Figure S12.
Changes in twitch tension from Fig. 5 B (black line) by ±20% variation in [Ca2+] at the half of k+PS rise, [Ca2+]50. Increase in [Ca2+]50 decreases the peak of the twitch tension, and the relaxation starts earlier.
Figure S13.
Figure S13.
Changes in twitch tension from Fig. 5 B in the main text (black line) by ±40% variation in baseline rate from the PS, kPSo. Increases in kPSo increase the resting muscle tone and the peak of the twitch tension, and the relaxation is slower and slightly delayed.
Figure S14.
Figure S14.
Active tension corrected for the decrease in titin force due to shortening of a half-sarcomere. The observed tension is usually corrected for resting tension associated with the force in titin and other parallel connective tissue. The observed tension (black line) after the subtraction of the resting tension is usually reported as active tension. However, the resting tension in titin and other passive components decreases the tension due to shortening of the half-sarcomere denoted as displacements. The decrease in the (titin) force (green line) during twitch effectively increases active force (red to pink line) by the same amount. Force per myosin filament from MUSICO simulations is shown in parallel with the observed tension.
Figure S15.
Figure S15.
Effect of allosteric TnC–TnI–actin–Ca2+ interaction parameter, εo, on resting tension at observed baseline calcium level (0.143 µM) and when [Ca2+] is reduced to 0.05 µM. MUSICO simulations using the five-state cross-bridge cycle predicted a slight decrease in resting tension at both baseline [Ca2+] for decrease by three orders of magnitude in εo, but significant resting tension remains even at extremely low εo values. Parameters used in simulations are the same as used in the five-state model simulations shown in Fig. 3.
Figure S16.
Figure S16.
Changes in twitch tension predicted by the five-state model for change in k+Ao up to ±50% from those used for Fig. 3 (dark green line), denoted as orig. k+Ao. The main effects of changes in k+Ao on the tension responses are displayed in changes in the peak tension, resting tension, and the rate of tension rise, but the rate of relaxation only marginally changes in all cases and is much slower than the observed. The superscript o is omitted from the figure axis label for clarity.
Figure S17.
Figure S17.
Changes in twitch tension predicted by the five-state model for change in k+Do up to ±50% from those used in Fig. 3 (dark green line), denoted as orig. k+Do. The main effects of changes in k+Do on the tension responses are displayed in changes in the peak tension, resting tension, and the rate of tension rise, but the rate of relaxation changes only marginally in all cases and is about twofold slower than that observed. The superscript o is omitted from the figure axis label for clarity.
Figure S18.
Figure S18.
Changes in twitch tension predicted by the five-state model for change in k+H up to ±50% from those used in Fig. 3 (dark green line), denoted as orig. k+H. The main effect of changes in k+H on the tension responses are displayed in modest changes in the peak tension, resting tension, the rate of tension rise, and the rate of relaxation. For all values of k+H, the rate of relaxation is about twofold slower than that observed.
Figure S19.
Figure S19.
Changes in twitch tension predicted by the five-state model for change in kA up to 24-fold from those used in Fig. 3 (dark green line), denoted as orig. kAo. The main effect of changes in kAo on the tension responses are displayed as changes in the peak tension, resting tension, and the rate of tension rise. There are two distinctive regions in the peak and resting tensions: (1) the peak tensions modestly decrease for kAo increase up to twofold and resting tension decreases for kAo increase up to fourfold; and (2) for larger increases in kAo, the peak tension rapidly falls, and resting tension reaches very low levels. Similarly, the rate of tension relaxation increases for kAoincrease up to fourfold and then decreases. The superscript o is omitted from the figure axis label for clarity.
Figure S20.
Figure S20.
Changes in twitch tension at isometric half-sarcomere obtained from simulations with the five-state model. The tension transient predicted by the cross-bridge model without the PS, using parameters estimated by the best fit with the six-state model (Fig. 3 and Table 2 at 27.2°C) shows much higher peak tension and slow relaxation (black line). Increase of k+Do by 2.5-fold significantly decreased peak tension (dark green line) and, in addition, increase of kAo for ∼17-fold brings the peak tension to the observed level, significantly increasing the rate of the relaxation (green line), but it is still not sufficient to reach the observed rate (gray line). Further decreasing kAo decreased the peak tension and slowed the relaxation rate. The superscript o is omitted from the figure display for clarity.
Figure S21.
Figure S21.
Changes in twitch tension relaxation rates with increase predicted by the five-state model. The tension relaxation rate first increases to approach the observed values for kAo, up to ∼350 s−1 (green arrow), but with further increases of kAo, the relaxation rate starts to decrease (red arrow). At a lower value of k+Do (gray triangle), the relaxation rate is slightly higher but still short of reaching the observed rate value. The superscript o is omitted from the figure display for clarity.
Figure S22.
Figure S22.
The best fit to the observations with the five-state model requires the change in power stroke rate k+Pi (inset) in addition to changing kAo and k+Do. Effectively, a shift of k+Pi(x) for Δxo ∼0.5 increases the number of cross-bridges that can complete an ATPase cycle and enables faster relaxation. This change is achieved by an increase in k32cap while keeping the equilibrium rate KPi and the reverse power stroke rate unchanged (see Eq. A4). The superscript o is omitted from the figure display for clarity.
Figure S23.
Figure S23.
Effect of changes in baseline calcium level on resting and twitch tension. In all simulations with cross-bridge cycle without PS (i.e., five-state model), the calcium transient (dashed pink line) with baseline [Ca2+] levels was reduced from observed values of 0.143 µM to 0.05 µM. MUSICO simulations with the observed [Ca2+] transient (dark pink line) with the same model parameters as shown in Fig. S22 predicted significantly elevated resting tension, slightly higher peak tension, and slower tension relaxation rate (dark green line). After returning to low [Ca2+] levels (i.e., at time >0.4 s), tension remains about the same as the resting tension. For reference, the twitch tension response to [Ca2+] transients with reduced baseline [Ca2+] level is shown as a green line.
Figure S24.
Figure S24.
Comparison of tension–pCa relationships between the cross-bridge cycle models with or without PS (i.e., the six- and the five-state models). The simulations of tension–pCa relationships in fixed-length intact trabeculae with the six-state model (red line) agrees well with the experiments of (Gao et al., 1998; Janssen et al., 2002) at 22.5°C (symbols). The parameters used in these simulations are the same as those used in Fig. 7. The simulations of tension–pCa relationships in isometric half-sarcomeres with the five-state model (green line), using the parameters from the simulations that matched the observations (in Fig. S22), showed significantly higher sensitivity of tension at low levels of [Ca2+] (pCa > 6.6) and lower cooperativity (i.e., Hill coefficient) than observed. In contrast, the simulations with the six-state model (dashed cyan line) using the same parameters as those for simulations of twitch contractions of isometric half-sarcomeres at 27.2°C (Fig. 3) matched the observations and showed low levels of tension for pCa >6.6. Notably, the five-state model predicted about the same resting tension at [Ca2+] 0.143 µM (cyan-green arrow) as at the same baseline [Ca2+] shown in Fig. S23.
Figure 3.
Figure 3.
Significance of the PS in twitch relaxation phase. The simulations of a half-sarcomere isometric twitch with the five-state model showed slow relaxation (dark green line) compared with adjusted observations of Caremani et al. (2016) (dark gray line), even when the baseline [Ca2+] was reduced (pink dashed line, denoted as Corr. Baseline). The simulations also predicted high muscle tone at observed baseline [Ca2+] (not shown), similar to that shown by Prodanovic et al. (2020) at comparable low [Ca2+]. In contrast, the simulations with the six-state model, which includes the PS, significantly increased speed of relaxation (indicated by arrow) and the model predictions (red line) matching adjusted tensions observed by Caremani et al. (2016) (dark gray line). Note that the observed tension is adjusted to truly isometric conditions at a half-sarcomere by subtracting passive tension caused by sarcomere lengthening due to length control malfunction (for the details of how the adjustment is obtained, see Fig. S3). Force is shown as an average force per myosin filament (MyoFil). In all simulations (Sim.), we used the same model parameters as shown in Table 1, except k+Ao, kAo, and k+Do, which are presented in the text for the five-state model and in Table 2 for the six-state cross-bridge cycle. For comparison, mean force per myosin filament and corresponding (observed) muscle tension (Exp.) are shown on the vertical axes. For consistency in all plots, resting tension is subtracted; thus, the responses to calcium transient display net change in active tension.
Figure 4.
Figure 4.
The twitch in fixed-length trabecula is not isometric at the level of a sarcomere. Caremani et al. (2016) measured the tension–sarcomere displacement relationship during isometric twitch contraction of rat trabeculae. During twitch contraction, the tension rises and sarcomeres shorten, but during tension relaxation, sarcomeres lengthen. (A) The tension–displacement loop shows higher forces during sarcomere shortening and lower forces during sarcomere lengthening (orange circles). The arrows signify the direction of these changes. For simplicity, we derived a nonlinear serial springlike elasticity from average loop force–displacement relationship (thick gray line). (B) The difference of force (orange circles) from the mean (thick gray line) in A showed an approximately symmetric shape along the path of the loop. For comparison, the tension–displacement loop from Janssen and de Tombe, 1997 experiment is shown in Fig. S5.
Figure 5.
Figure 5.
The MUSICO simulation with the six-state model of twitch observed by Caremani et al. and Janssen and de Tombe. Related to Janssen and de Tombe, 1997; Caremani et al., 2016. (A) For the calcium transient observed by Janssen and de Tombe at 22°C (pink solid line), the MUSICO simulations (green solid lines) fitted well the observed force transient (red line). (B) A similar observation was made for the calcium transient observed by Janssen et al. at 27.5°C (pink solid line). The simulations (green solid lines) followed the tension transient observed by Caremani et al. (2016), at 27.2°C (red line). Both simulations also fitted well the shortening during rising tension phase (i.e., decrease in HS length, denoted as Displ.); however, during tension relaxation, the half-sarcomere lengthening is faster than observed. To achieve good fits for the transients at different temperatures (22°C versus 27.2°C) and with fixed and variable SLs, the cross-bridge rates k+Ao and kAo should be adjusted accordingly (see Table 2). The difference in tension axes between Janssen and de Tombe, 1997; Caremani et al., 2016, denoted as blue and green numbers, respectively, are a consequence of assessment of nominal cross-sectional area at different SLs that strongly affect the conversion factor between force per myosin filament in piconewtons and tension in kilopascals (see Appendix E).
Figure 6.
Figure 6.
The effect of temperature on twitch transients. (A) The MUSICO simulation with the six-state model (green lines) matched well the force responses (red lines) at 22.5°C, 27.5°C, and 30°C (Janssen et al., 2002). The rise of temperature increased peak [Ca2+] and relaxed [Ca2+] faster (pink lines). The tension transients showed faster rise times, modest increase in peak force, and a fast relaxation phase, reflecting the changes in patterns of calcium transients with the increase of temperature. The arrows signify these trends with increase of temperature. In addition, the good match of the experimental observations required increase in binding and ADP release rates with increasing temperature (Table 2). (B) The same data plotted as force or tension versus [Ca2+] (in μM) following the observations of Janssen et al. (2002).
Figure 7.
Figure 7.
Increase in calcium sensitivity in intact muscle normalized tension–pCa relationships deduced from the twitch simulations versus those observed in intact and demembranated muscles. MUSICO simulations of the tension–pCa relationships matched the observations in intact muscles by Gao et al. (1994) and Janssen et al. (2002). The muscle tension is normalized by maximum tension at fully activated muscle (T/Tmax). The parameters for MUSICO simulations are the same as in twitch simulations at 22.5°C shown in Fig. 6. However, the sensitivity in intact muscles was significantly higher than in demembranated (Demem.) muscles. The experiments performed on the same muscle before and after demembranation showed a somewhat smaller increase in the muscle sensitivity (gray arrow) than between Kreutziger et al. (2011) demembranated muscle (red arrow). Interestingly, the intact muscle tension–pCa relationships show only small differences between the Gao et al. (1994) and Janssen et al. (2002) observations. Change in [Mg2+] from 1.2 mM (gray dashed line) to the physiological value of 0.5 mM increased calcium sensitivity (green dotted line) toward that observed in intact trabeculae (green arrows; Gao et al., 1994).

References

    1. Ait-Mou, Y., Hsu K., Farman G.P., Kumar M., Greaser M.L., Irving T.C., and de Tombe P.P.. 2016. Titin strain contributes to the Frank-Starling law of the heart by structural rearrangements of both thin- and thick-filament proteins. Proc. Natl. Acad. Sci. USA. 113:2306–2311. 10.1073/pnas.1516732113 - DOI - PMC - PubMed
    1. Anderson, R.L., Trivedi D.V., Sarkar S.S., Henze M., Ma W., Gong H., Rogers C.S., Gorham J.M., Wong F.L., Morck M.M., et al. . 2018. Deciphering the super relaxed state of human β-cardiac myosin and the mode of action of mavacamten from myosin molecules to muscle fibers. Proc. Natl. Acad. Sci. USA. 115:E8143–E8152. 10.1073/pnas.1809540115 - DOI - PMC - PubMed
    1. Backx, P.H., and Ter Keurs H.E.. 1993. Fluorescent properties of rat cardiac trabeculae microinjected with fura-2 salt. Am. J. Physiol. 264:H1098–H1110. - PubMed
    1. Backx, P.H., Gao W.D., Azan-Backx M.D., and Marban E.. 1995. The relationship between contractile force and intracellular [Ca2+] in intact rat cardiac trabeculae. J. Gen. Physiol. 105:1–19. 10.1085/jgp.105.1.1 - DOI - PMC - PubMed
    1. Barth, E., Stämmler G., Speiser B., and Schaper J.. 1992. Ultrastructural quantitation of mitochondria and myofilaments in cardiac muscle from 10 different animal species including man. J. Mol. Cell. Cardiol. 24:669–681. 10.1016/0022-2828(92)93381-S - DOI - PubMed

Publication types