. 2021 Mar 1;218(3):e20201795.
doi: 10.1084/jem.20201795.

Diagnostic blood RNA profiles for human acute spinal cord injury

Affiliations

Diagnostic blood RNA profiles for human acute spinal cord injury

Nikos Kyritsis et al. J Exp Med. .

Abstract

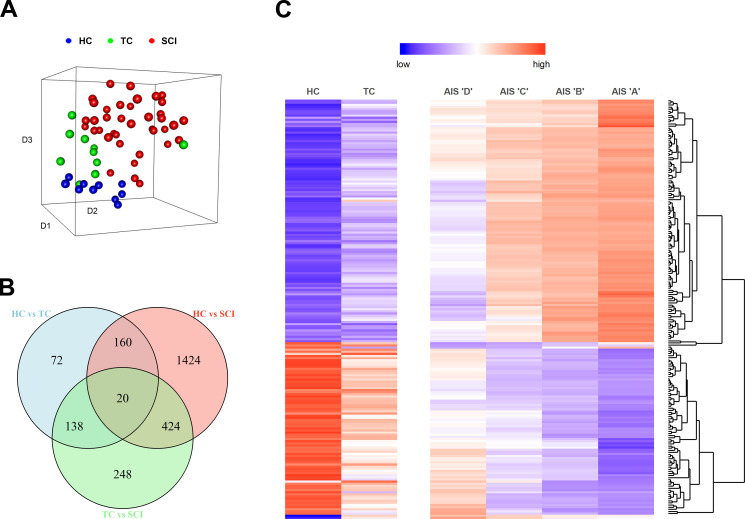
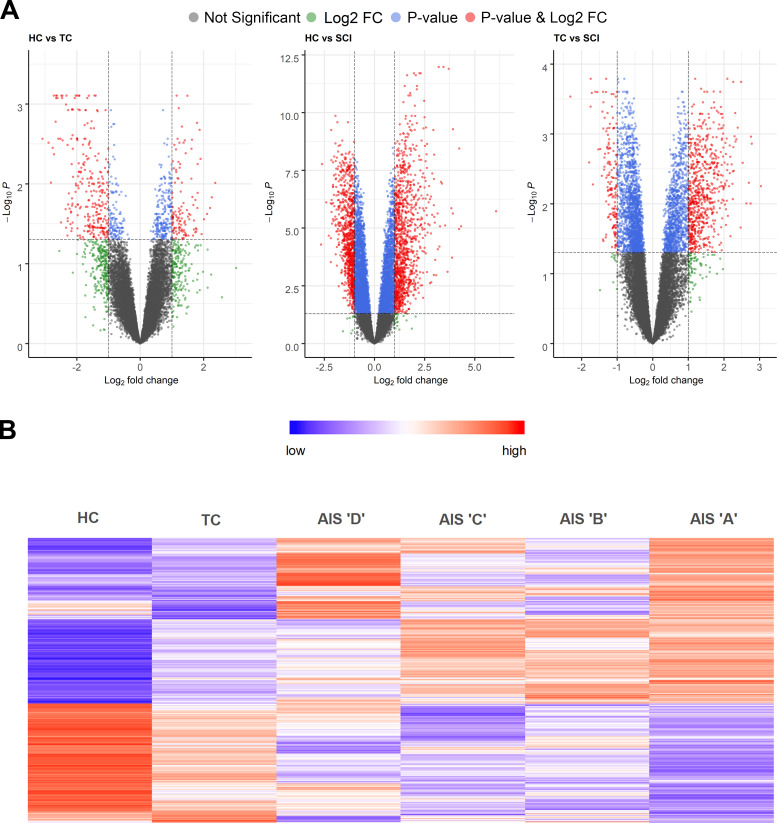
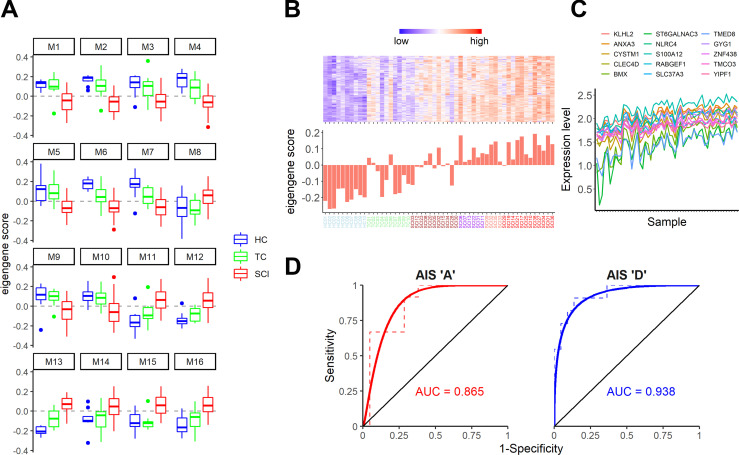
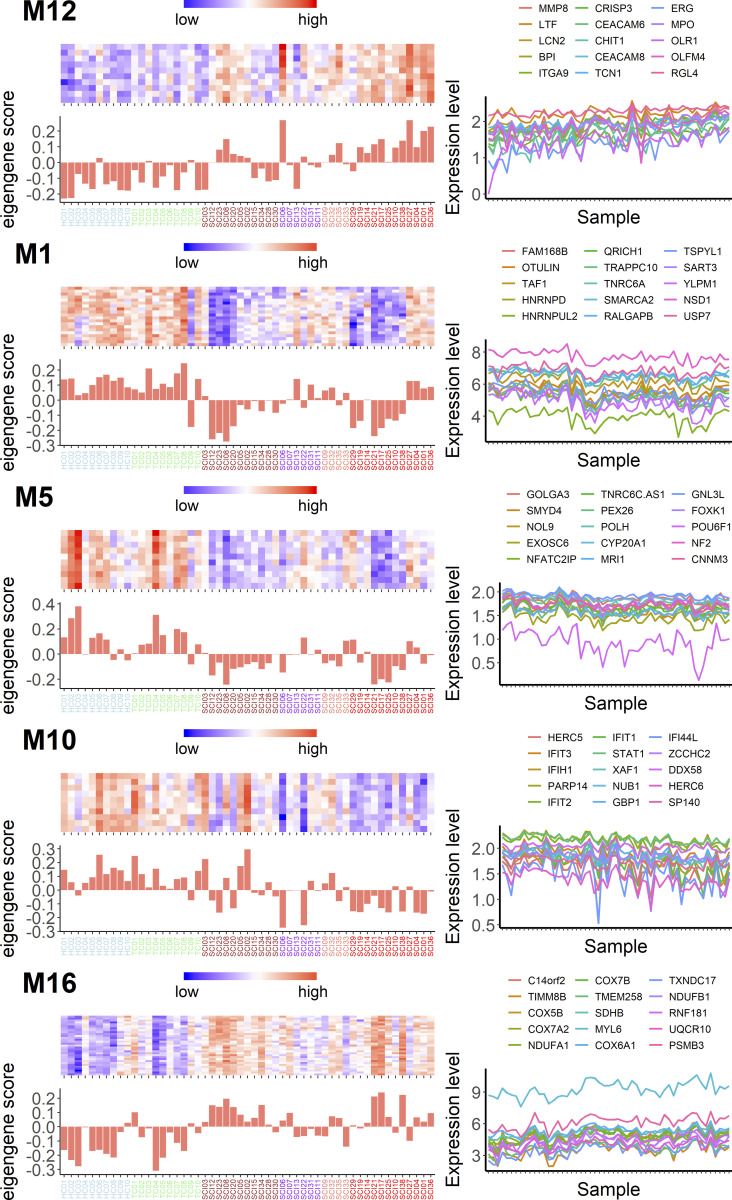
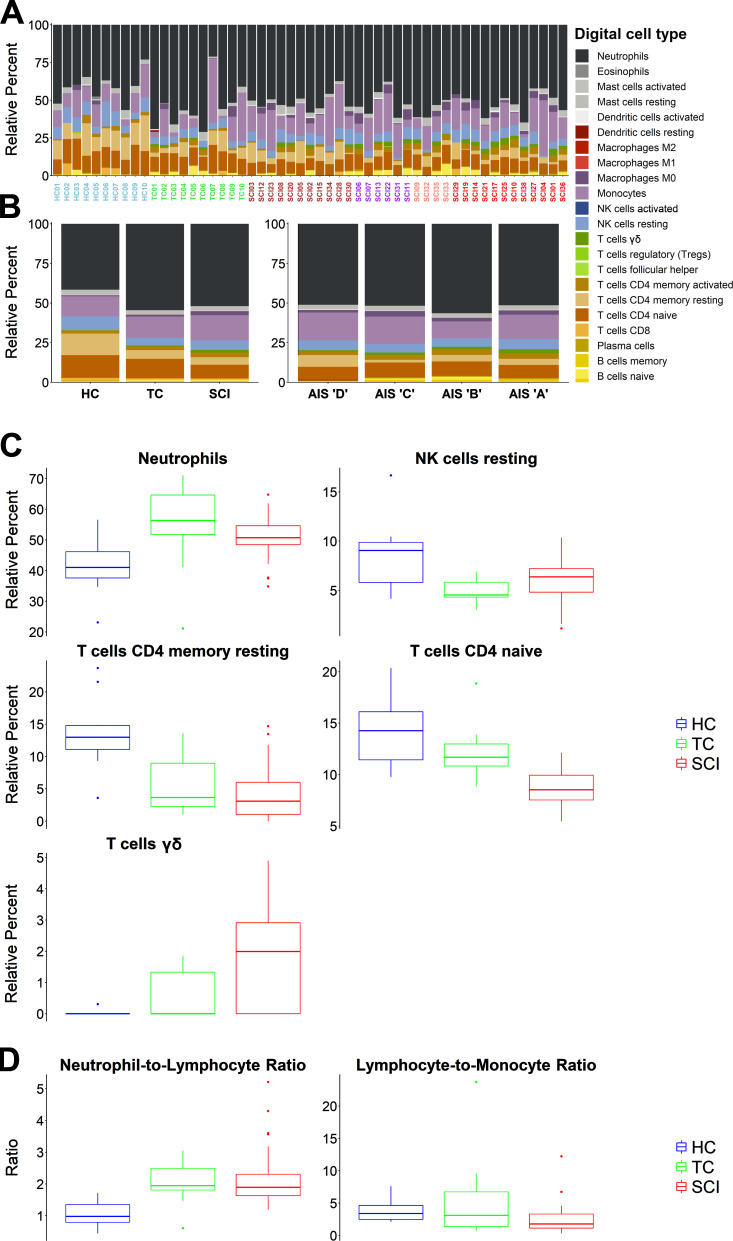
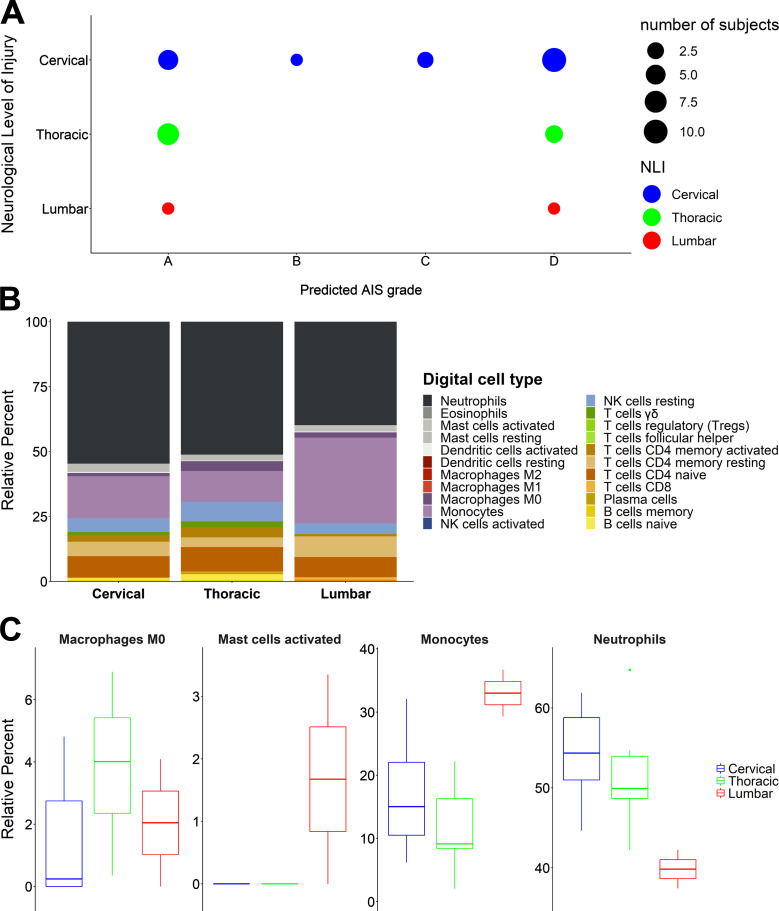
Diagnosis of spinal cord injury (SCI) severity at the ultra-acute stage is of great importance for emergency clinical care of patients as well as for potential enrollment into clinical trials. The lack of a diagnostic biomarker for SCI has played a major role in the poor results of clinical trials. We analyzed global gene expression in peripheral white blood cells during the acute injury phase and identified 197 genes whose expression changed after SCI compared with healthy and trauma controls and in direct relation to SCI severity. Unsupervised coexpression network analysis identified several gene modules that predicted injury severity (AIS grades) with an overall accuracy of 72.7% and included signatures of immune cell subtypes. Specifically, for complete SCIs (AIS A), ROC analysis showed impressive specificity and sensitivity (AUC: 0.865). Similar precision was also shown for AIS D SCIs (AUC: 0.938). Our findings indicate that global transcriptomic changes in peripheral blood cells have diagnostic and potentially prognostic value for SCI severity.


Conflict of interest statement

Disclosures: G.T. Manley reported grants from NIH-NINDS and grants from United States Department of Defense during the conduct of the study. S. Dhall reported personal fees from Depuy Synthes, personal fees from Globus Medical, and other from Great Circle Technologies outside the submitted work. M.S. Beattie reported that he is on the board of directors of two nonprofits that support spinal cord injury research, the American Spinal Injury Association and the Praxis Spinal Cord Institute. Only travel expenses are reimbursed. No other disclosures were reported.

Figures

Figure S1.
Figure S1.
Flowchart of patient enrollment, data acquisition, and analytic pipeline. In TRACK-SCI, as soon as a confirmed SCI patient is admitted and consents to participate in the study, our team collects clinical data during all stages of the hospital stay and at 3, 6, and 12 mo after injury (in total >22,000 data points for each patient). Blood is also collected as early as possible after hospital admission (day 0) and at days 1, 2, 3, and 5 as well as at 6 and 12 mo after injury. After the blood draw, WBCs are isolated, and RNA is extracted for RNA-seq. The RNA-seq data from SCI patients along with RNA-seq data from HCs and TCs are analyzed using both supervised and unsupervised methods with the goal of creating a predictive model for injury severity. ED, emergency department; ICU, intensive care unit; Moberg, data collected from the Moberg ICU device; MRI, magnetic resonance imaging; NQoL, quality of life in neurological diseases; OR, operating room; ZSFG, Zuckerberg San Francisco General Hospital and Trauma Center.
Figure 1.
Figure 1.
SCI induces transcriptomic changes in WBCs compared with healthy and non-CNS TCs. (A) three-dimensional T-distributed stochastic neighbor embedding plot. Each point on the plot represents one patient. The gene expression values of 17,500 transcripts were used in a principal component analysis, and the components that account for 90% of the variance were collapsed in the three dimensions of the T-distributed stochastic neighbor embedding plot. The three groups (HC, TC, and SCI) occupy different locations in the three-dimensional space, indicating that the transcriptomic signature alone is sufficient to separate them (HC = 10, TC = 10, SCI = 38). (B) Differential gene expression analysis. The Venn diagram shows the intersection between differentially expressed genes for all three comparisons between HC, TC, and SCI patients (fold-change >2, adjusted P value < 0.05). (C) From the Venn diagram, we selected the genes that are only significantly changed after SCI and not in the event of trauma (1,424 + 424 + 248 = 2,096). Out of those 2,096 genes, 197 exhibit changes according to the AIS grade. The heatmap shows the expression pattern of these 197 genes. The genes were selected based on their expression only in the SCI group, but the heatmap includes the levels of these genes also in HCs and TCs. The upper part shows 117 genes whose expression increases as SCI severity increases, and the bottom part shows 80 genes whose expression decreases as SCI severity increases (HC = 10, TC = 10, AIS D = 11, C = 6, B = 4, A = 12; AIS grade evaluated between 3 and 10 d after SCI, and five patients did not receive an examination during that timeframe).
Figure S2.
Figure S2.
Differential gene expression analysis of SCI patients vs. healthy and TCs reveals many genes induced specifically upon SCI. (A) Volcano plots of the three comparisons between HCs, TCs, and SCI patients. (B) Heatmap of the 2,096 differentially expressed genes after SCI but not trauma (fold-change [FC] >2, adjusted P value <0.05; HC = 10, TC = 10, AIS D = 11, C = 6, B = 4, A = 12).
Figure S3.
Figure S3.
GO enrichment analysis of the SCI severity–dependent genes suggests an important role of inflammation and cellular transport and localization in classifying SCI patients. (A) Visualization of the enriched GOs of the genes that increase their expression as the AIS grade increases. The bubble color shading indicates the P values (stronger shading = lower P value) and the bubble size the frequency of the GO in the underlying GO Annotation database. The lines link highly similar GO terms and the width of the line indicates the degree of similarity. (B) The bar plot shows the number of differentially expressed genes in each one of the significant GO terms. The shade of each bar indicates the P value (stronger shading = lower P value).
Figure 2.
Figure 2.
Gene coexpression network analysis reveals transcriptional modules in peripheral WBCs that predict SCI severity. (A) Analysis of module eigengene (PC1) scores by patient cohort reveals 16 SCI-specific gene coexpression modules following unsupervised gene coexpression network analysis (one-way ANOVA, adjusted P value <0.05, Tukey’s P value < 0.05 for each comparison). Some modules (e.g., M4) display a gradual change in gene expression, whereas in others (e.g., M1, M5), HCs and TCs are very similar to each other but different from SCIs. n = 10 for HCs and TCs and 38 for SCIs. (B and C) The M13 module has the highest correlation to SCI severity (Spearman ρ = 0.82). In B is the heatmap of the top-seeded genes for this module (top), and the eigengene score for each one of the patients and controls (bottom). The graph in C shows the expression levels of the top 15 genes of the M13 module across all 58 samples. As expected from the analysis, these top genes of the module exhibit a strong coexpression pattern. (D) Receiver operating characteristic plots for the AIS A against the remaining SCIs (left) and the AIS D against the remaining SCIs (right). These plots show the strong predictive ability of our model for SCI patients with AIS A and D. The area under the curve (AUC) is 0.865 for A and 0.938 for D. n = 12 A vs. 21 SCIs and 11 D vs. 22 SCIs (color scheme in x-axis labels in B is as follows: blue = HC, green = TC, brown = AIS D, purple = AIS C, salmon = AIS B, and red = AIS A).
Figure 3.
Figure 3.
Multinomial logistic regression identifies specific gene modules with the capacity to accurately predict AIS A and AIS D SCI patients. For AIS A SCI patients, one gene module (M12) is sufficient to predict the injury class with 83.3% accuracy. Interestingly, five gene modules (M13 in Fig. 2, B and C; M1, M5, M10, and M16) are required to predict AIS D SCI patients with an impressive 90.9% accuracy. For each one of the modules in this figure, on the left is a heatmap with the top-seeded genes for the module and the eigengene score for each patient (and control); on the right are the expression patterns (in arbitrary units) of the top 15 genes with the highest correlation to each module eigengene (color scheme in x-axis labels is as follows: blue = HC, green = TC, brown = AIS D, purple = AIS C, salmon = AIS B, and red = AIS A).
Figure 4.
Figure 4.
Digital cytometry using CIBERSORTx measures relative abundance of 22 distinct leukocyte subtypes in SCI and control patients. We used a recently created machine learning algorithm (CIBERSORTx) that uses deconvolution methods to infer cell type proportions based only on gene expression patterns. We cross-referenced the transcriptomes of all SCI patients and controls with the leukocyte gene signature matrix (LM22; Newman et al., 2015) and estimated relative abundances for 22 leukocyte subtypes. (A) The stacked bar plots show the relative abundance of the 22 digital cell types for each of the SCI patients and controls. (B) Left shows group averages, and right shows AIS grade averages. (C) One-way ANOVA for each digital cell type showed statistically significant differences for neutrophils, resting NK cells, CD4 resting T cells, CD4 naive T cells, and γδ T cells with adjusted P values <0.05. Tukey’s test showed that for CD4 naive and γδ T cells, the SCI group is significantly different from both control groups. No statistically significant difference was identified among AIS grades. (D) The neutrophil-to-lymphocyte and lymphocyte-to-monocyte ratios (calculated from the CIBERSORTx data) show differences between HCs, TCs, and SCIs (one-way ANOVA, P value < 0.05; color scheme in x-axis labels in A are as follows: blue = HC, green = TC, brown = AIS D, purple = AIS C, salmon = AIS B, and red = AIS A).
Figure 5.
Figure 5.
NLI is correlated with a differential immunological response after SCI. (A) The distribution of the NLI levels across the predicted AIS grades does not show a pattern that would suggest a strong effect on the predictability of the model. (B) CIBERSORTx data aggregated per NLI. The stacked bar plots show the differential immune response for each NLI level. (C) One-way ANOVA for each digital cell type from B showed that several cell types displayed a statistically significant differential response per NLI. The four cell types presented here are the ones remaining significant (P < 0.05) after Benjamini–Hochberg multiple testing correction (cervical = 18, thoracic = 10, lumbar = 2).

References

    1. Adler, D., and Murdoch D.. 2019. rgl: 3D Visualization Using OpenGL. R package version 0.100.30. https://CRAN.R-project.org/package=rgl
    1. Andrews, S. 2010. FastQC: a quality control tool for high throughput sequence data. http://www.bioinformatics.babraham.ac.uk/projects/fastqc
    1. Biering-Sørensen, F., Alai S., Anderson K., Charlifue S., Chen Y., DeVivo M., Flanders A.E., Jones L., Kleitman N., Lans A., et al. . 2015. Common data elements for spinal cord injury clinical research: a National Institute for Neurological Disorders and Stroke project. Spinal Cord. 53:265–277. 10.1038/sc.2014.246 - DOI - PMC - PubMed
    1. Blighe, K. 2019a. EnhancedVolcano: Publication-ready volcano plots with enhanced colouring and labeling. R package version 1.2.0. https://github.com/kevinblighe/EnhancedVolcano
    1. Blighe, K. 2019b. PCAtools: PCAtools: Everything Principal Components Analysis. R package version 1.1.10. https://github.com/kevinblighe/PCAtools

Publication types