. 2021 Jun 17;137(24):3351-3364.
doi: 10.1182/blood.2020007452.

Impaired ribosome biogenesis checkpoint activation induces p53-dependent MCL-1 degradation and MYC-driven lymphoma death

Affiliations

Impaired ribosome biogenesis checkpoint activation induces p53-dependent MCL-1 degradation and MYC-driven lymphoma death

Ana Domostegui et al. Blood. .

Abstract

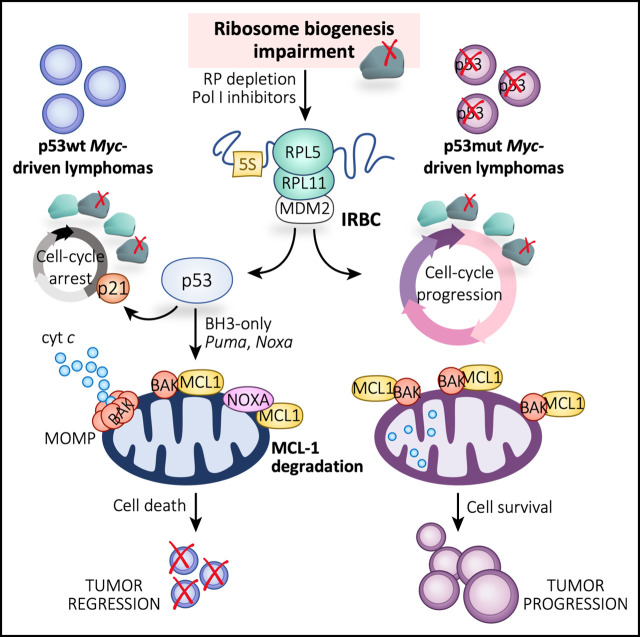
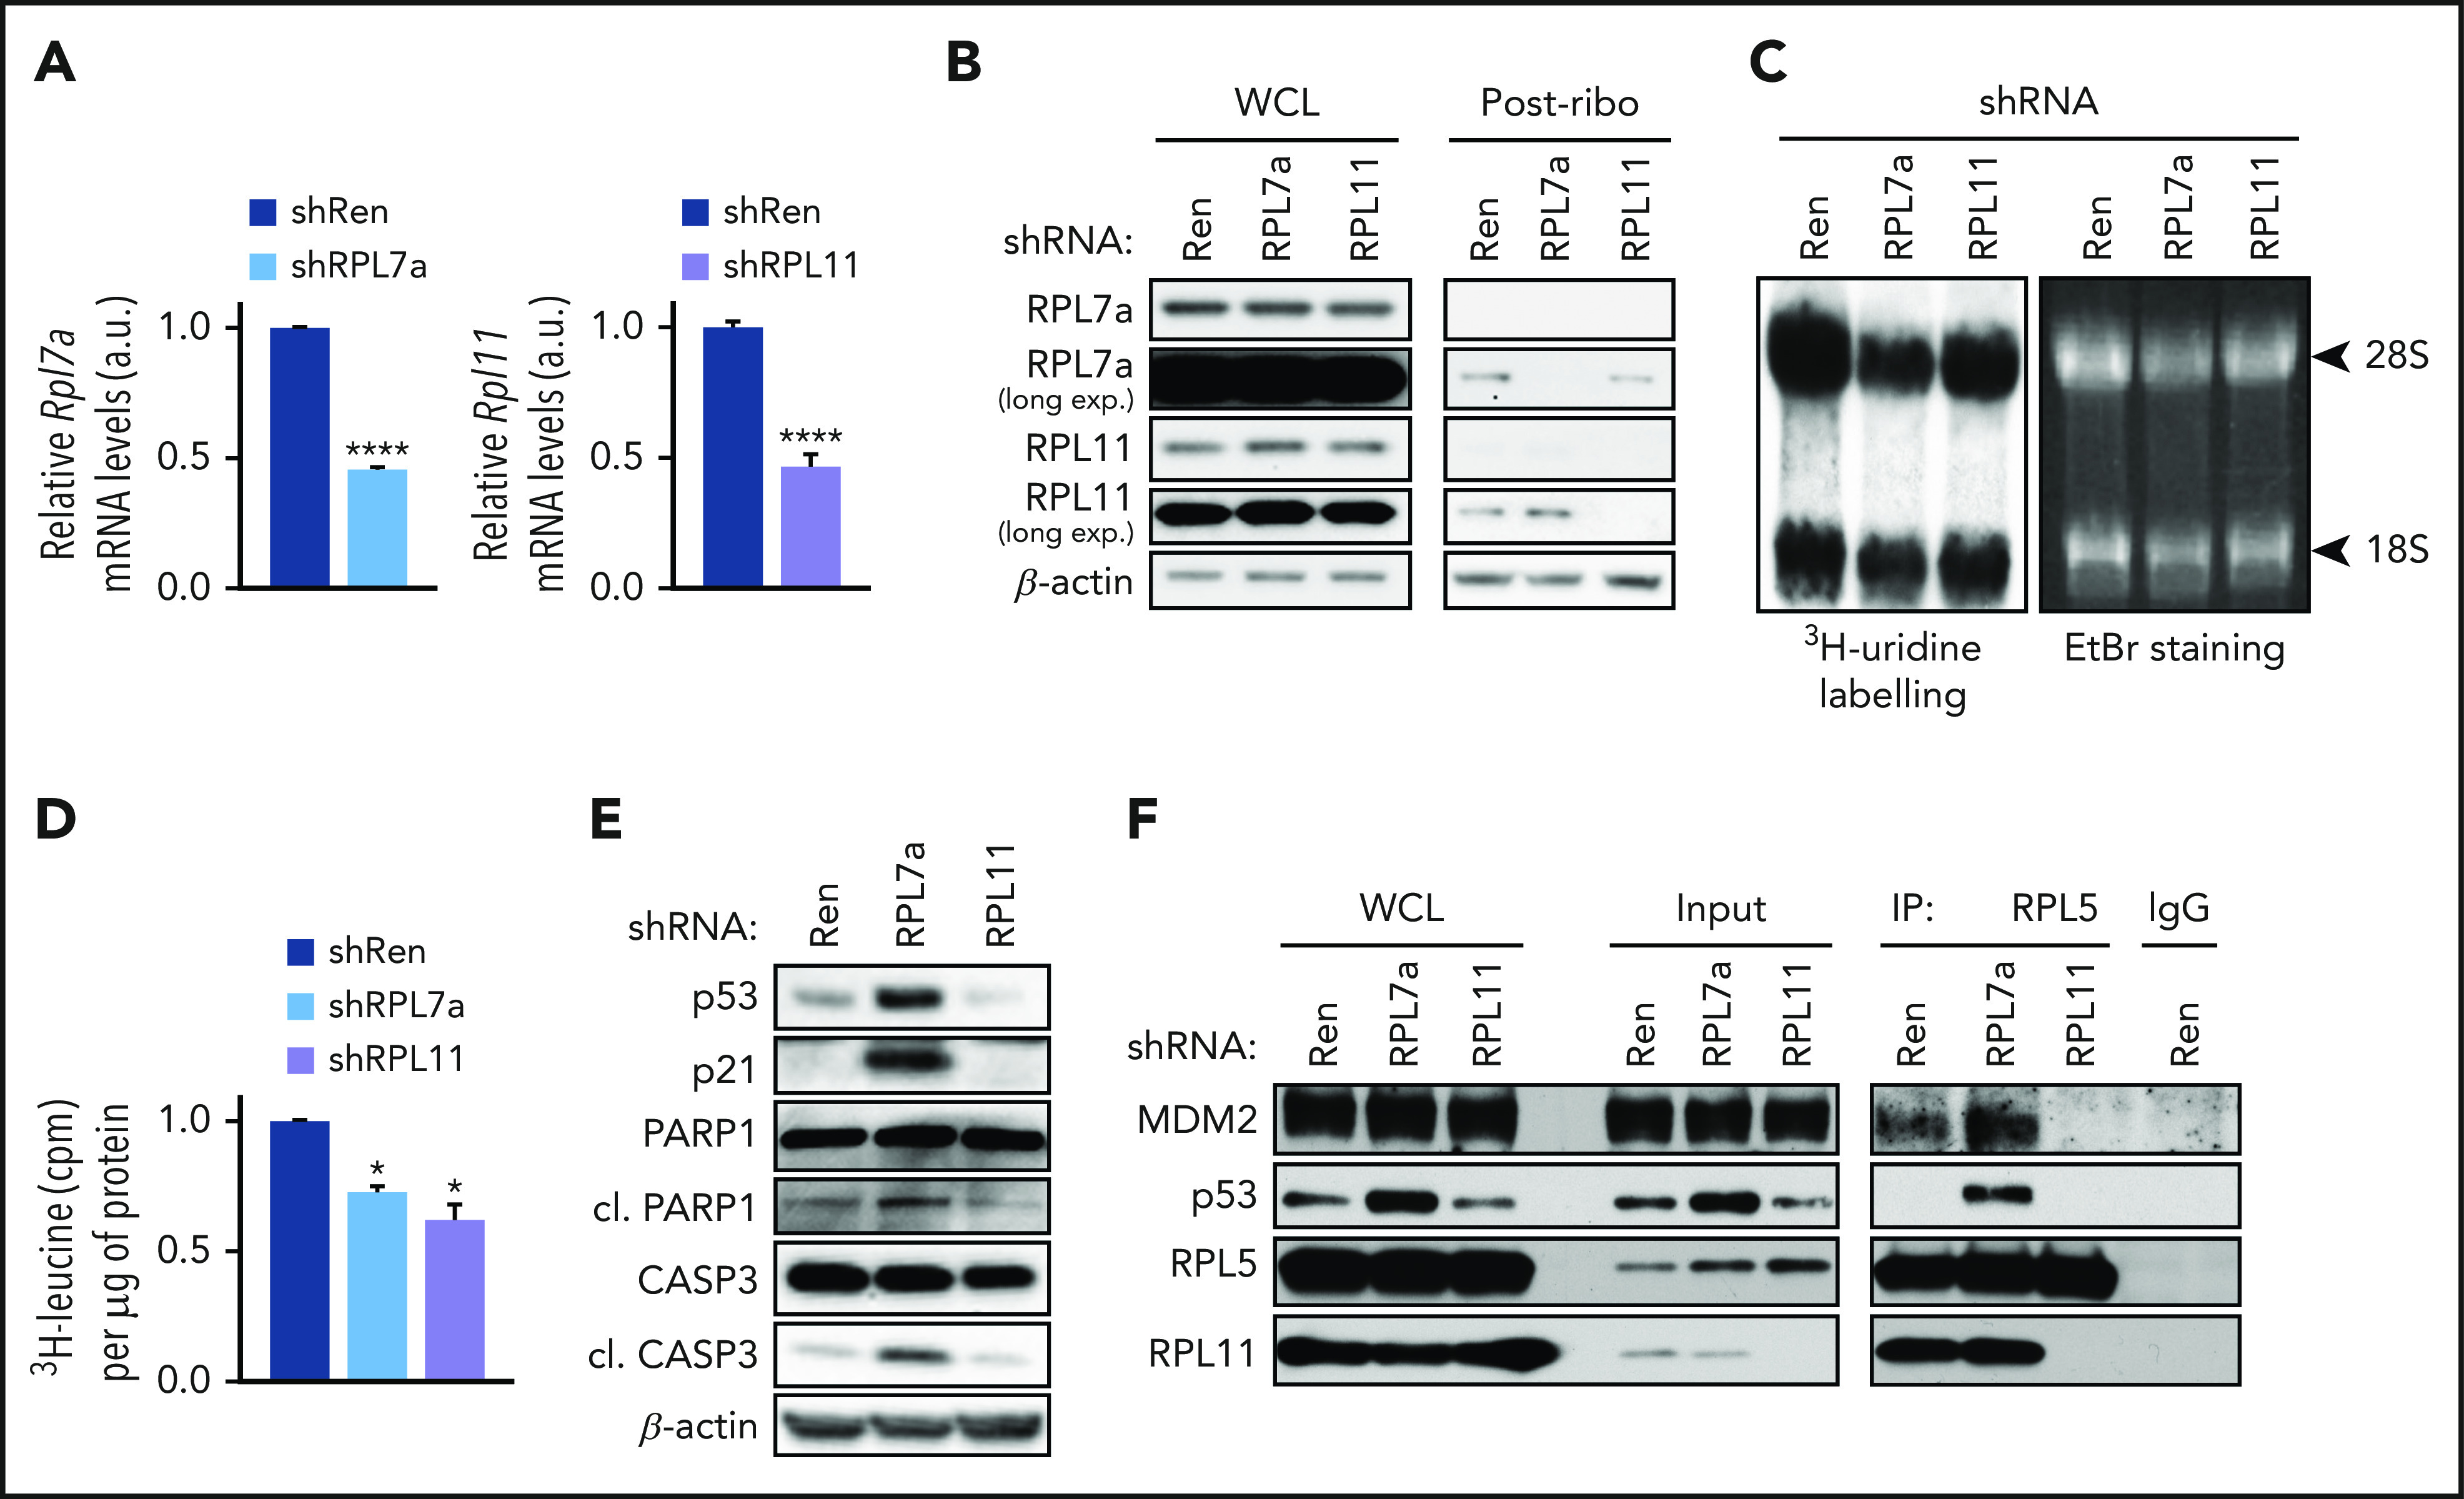
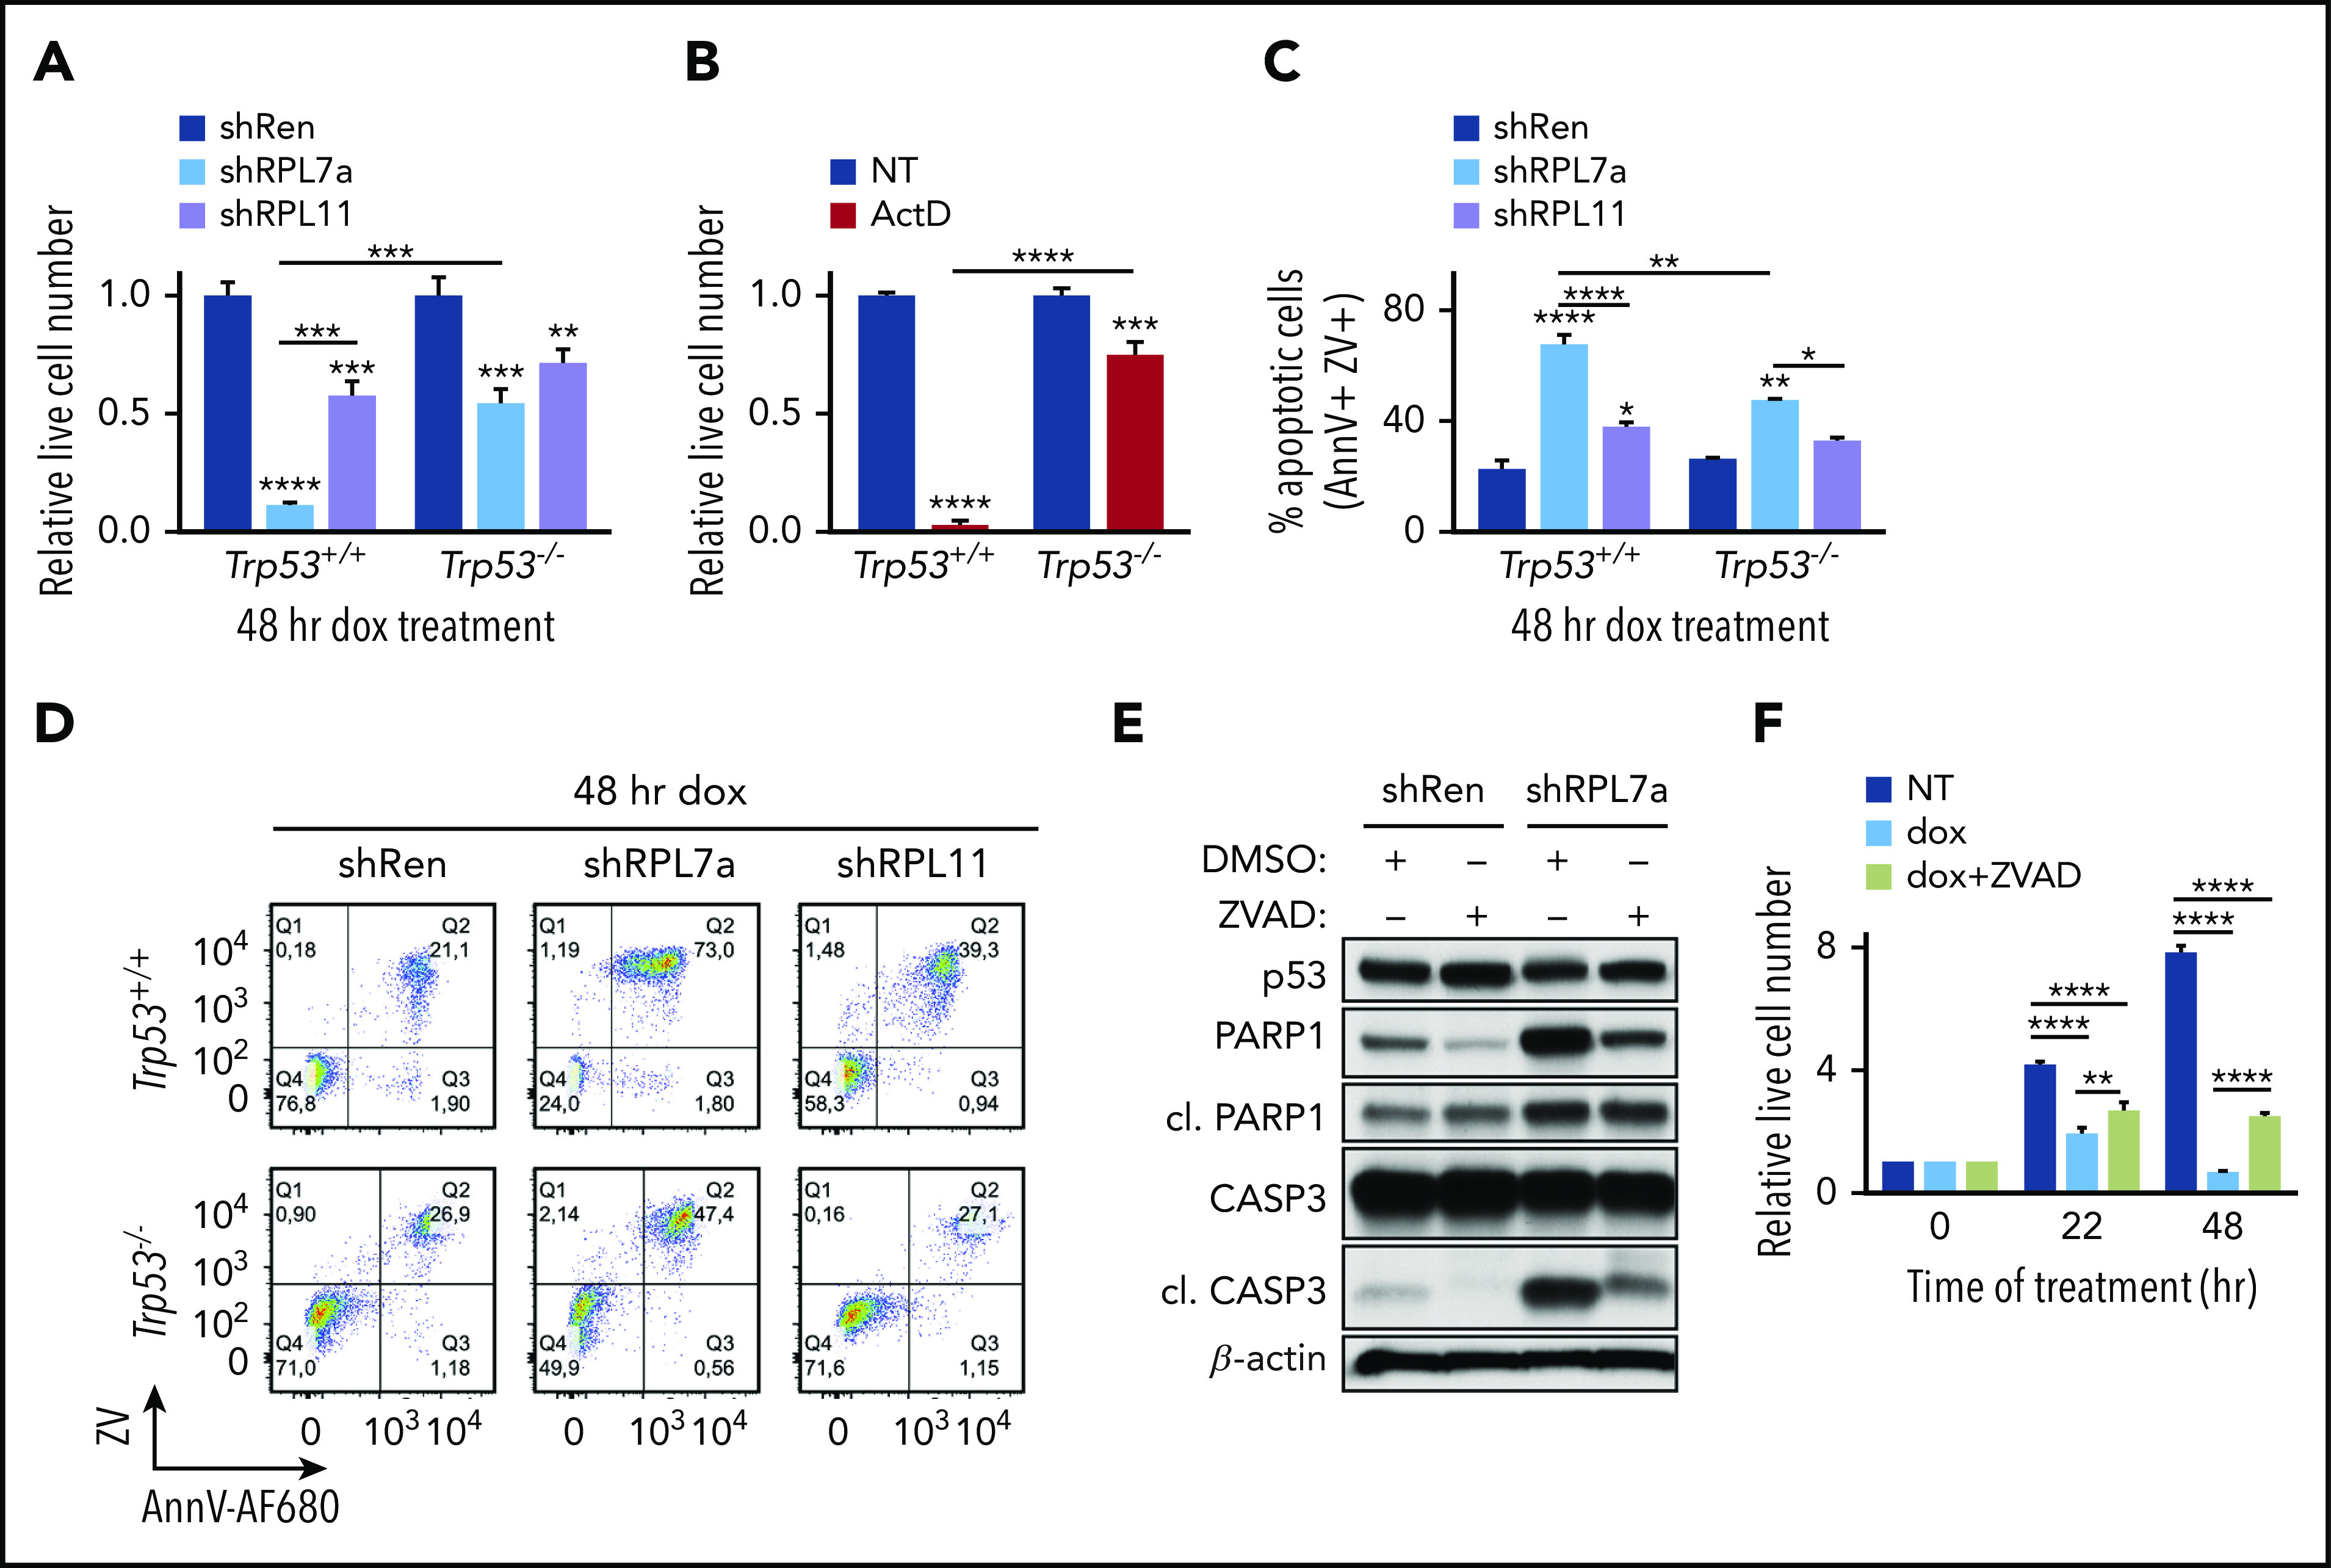
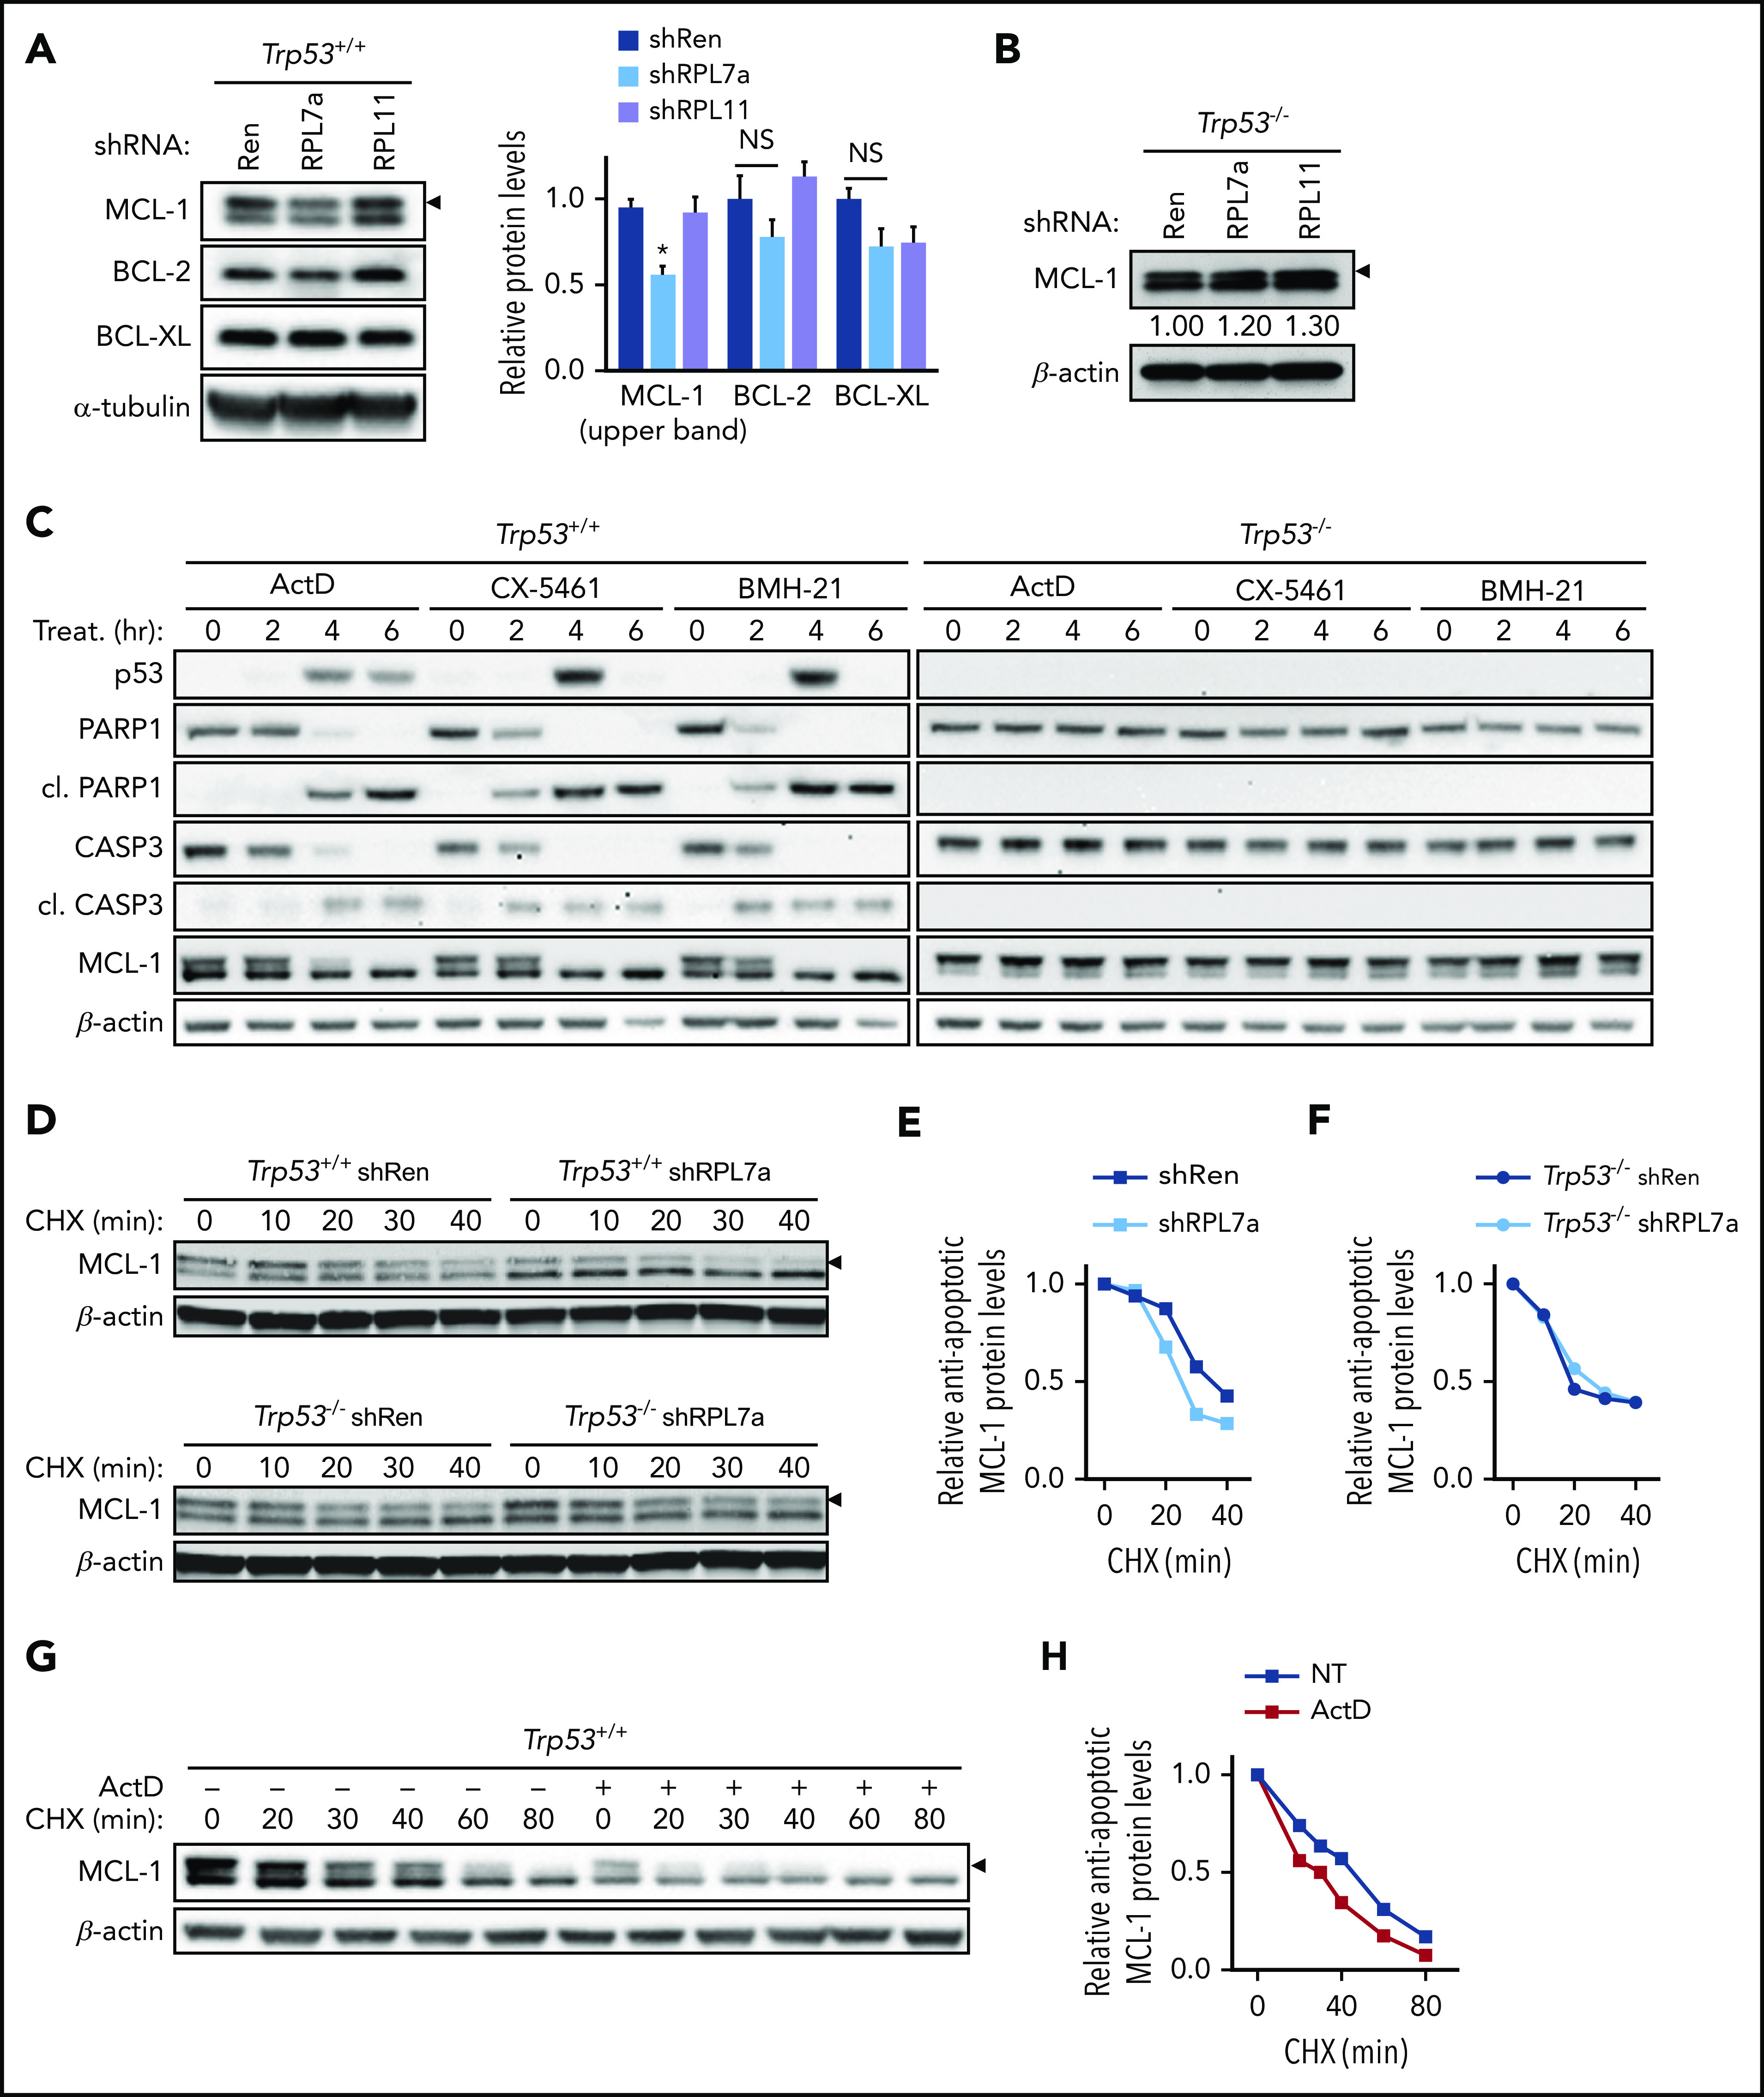
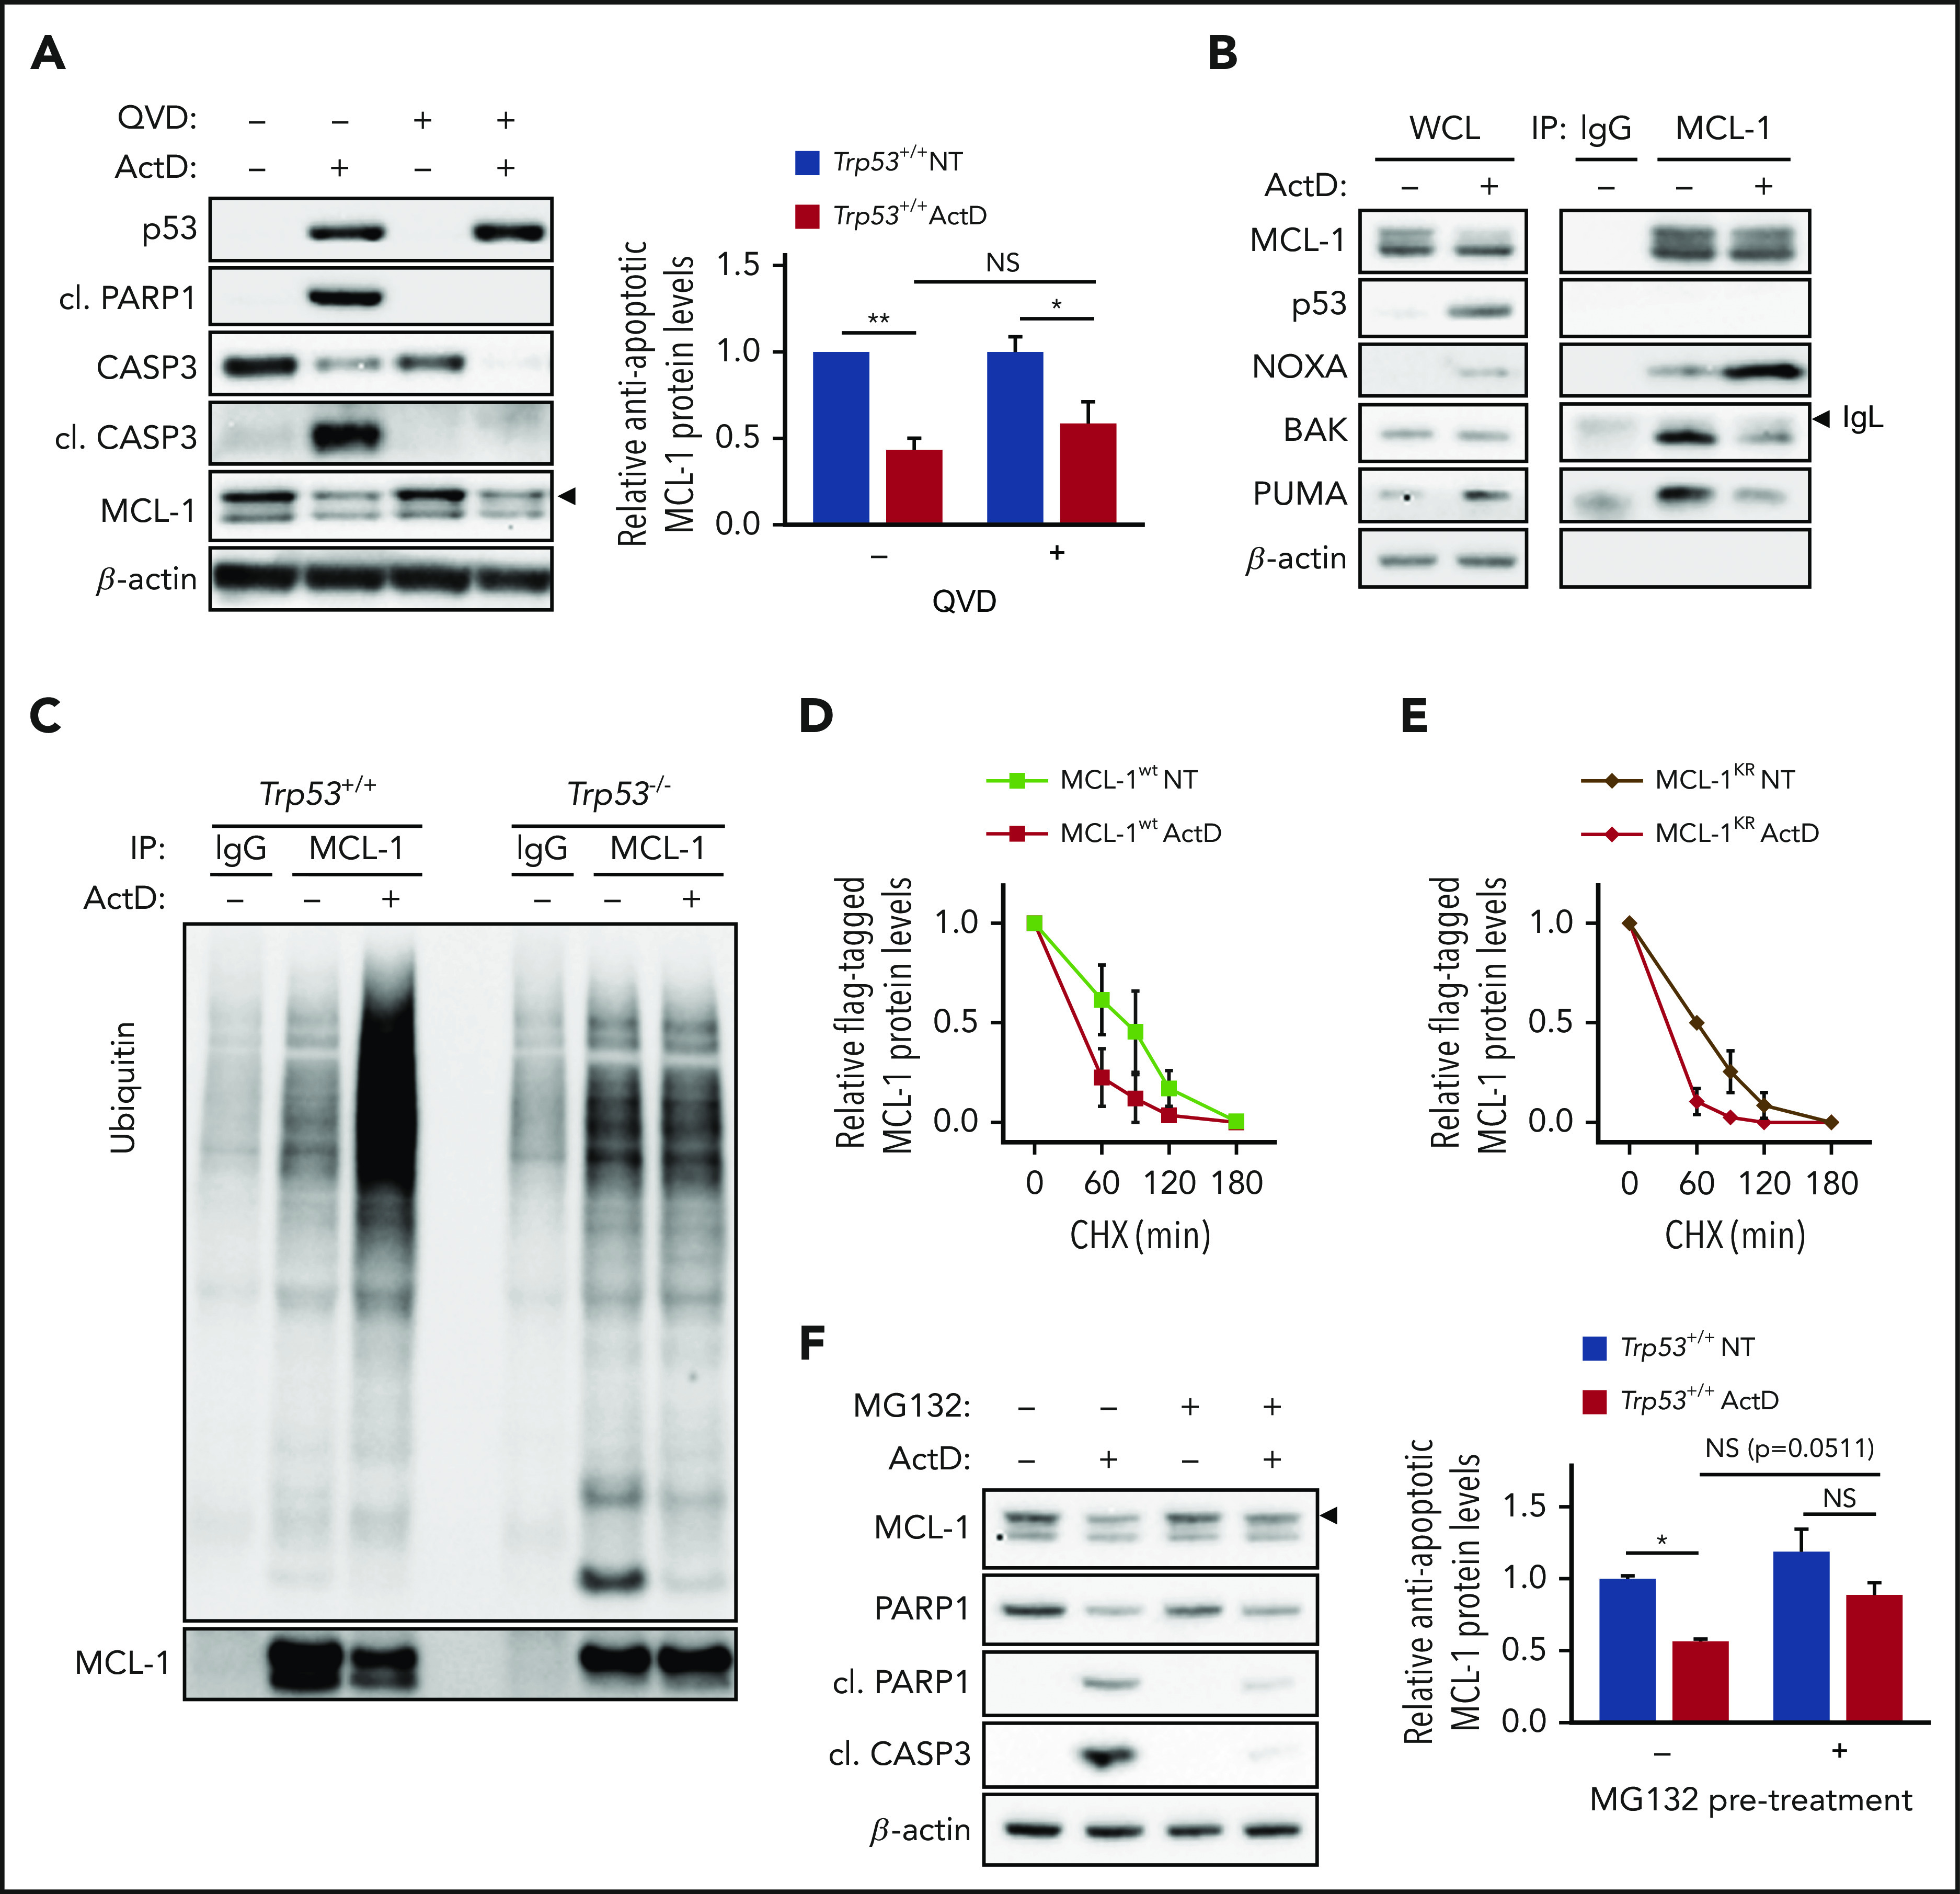
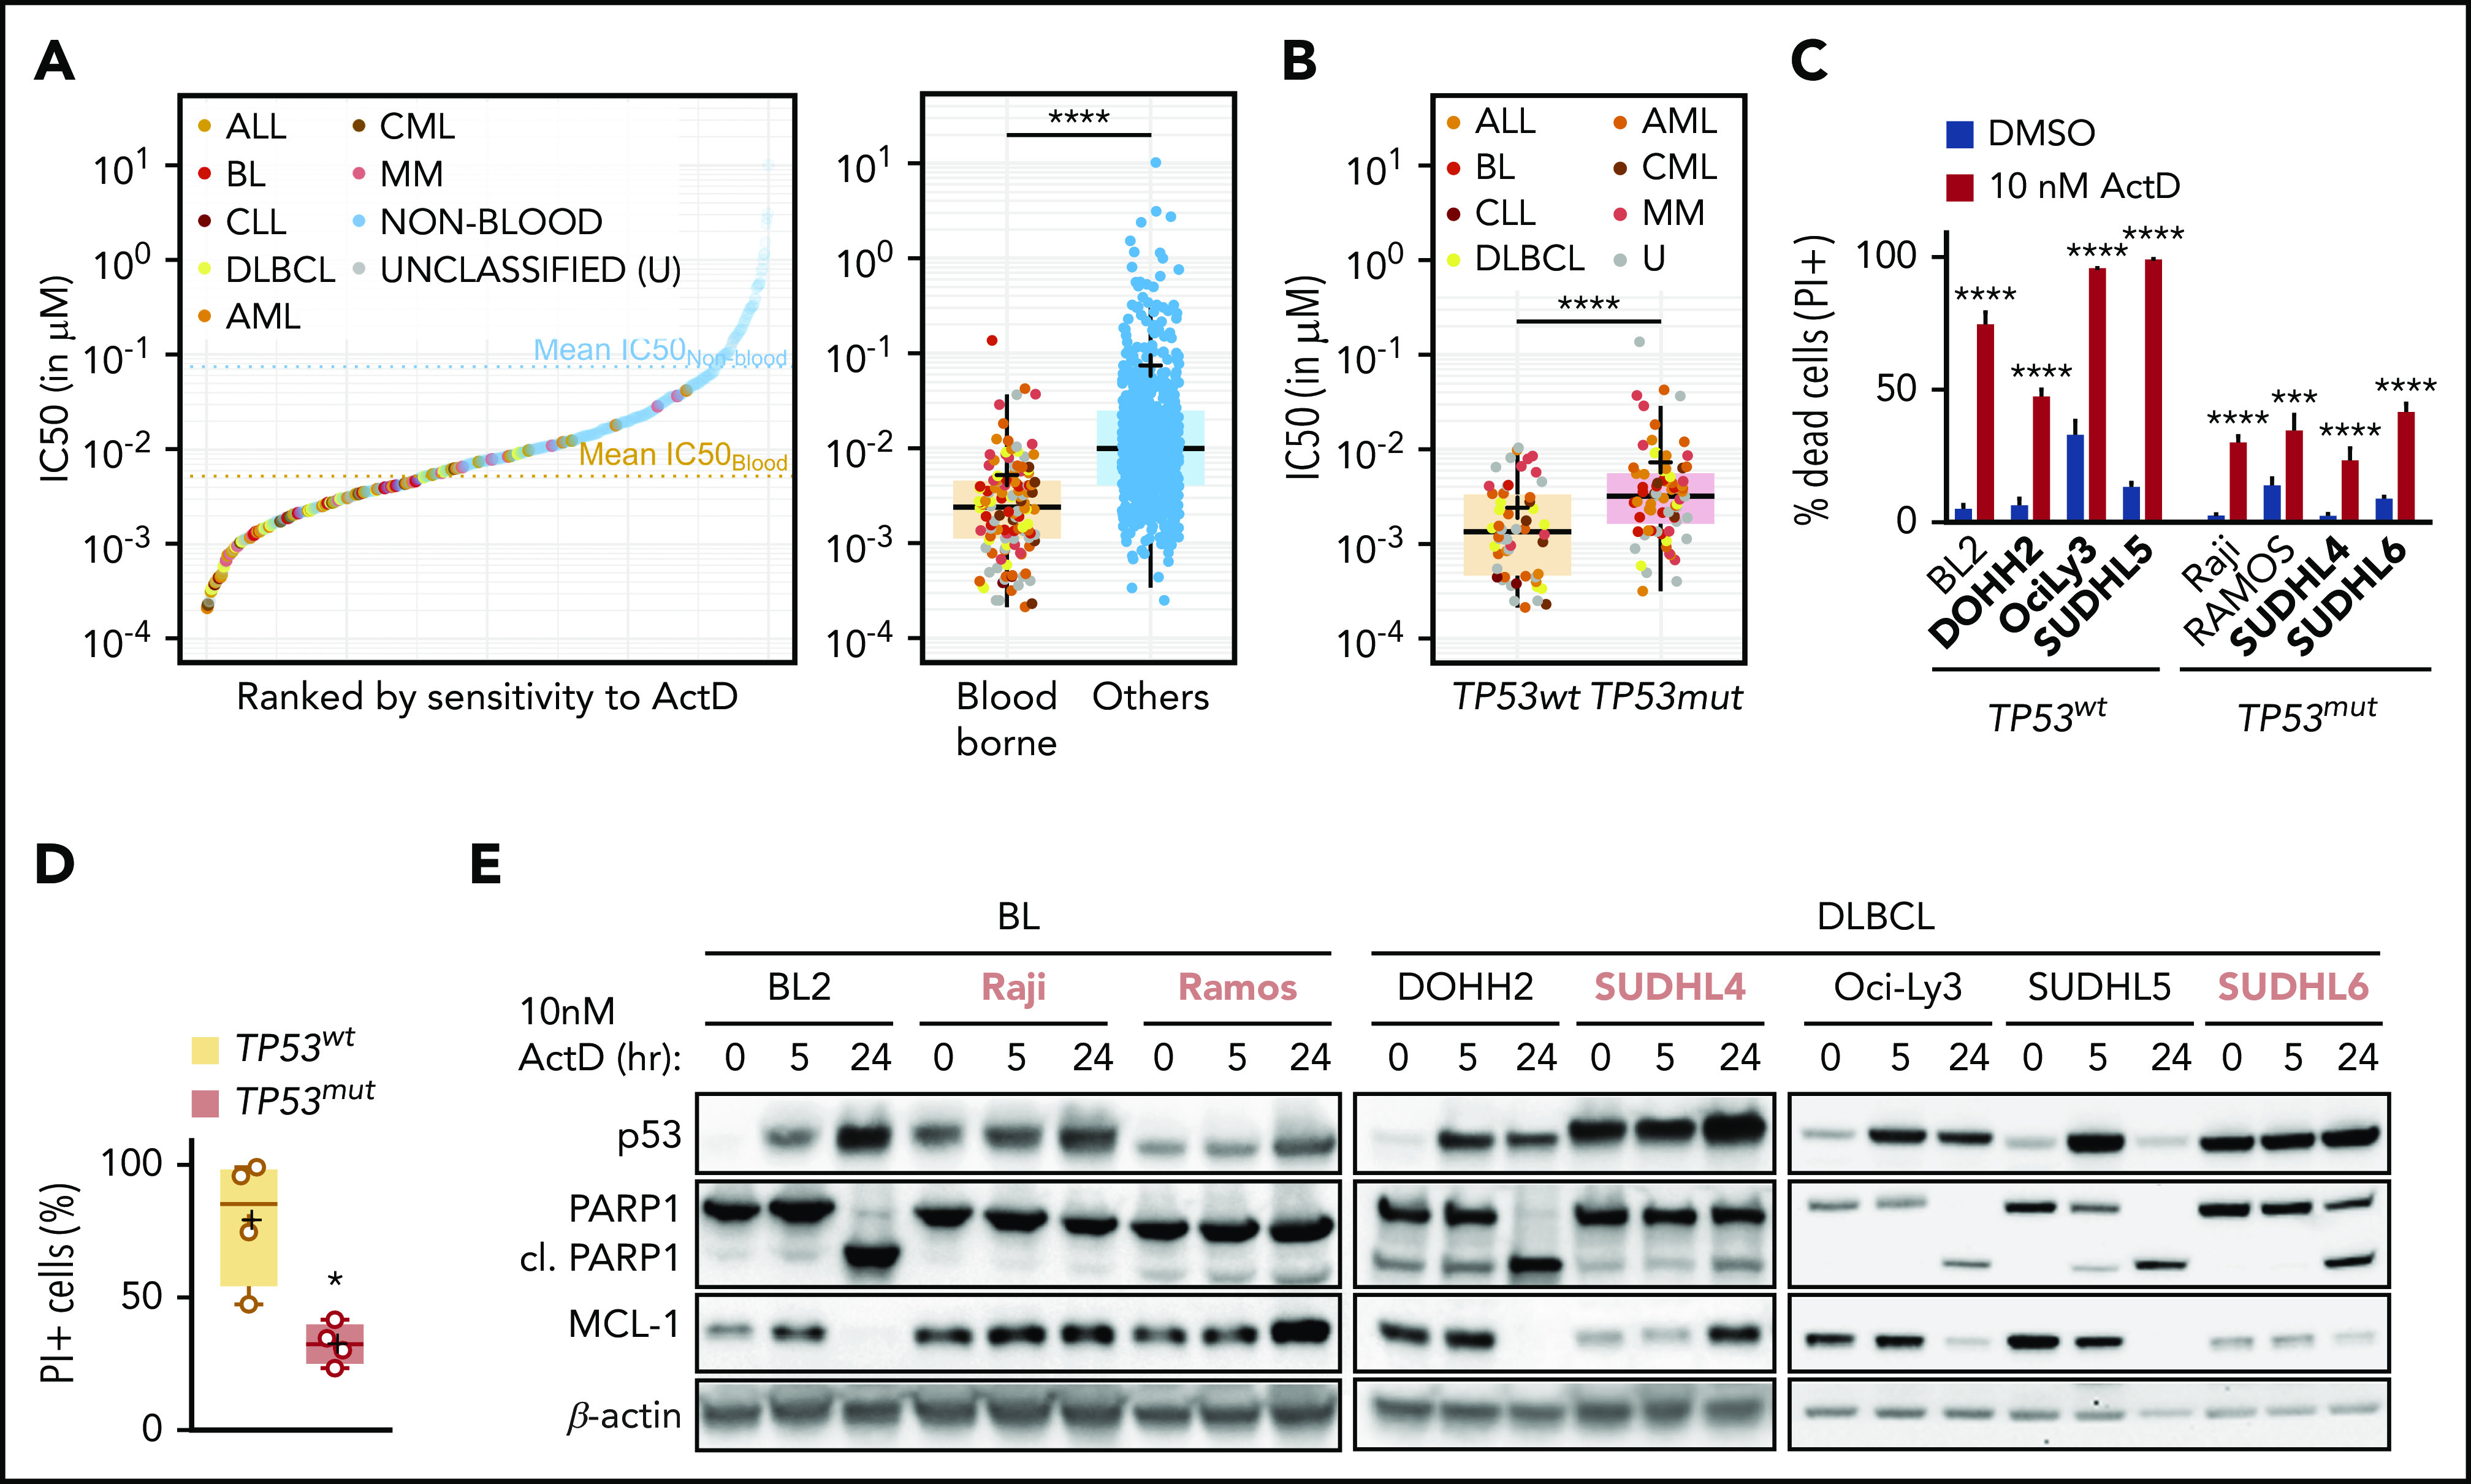
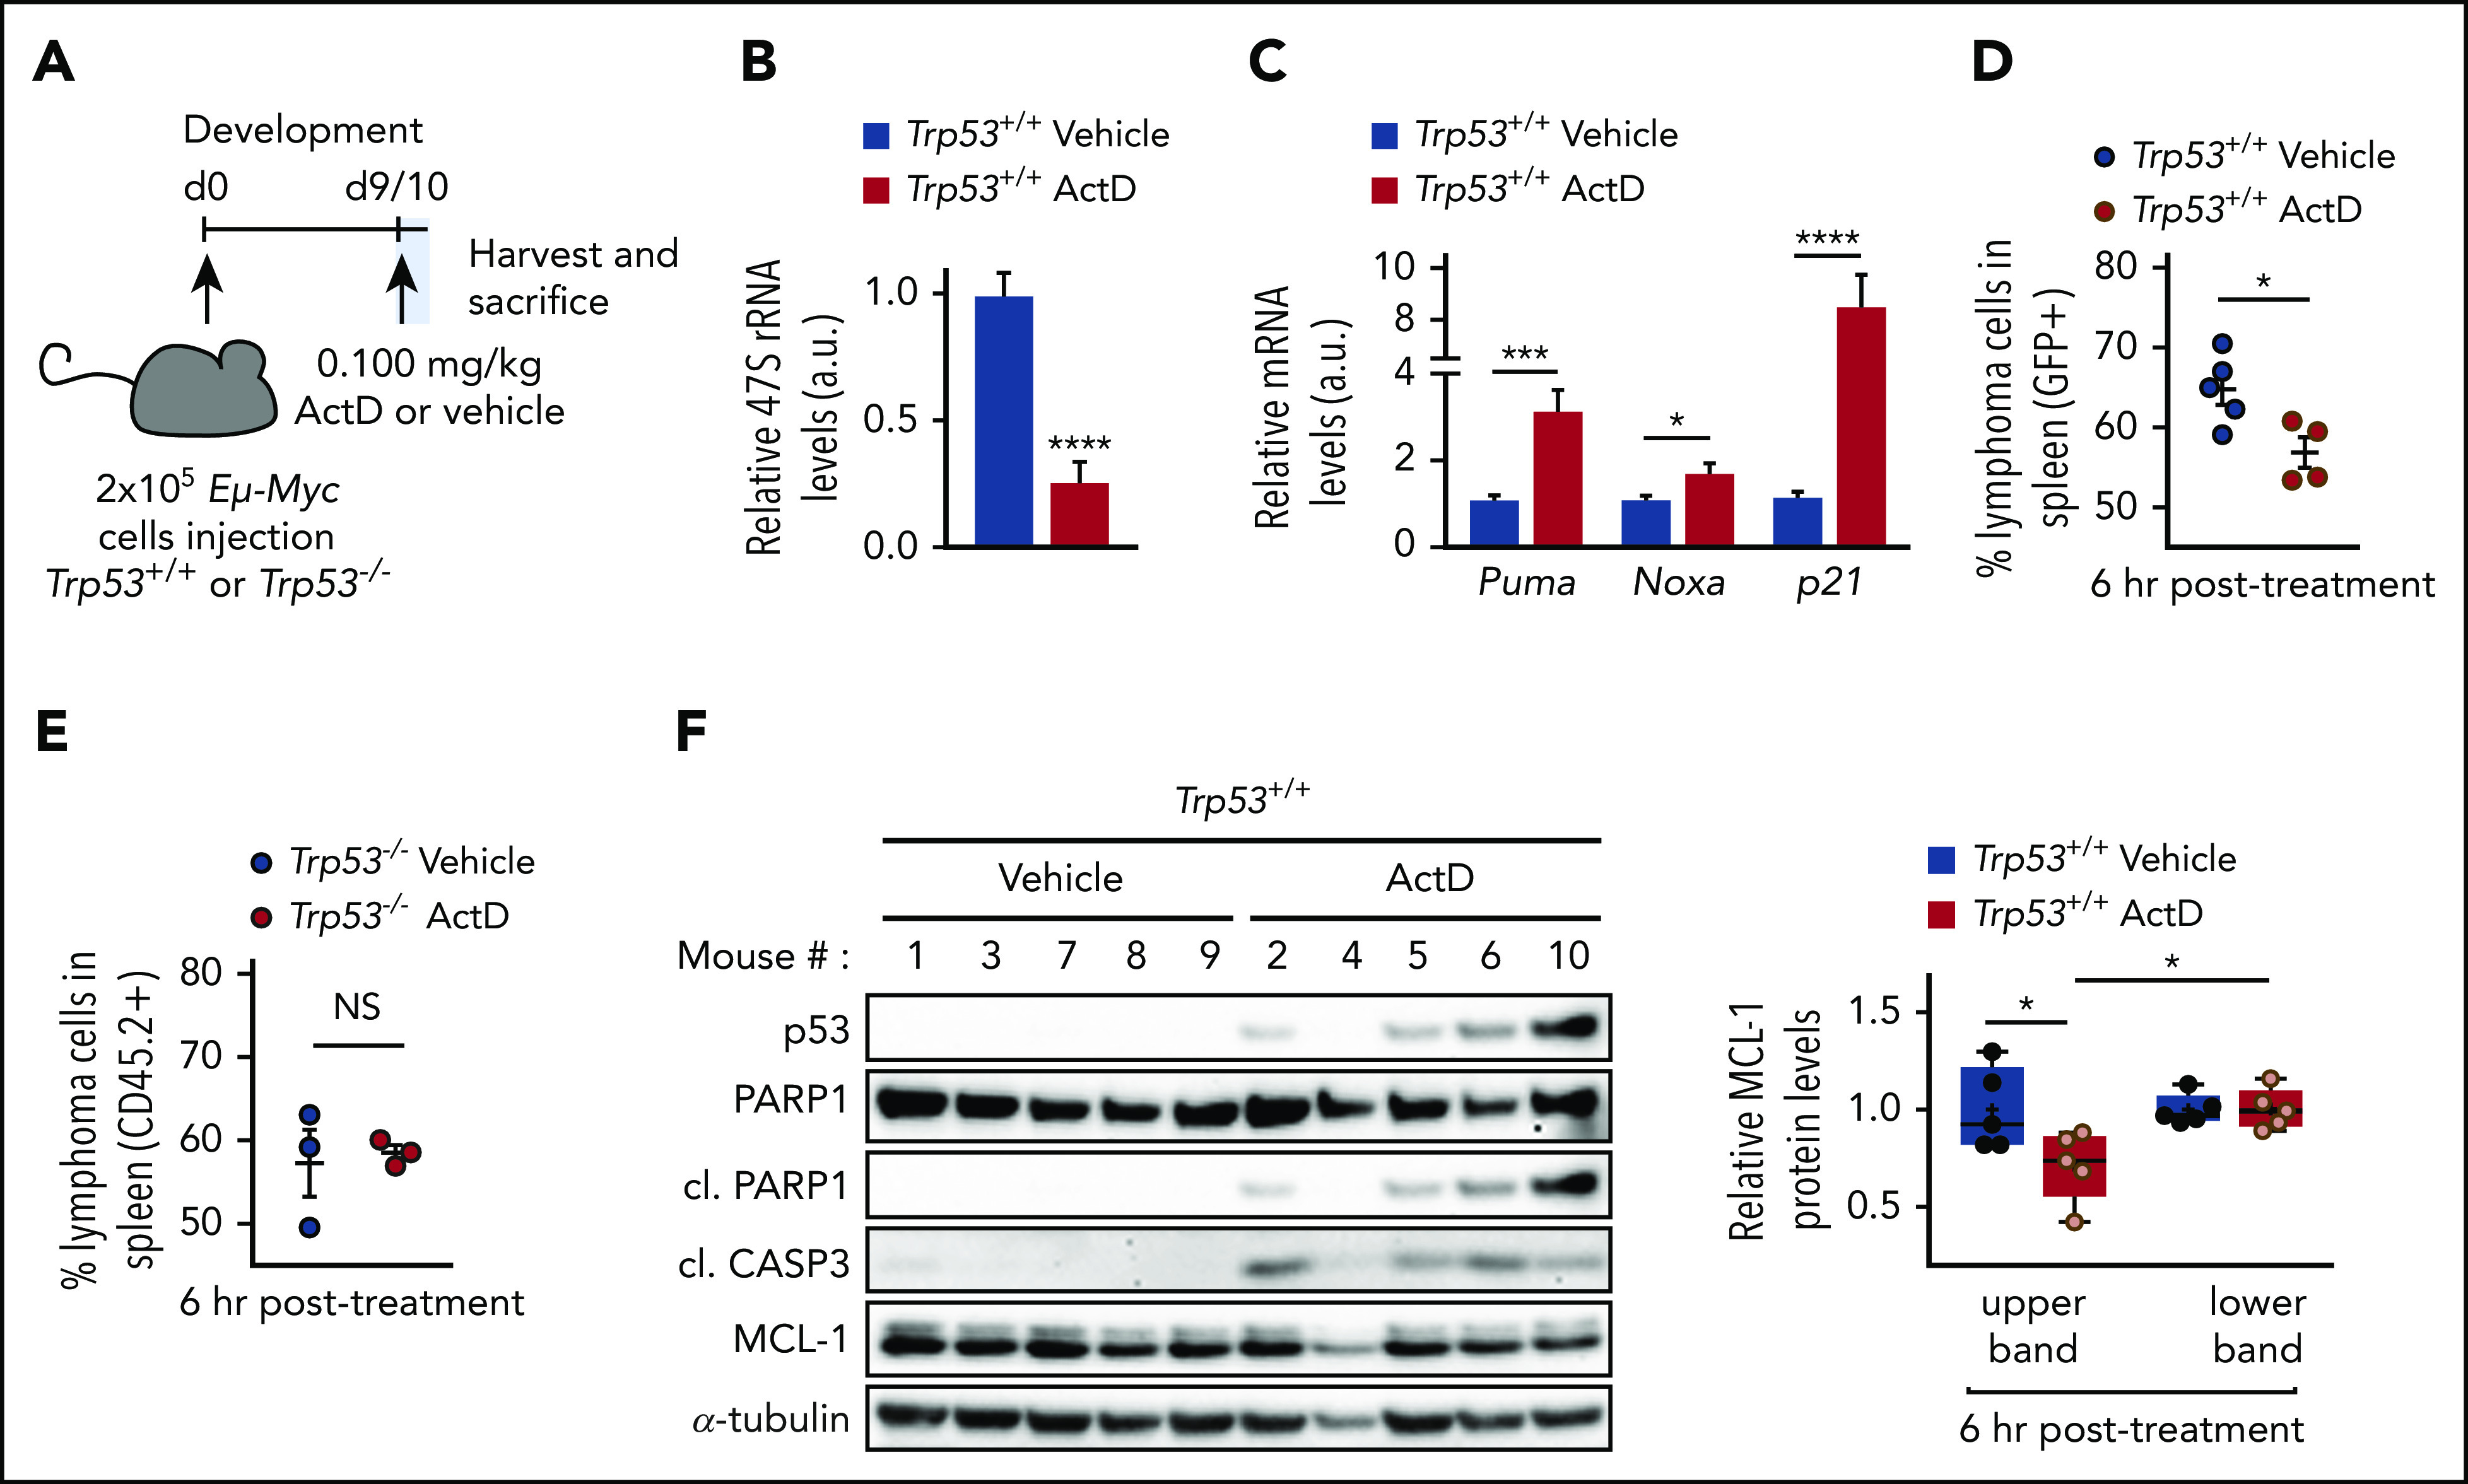
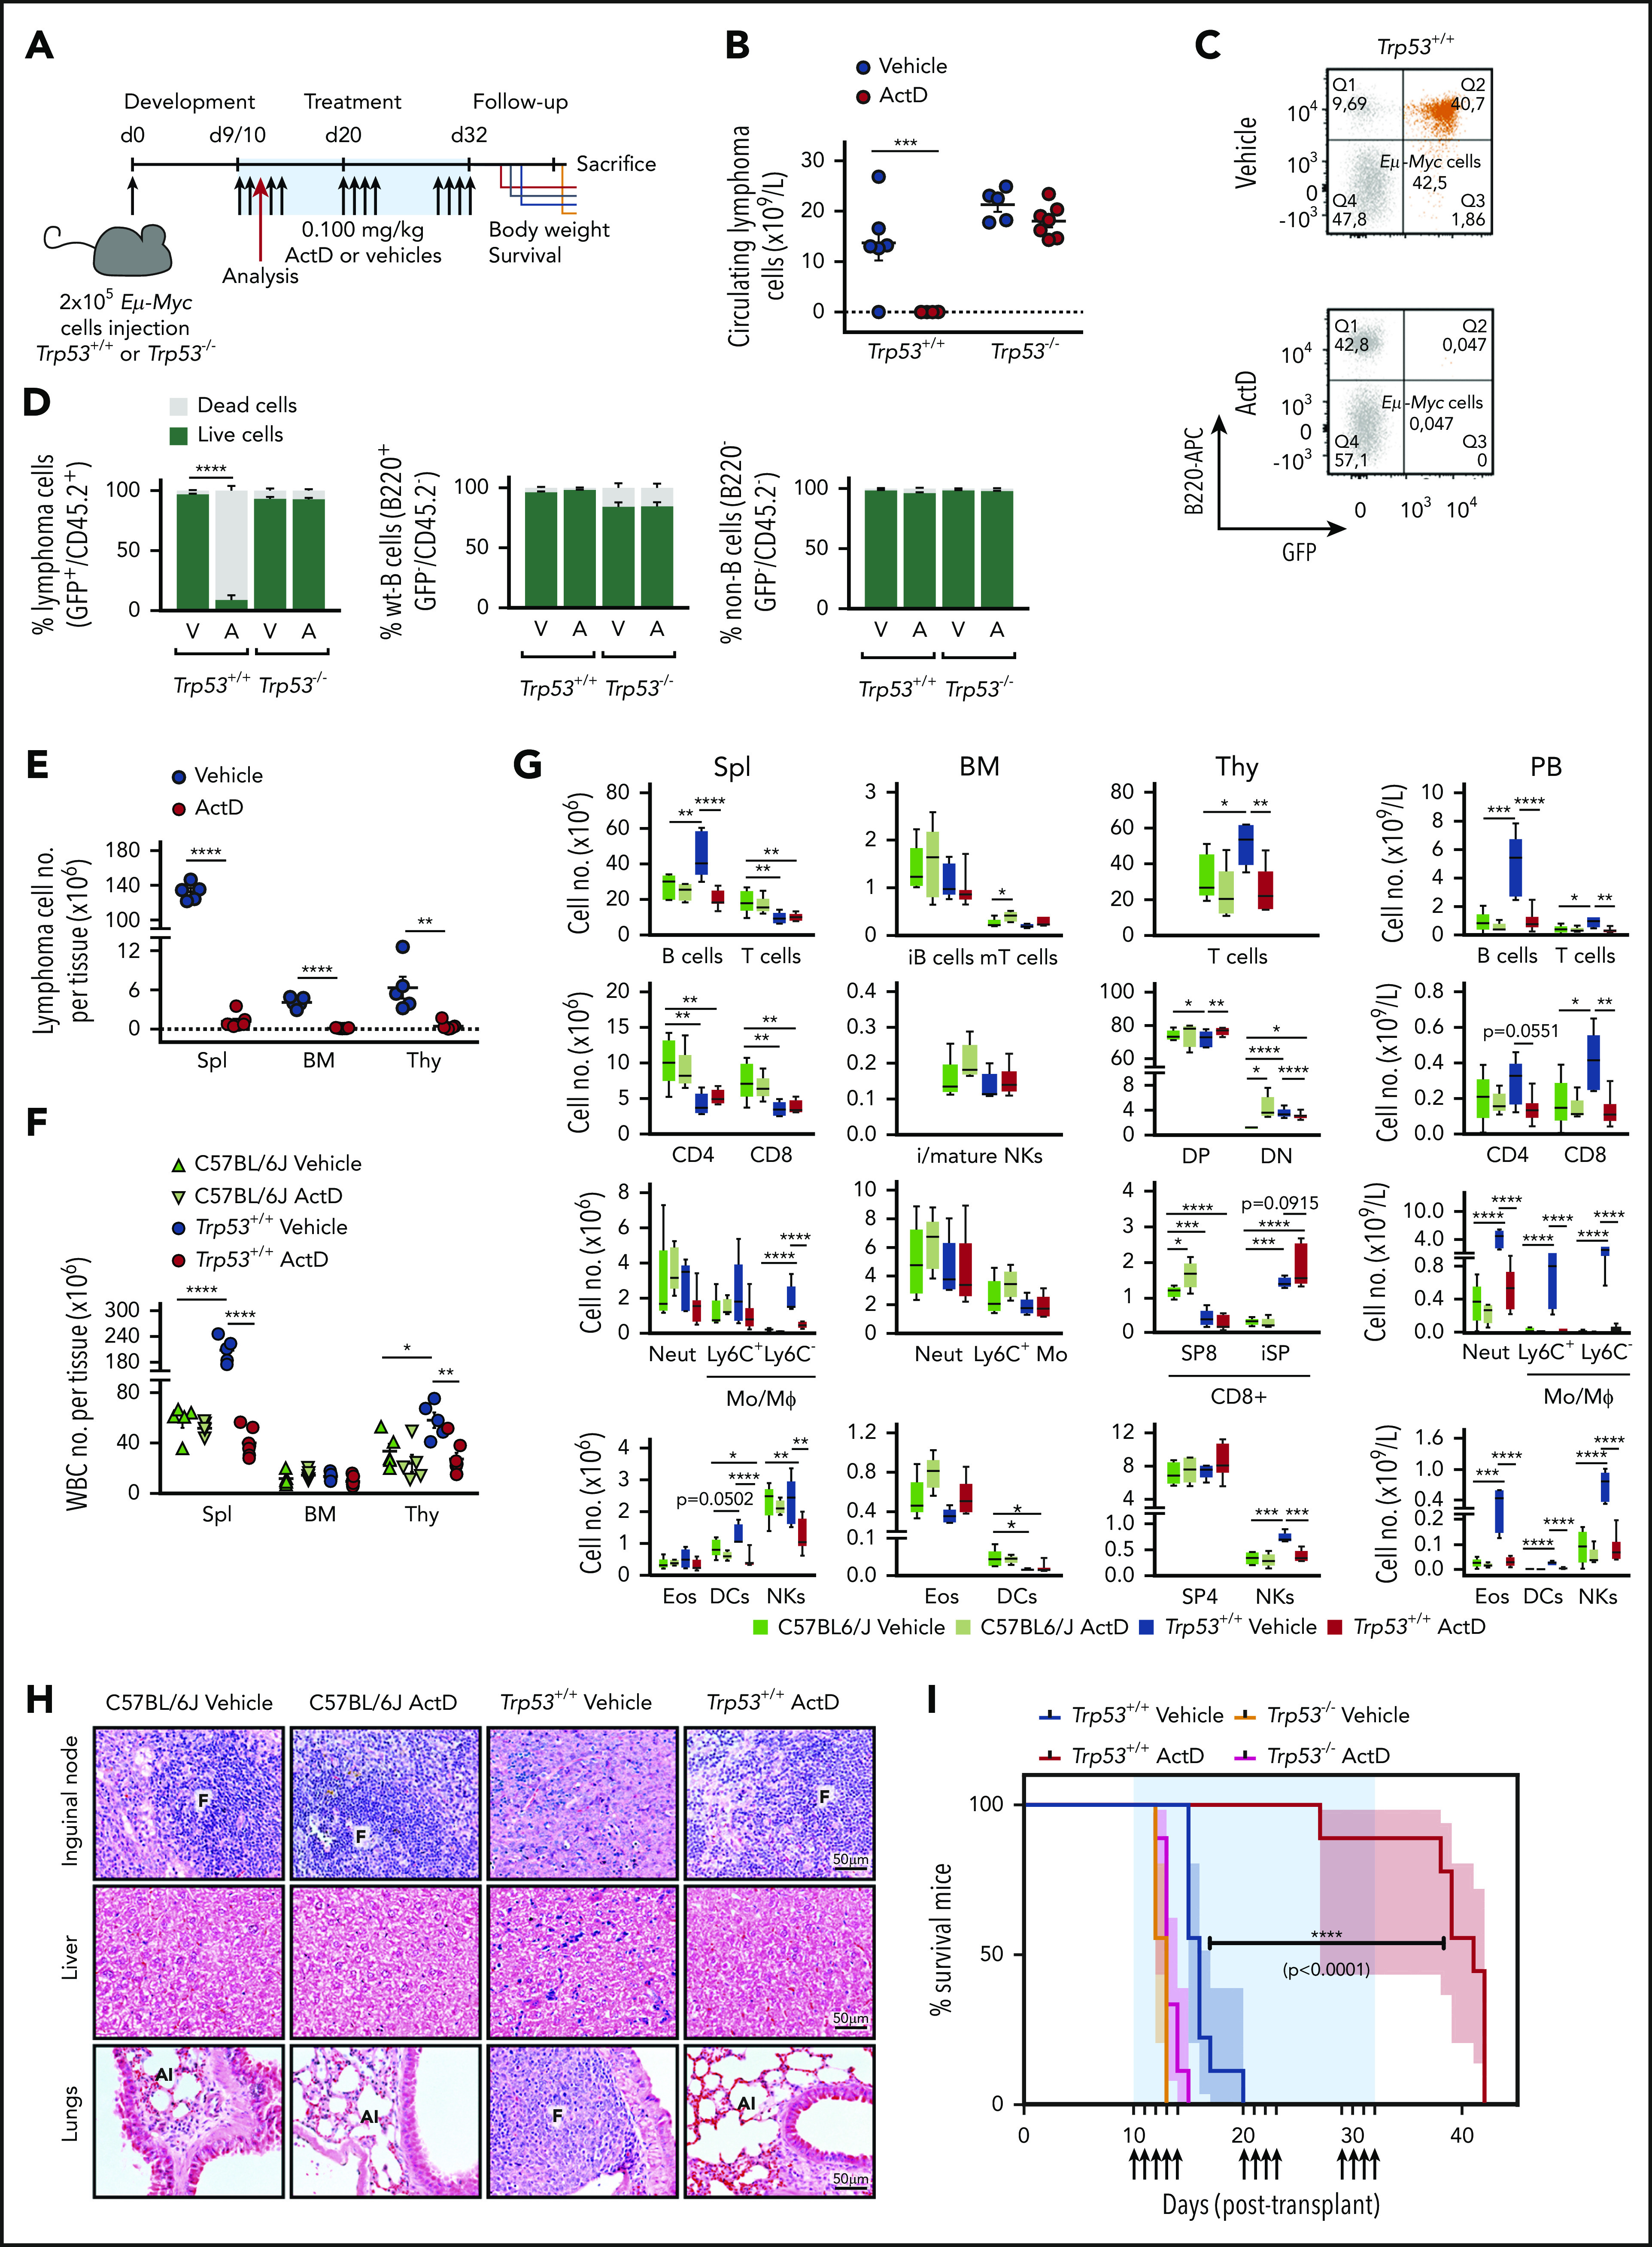
MYC-driven B-cell lymphomas are addicted to increased levels of ribosome biogenesis (RiBi), offering the potential for therapeutic intervention. However, it is unclear whether inhibition of RiBi suppresses lymphomagenesis by decreasing translational capacity and/or by p53 activation mediated by the impaired RiBi checkpoint (IRBC). Here we generated Eμ-Myc lymphoma cells expressing inducible short hairpin RNAs to either ribosomal protein L7a (RPL7a) or RPL11, the latter an essential component of the IRBC. The loss of either protein reduced RiBi, protein synthesis, and cell proliferation to similar extents. However, only RPL7a depletion induced p53-mediated apoptosis through the selective proteasomal degradation of antiapoptotic MCL-1, indicating the critical role of the IRBC in this mechanism. Strikingly, low concentrations of the US Food and Drug Administration-approved anticancer RNA polymerase I inhibitor Actinomycin D (ActD) dramatically prolonged the survival of mice harboring Trp53+/+;Eμ-Myc but not Trp53-/-;Eμ-Myc lymphomas, which provides a rationale for treating MYC-driven B-cell lymphomas with ActD. Importantly, the molecular effects of ActD on Eμ-Myc cells were recapitulated in human B-cell lymphoma cell lines, highlighting the potential for ActD as a therapeutic avenue for p53 wild-type lymphoma.


Conflict of interest statement

Conflict-of-interest disclosure: The authors declare no competing financial interests.

Figures

None
Graphical abstract
Figure 1.
Figure 1.
Effects of RP depletion on nascent protein synthesis and activation of the IRBC. RPL7a and RPL11 shRNA vector-containing Eμ-Myc cell lines were treated for 22 hours with 1 μg/mL or 10 ng/mL doxycycline, respectively, to achieve ∼50% depletion of their corresponding RP mRNA. Renilla (Ren) shRNA-expressing cells, used as a control, were treated for 22 hours with 1 μg/mL doxycycline. (A) Rpl7a and Rpl11 transcript levels in correspondingly RP-depleted cells relative to control cells (shRen), determined by quantitative reverse transcriptase polymerase chain reaction (qRT-PCR) and normalized to β-actin (n = 4). ****P < .0001 (unpaired Student t test). (B) Representative western blot analysis of RPL7a and RPL11 levels in whole cell lysates (WCLs) and in postribosomal supernatants (Post-ribo) containing 20 and 60 μg protein, respectively, from control (shRen) and from RPL7a- and RPL11-depleted cells (n = 2). (C) 3H-uridine autoradiogram (left panel) and ethidium bromide (EtBr)-stained agarose gel (right panel) of 28S and 18S shRNA from control (shRen) and from RPL7a- and RPL11-depleted cells pulsed with 3H-uridine for 2 hours. (D) Nascent protein synthesis rate, quantified by incorporation of 3H-leucine and normalized to total protein concentration (n = 3). *P < .05 (1-way analysis of variance (ANOVA) test). (E-F) Representative western blot analyses (E) WCLs (n > 4), post-ribosomal supernatants (Input), and coimmunoprecipitates of MDM2, p53, RPL11, and RPL5 in control (shRen) and RPL7a- and RPL11-depleted cells (n = 4) (F). A nonspecific rabbit immunoglobulin G (IgG) antibody was used as control for the immunoprecipitation (IP). a.u., arbitrary units; CASP3, caspase-3; cl., cleaved; cpm, counts per minute; long exp., long exposure. Data are presented as mean ± standard error of the mean (SEM).
Figure 2.
Figure 2.
Induction of the IRBC stabilizes p53 and leads to caspase-dependent cell death in Trp53+/+;Eμ-Myc, but not in Trp53–/–;Eμ-Myc lymphoma cells. (A-B) Proliferation assays of control (shRen) and RPL7a and RPL11-depleted Trp53+/+;Eμ-Myc or Trp53–/–;Eμ-Myc lymphoma cells treated for 48 hours with doxycycline (dox) as in Figure 1 and of (A) Trp53+/+;Eμ-Myc or Trp53–/–;Eμ-Myc lymphoma cells treated for 12 hours with 5 nM ActD or dimethyl sulfoxide (DMSO)-vehicle (NT) (B). Data are shown relative to their respective Trp53+/+;Eμ-Myc or Trp53–/–;Eμ-Myc lymphoma cell controls (n = 3-5). (C) Proportion of apoptotic shRen, shRPL7a, and shRPL11 Trp53+/+;Eμ-Myc or Trp53–/–;Eμ-Myc lymphoma cells from panel A determined by annexin V (AnnV) and Zombie Violet (ZV) staining and flow cytometry (n = 2-3). (D) Representative dot plots from panel C. shRen-expressing control and RPL7a- and RPL11-depleted Trp53+/+;Eμ-Myc (top panels) or Trp53–/–;Eμ-Myc (bottom panels) cells are shown. (E) Representative western blot analysis of lysates from shRen and shRPL7a Trp53+/+;Eμ-Myc lymphoma cells treated for 22 hours with doxycycline with or without the pan-caspase inhibitor carbobenzoxy-valyl-alanyl-aspartyl-[O-methyl]-fluoromethylketone) (Z-VAD-FMK; ZVAD) at 20 μM (n = 3). (F) Proliferation assay of RPL7a-depleted Trp53–/–;Eμ-Myc lymphoma cells in NT, treated under doxycycline or doxycycline and ZVAD conditions at 22 and 48 hours (n = 3). AnnV-AF680, Alexa Fluor 680-conjugated annexin V. Data are presented as mean ± SEM. *P < .05; **P < .01; ***P < .001; ****P < .0001 (2-way ANOVA test).
Figure 3.
Figure 3.
Antiapoptotic MCL-1 protein expression and stability are decreased in RPL7a-depleted and ActD-treated Trp53+/+;Eμ-Myc lymphoma cells. (A) Representative western blot analyses of antiapoptotic BCL-2 proteins in control (shRen) and RPL7a- and RPL11-depleted Eμ-Myc lymphoma cells treated as described in Figure 1. Antiapoptotic MCL-1, upper band, is indicated (arrowhead). MCL-1, BCL-2, and BCL-XL protein expression was normalized to α-tubulin and shown as relative to shRen cells (n = 3). (B) Representative western blot analyses of MCL-1 in control (shRen) and RPL7a- and RPL11-depleted Trp53–/–;Eμ-Myc lymphoma cells (n = 3). Levels of antiapoptotic MCL-1 form (arrowhead), normalized to β-actin, are indicated below the corresponding blot as relative to shRen cells. (C) Time-course western blot analyses in Trp53+/+;Eμ-Myc and Trp53–/–;Eμ-Myc lymphoma cells treated with the Pol I inhibitors ActD (5 nM), CX-5461 (50 nM), and BMH-21 (1 μM) for the indicated times (n = 2). (D) Representative western blots showing MCL-1 stability in control (shRen) and RPL7a-depleted Trp53+/+;Eμ-Myc (top panel) or Trp53–/–;Eμ-Myc (bottom panel) lymphoma cells pretreated with doxycycline for 22 hours and harvested after treatment with 100 μg/mL cycloheximide (CHX) at the indicated time points (n = 2-3). Band corresponding to antiapoptotic MCL-1 is indicated (arrowhead). (E-F) Line graphs showing MCL-1 stability over time in control (shRen) and RPL7a-depleted Trp53+/+;Eμ-Myc (E) and Trp53–/–;Eμ-Myc (F) lymphoma cells determined from MCL-1 immunoblots (D) and shown as relative to MCL-1 level at the time of CHX addition. (G-H) Representative western blot and line graph showing MCL-1 stability in Trp53+/+;Eμ-Myc lymphoma cells treated with or without 5 nM ActD for 4 hours (n = 2), determined by CHX chase at the indicated time points, as described in panel E. Band corresponding to antiapoptotic MCL-1 is indicated (arrowhead). NS, not significant. Data are presented as mean ± SEM. *P < .05 (2-way ANOVA test).
Figure 4.
Figure 4.
ActD induces ubiquitin-independent but proteasome-dependent degradation of MCL-1. (A) Representative western blot analysis of Trp53+/+;Eμ-Myc lymphoma cells treated for 4 hours with 5 nM ActD, with or without 20 μM quinoline-Val-Asp-difluorophenoxymethylketone (QVD-OPh; QVD). Expression of antiapoptotic MCL-1 (arrowhead), determined as in Figure 3A, is shown as relative to MCL-1 levels in NT cells in the absence of QVD (n = 3). (B) Co-IP of NOXA, PUMA, and BAK with MCL-1 in Trp53+/+;Eμ-Myc lymphoma cells treated for 4 hours with 5 nM ActD compared with NT cells (n = 3). Indicated band (arrowhead) corresponds to the immunoglobulin light chain (IgL) of the antibodies used for IP. (C) Ubiquitination assay in MCL-1 immunoprecipitates from Trp53+/+;Eμ-Myc and Trp53–/–;Eμ-Myc lymphoma cells treated for 6 hours with 5 nM ActD compared with NT cells (n = 2). (D-E) FLAG-tagged MCL1 stability of either FLAG-tagged MCL-1wt- (D) or FLAG- (E) tagged MCL-1KR-overexpressing Eμ-Myc lymphoma cells determined by CHX chase after treatment with or without 5 nM ActD for 4 hours. Line graphs display FLAG-tagged MCL1 expression (arrowhead) over time determined from MCL-1 immunoblots (supplemental Figure 4F-G) as in Figure 3E (n = 2). (F) Representative western blot analysis of Trp53+/+;Eμ-Myc lymphoma cells treated for 30 minutes with 1.25 µM MG132 before treatment with ActD for 4 hours. Expression of antiapoptotic MCL-1 (arrowhead), calculated as in Figure 3B, is shown as relative to MCL-1 levels in NT cells in the absence of MG132 (n = 4). Data are presented as mean ± SEM. *P < .05; **P < .01 (2-way ANOVA test).
Figure 5.
Figure 5.
ActD treatment induces cell death in human TP53wtB-cell lymphomas. (A) ActD IC50 values of a data set with 740 tumor cell lines from the Genomics of Drug Sensitivity in Cancer (GDSC) database ranked by sensitivity to ActD (left) and box plot showing IC50 values of hematologic (blood-borne) and nonhematologic (others) tumors (right). Box plot represents median and first and third quartiles per group, with individual values for each cell line, and the mean IC50 (+) is indicated. The mean IC50 of ActD is 5.26 (95% confidence interval [CI], 2.96-7.56) in blood-borne tumor cell lines vs 74.12 (95% CI, 34.87-111.36) in other tumor type cell lines. ****P < .0001 (Mann-Whitney-Wilcoxon test). (B) Box plot showing IC50 values of blood-borne tumors as a function of their TP53 status. Box plot represents median and first and third quartiles per group with individual values for each cell line, and the mean IC50 (+) is indicated. ****P < .0001 (Mann-Whitney-Wilcoxon test). (C) Proportion of dead cells from a panel of wt TP53 (TP53wt) and mutant TP53 (TP53mut) BL- and DLBCL-derived cell lines (shown in boldface) determined by propidium iodide (PI) staining and flow cytometry analysis after treatment with 10 nM ActD for 48 hours (n = 3-4). Data are presented as mean ± SEM. ***P < .001; ****P < .0001 (2-way ANOVA test). (D) Scatter plot showing proportion of dead cells from panel C as a function of their TP53 status. Box plot represents median and first and third quartiles per group with individual values for each cell line, and the mean IC50 value (+) is indicated. *P < .05 (Mann-Whitney-Wilcoxon test). (E) Representative western blot analysis from lysates of the panel analyzed in panel C treated with 10 nM ActD for the indicated times (n = 3-4). TP53mut cell lines are shown in pink boldface. ALL, acute lymphoblastic leukemia; CLL, chronic lymphocytic leukemia; AML, acute myeloid leukemia; CML, chronic myeloid leukemia; MM, multiple myeloma; U, unclassified.
Figure 6.
Figure 6.
ActD treatment induces p53-dependent cell death in Eμ-Myc lymphomas in vivo. (A) C57BL/6J and C57BL/6J-Ly5.1 mice were intravenously injected with 200 000 Trp53+/+;Eμ-Myc or Trp53–/–;Eμ-Myc lymphoma cells, respectively, and were treated with a single dose of 0.1 mg/kg ActD or vehicle. Spleen, inguinal, and axillary lymph nodes were collected 6 hours after drug administration from 3-5 mice per group as described in supplemental Methods. (B-C) qRT-PCR analysis of Its1-containing 47S pre-rRNA (B) and of Puma, Noxa, and p21 (C) in axillary nodes from ActD-treated mice, normalized to β2m mRNA levels and compared with vehicle-treated axillary nodes. *P < .05; ***P < .001; ****P < .0001 (unpaired Student t test). (D-E) Percentage of viable lymphoma cells in the spleen of Trp53+/+;Eμ-Myc (D) or Trp53–/–;Eμ-Myc (E) lymphoma-bearing mice determined by flow cytometry as the percentage of PI-, B220+ (pan B-cell marker), and either green fluorescent protein (GFP+) for Trp53+/+;Eμ-Myc lymphoma cells or CD45.2+ cells for Trp53–/–;Eμ-Myc lymphoma cells, as detailed in supplemental Methods. Data are presented as individual values with error bars displaying mean ± SEM. *P < .05 (unpaired Student t test). (F) Western blot analysis of the spleen homogenates of each Trp53+/+;Eμ-Myc lymphoma-bearing mouse analyzed in panel D. Expression of the 2 MCL-1 forms (upper and lower bands) as determined in Figure 2A is shown as relative to MCL-1 expression in the vehicle-treated group. Data are presented as individual values with error bars displaying mean ± SEM. *P < .05 (2-way ANOVA test). a.u., arbitrary units; d0, day 0.
Figure 7.
Figure 7.
ActD treatment promotes Trp53+/+;Eμ-Myc lymphomas regression in vivo. (A) C57BL/6J and C57BL/6J-Ly5.1 mice intravenously injected with 200 000 Trp53+/+;Eμ-Myc or Trp53–/–;Eμ-Myc lymphoma cells, respectively, were treated with either ActD (0.1 mg/kg) or vehicle, starting 9 to 10 days after injection. Drug was delivered in 3 discontinuous cycles, with the dosing days indicated by the arrows, resuming at day 32 posttransplantation. Tumor burden was assessed by immunostaining, and flow cytometric analyses from peripheral blood and hematopoietic tissues were collected from 5 to 7 mice per group after the third administration (red arrow) as described in “Methods.” (B) Number of lymphoma cells in circulating blood from mice after 3 days of ActD or vehicle administration determined by flow cytometry as described in the legend for Figure 6D and calculated as detailed in “Methods.” ***P < .000 (2-way ANOVA test). Dotted line is set at y = 0. (C) Representative dot plots from peripheral blood of a vehicle-treated (top) and an ActD-treated (bottom) Trp53+/+;Eμ-Myc-bearing mouse from panel B showing the Trp53+/+;Eμ-Myc lymphoma cell population (GFP+B220+B220low) in orange. (D) Percentage of live and dead Trp53+/+;Eμ-Myc or Trp53–/–;Eμ-Myc lymphoma cells (left) wt-B cells (center), and non-B cells (right panel), from the peripheral blood of mice analyzed in panel B. The proportion of dead cells from each population was determined as described in the legend for Figure 6D, with the markers identifying each population indicated on the y-axis of the corresponding graph. A, ActD; V, vehicle. ****P < .0001 (2-way ANOVA test). (E-F) Number of Trp53+/+;Eμ-Myc lymphoma cells (E) and white blood cells (WBCs) (F) contained in the spleen (Spl), bone marrow (BM), and thymus (Thy) of Trp53+/+;Eμ-Myc lymphoma-bearing mice after 3 days of ActD or vehicle administration compared with ActD- or vehicle-treated C57BL/6J control mice (n = 5 mice per group), determined by multicolor flow cytometry panel evaluation as detailed in supplemental Figure 7G. Data are presented as individual values with error bars displaying mean ± SEM. *P < .05; **P < .01; ****P < .0001. Statistical analyses for unpaired Student t test (E) and 1-way ANOVA test (F) were performed separately in each tissue. Dotted line (E) is set at y = 0. (G) Number of major immune cell populations contained in the spleen, bone marrow, thymus, and peripheral blood (PB) of Trp53+/+;Eμ-Myc lymphoma-bearing mice (n = 5-7 mice per treatment group) and of C57BL/6J control mice (n = 5 mice per treatment group) treated as in panel E. Box plots represent the median and the 95% CI for each cell population, as indicated on the x-axis. DC, dendritic cell; CD4, CD4+ T cells; CD8, CD8+ T cells; DN, double-negative; DP, double-positive; Eos, eosinophils; i, immature; iSP, immature single-positive thymocytes; m, mature; Mo/MФ, monocytes/macrophages; Neut, neutrophils; NK, natural killer; SP4, single-positive CD4 thymocytes; SP8, single-positive CD8 thymocytes. *P < .05; **P < .01; ***P < .001; ****P < .0001 (1-way ANOVA test performed separately for each population). (H) Photomicrographs (original magnification ×40) of hematoxylin- and eosin-stained paraffin-embedded sections of inguinal lymph nodes, liver, and lungs from representative C57BL/6J control and ActD-treated mice and from lymphoma-burdened sick control and ActD-treated Eμ-Myc mice (n = 3 mice per group) treated as in panel E. Al, alveoli; F, follicle; T, infiltrating tumor mass. (I) Kaplan-Meier survival curves of C57BL/6J and C57BL/6J-Ly5.1 mice harboring Trp53+/+;Eμ-Myc and Trp53–/–;Eμ-Myc lymphomas, respectively, and treated with ActD or vehicle (n = 9 mice per group) as indicated in panel A. Data are presented as mean ± SEM. ****P < .0001 (log-rank Mantel-Cox and Gehan-Breslow-Wilcoxon text).

Comment in

References

    1. Kress TR, Sabò A, Amati B. MYC: connecting selective transcriptional control to global RNA production. Nat Rev Cancer. 2015;15(10):593-607. - PubMed
    1. Pelletier J, Thomas G, Volarević S. Ribosome biogenesis in cancer: new players and therapeutic avenues. Nat Rev Cancer. 2018;18(1):51-63. - PubMed
    1. van Riggelen J, Yetil A, Felsher DW. MYC as a regulator of ribosome biogenesis and protein synthesis. Nat Rev Cancer. 2010;10(4):301-309. - PubMed
    1. Brown SJ, Cole MD, Erives AJ. Evolution of the holozoan ribosome biogenesis regulon. BMC Genomics. 2008;9(1):442. - PMC - PubMed
    1. Kelly GL, Grabow S, Glaser SP, et al. Targeting of MCL-1 kills MYC-driven mouse and human lymphomas even when they bear mutations in p53. Genes Dev. 2014;28(1):58-70. - PMC - PubMed

Publication types

MeSH terms