. 2021 Mar 18;137(11):1538-1549.
doi: 10.1182/blood.2020009166.

Targeting the AnxA1/Fpr2/ALX pathway regulates neutrophil function, promoting thromboinflammation resolution in sickle cell disease

Affiliations

Targeting the AnxA1/Fpr2/ALX pathway regulates neutrophil function, promoting thromboinflammation resolution in sickle cell disease

Junaid Ansari et al. Blood. .

Abstract

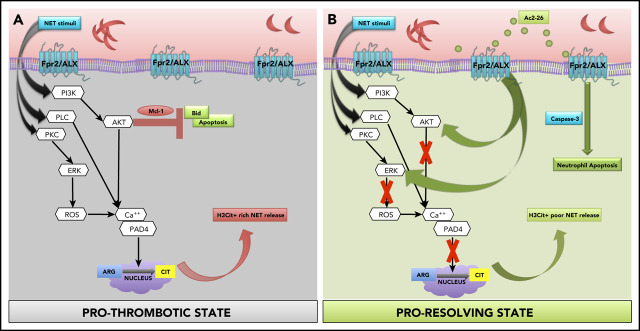
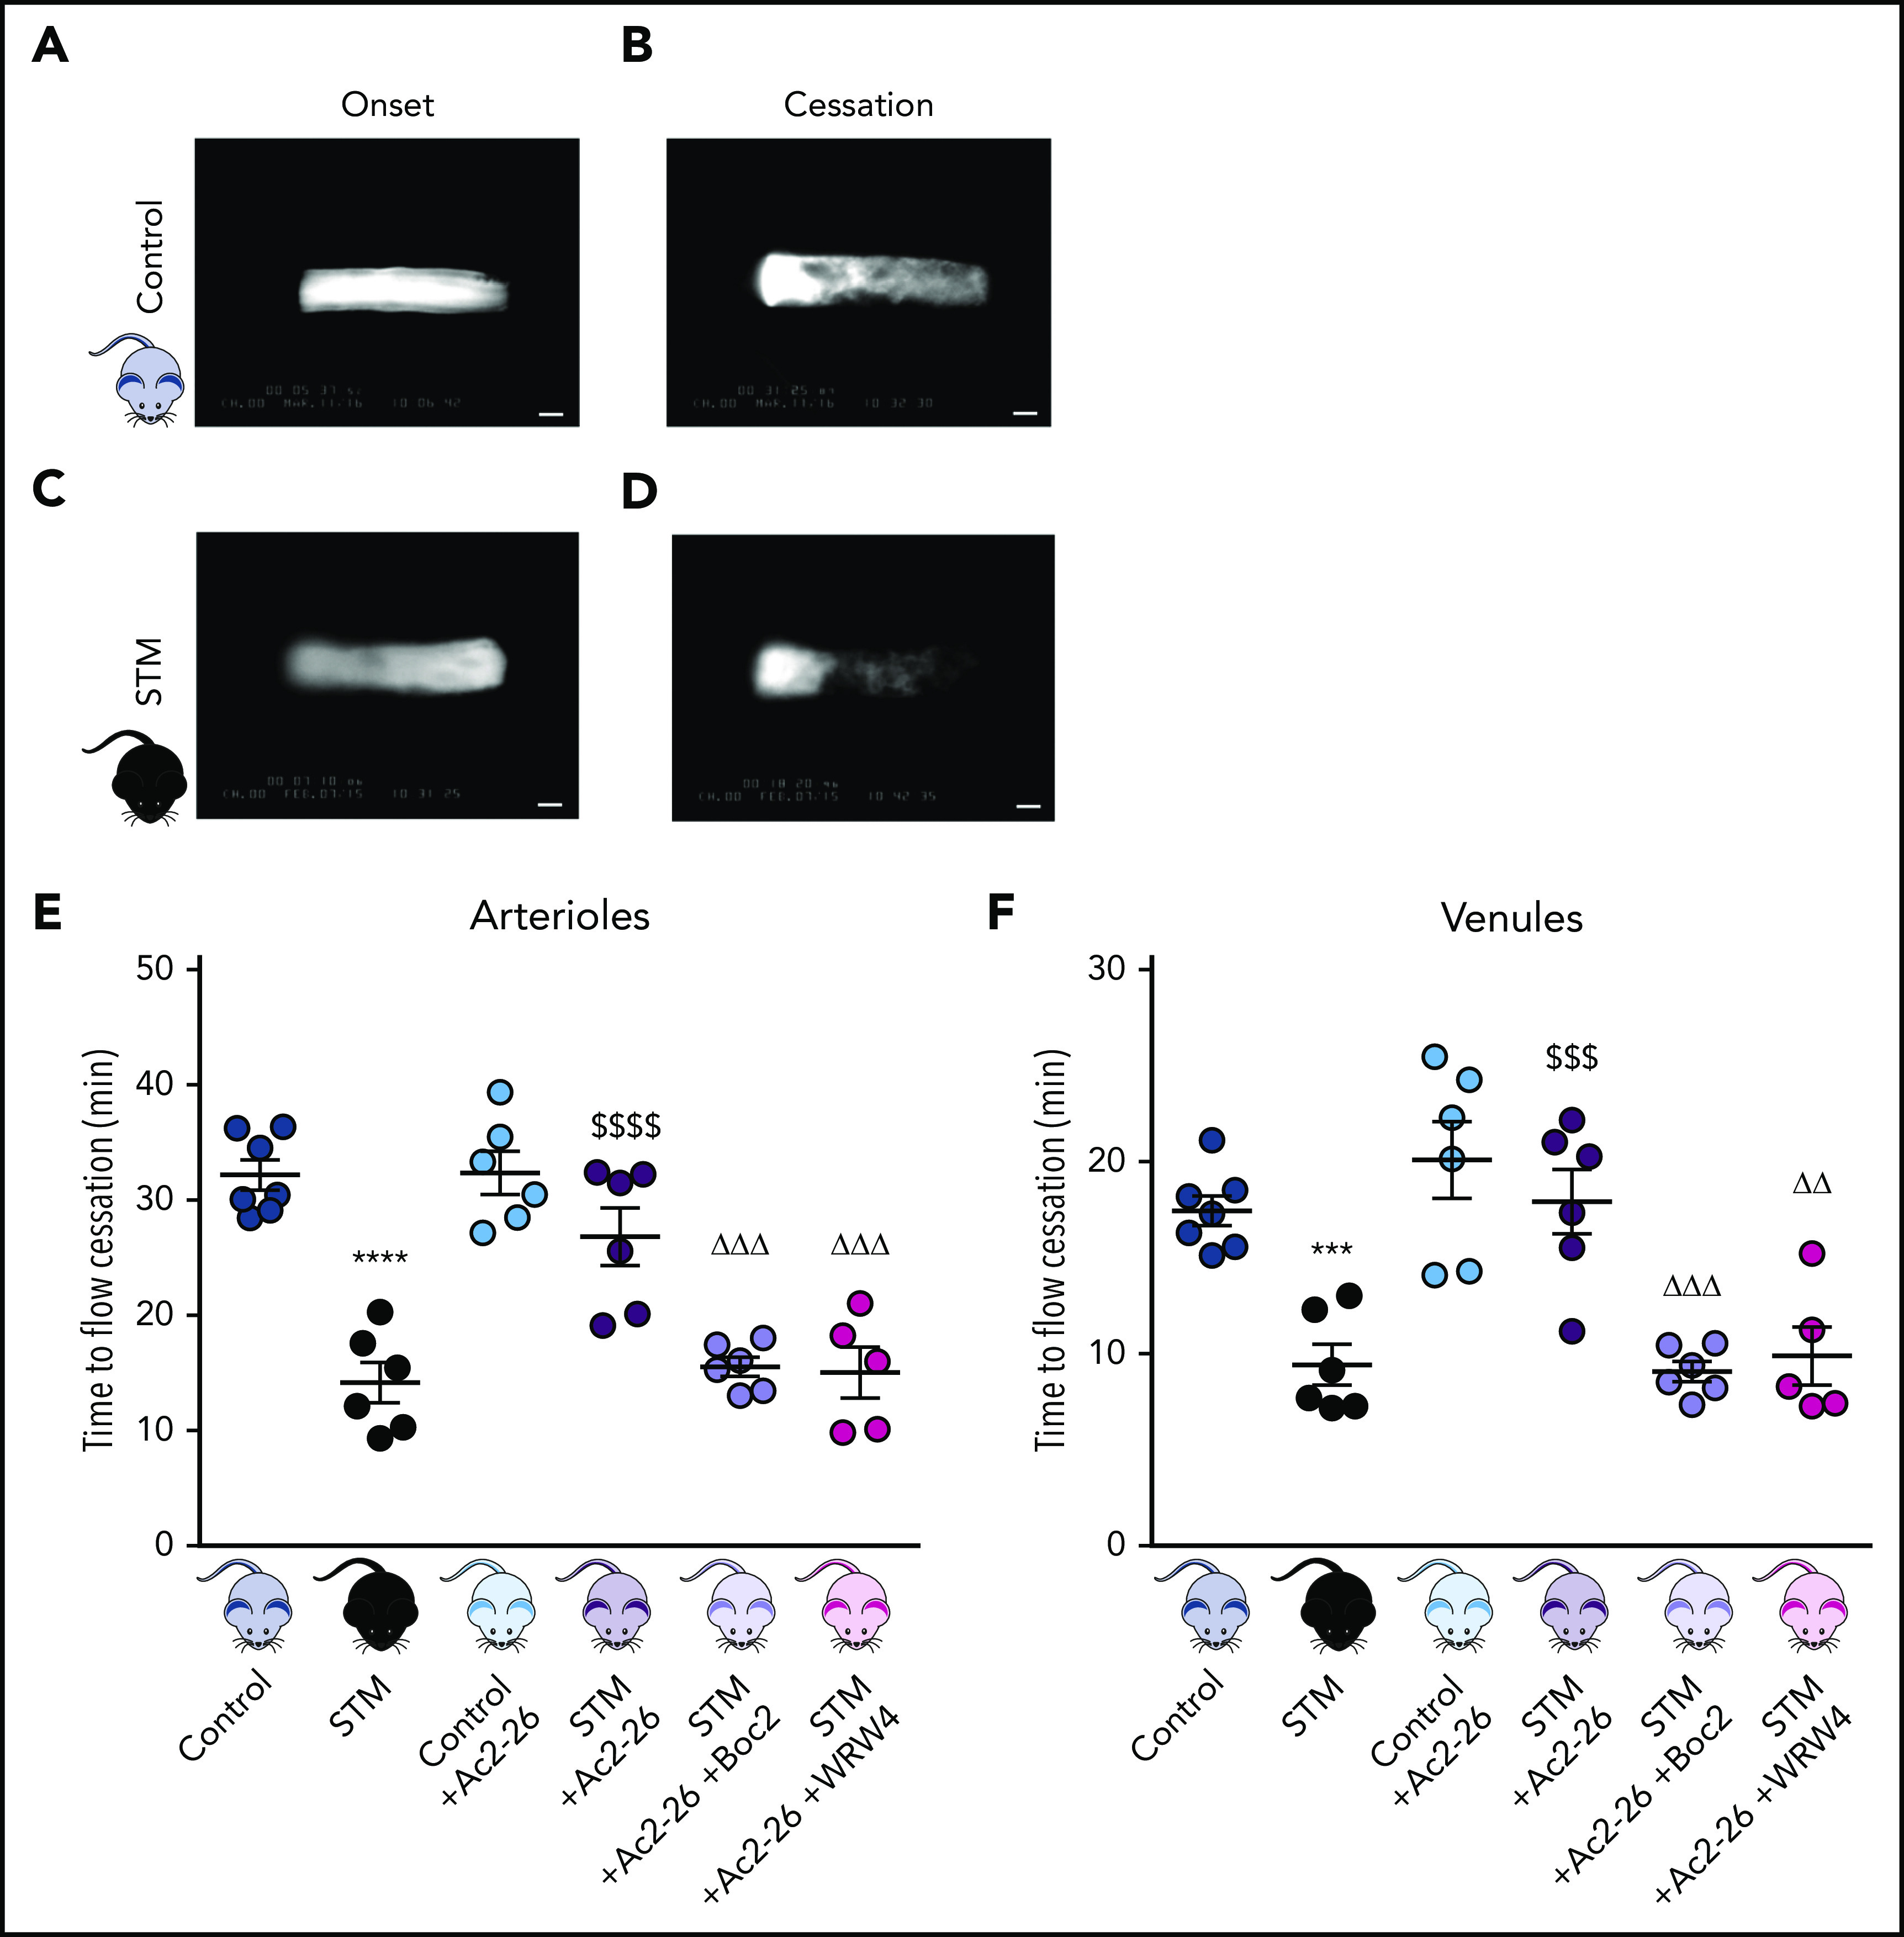
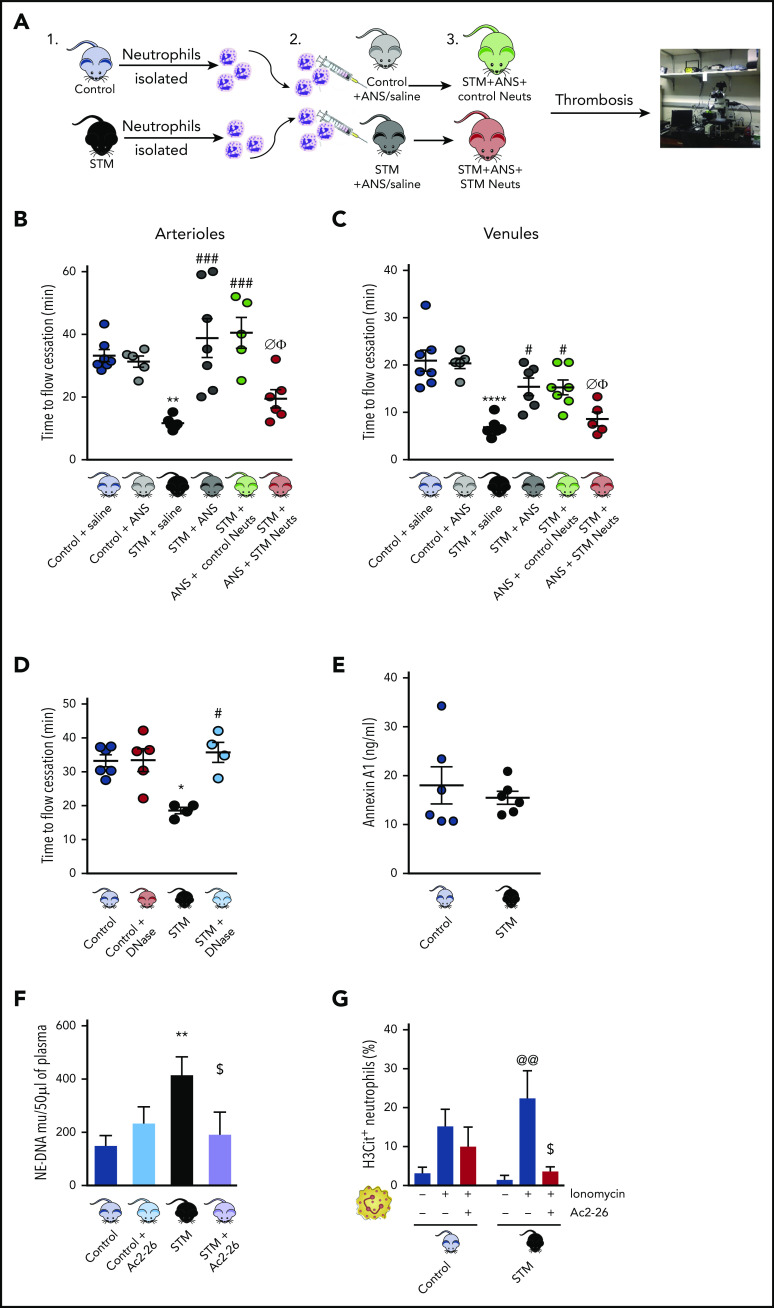
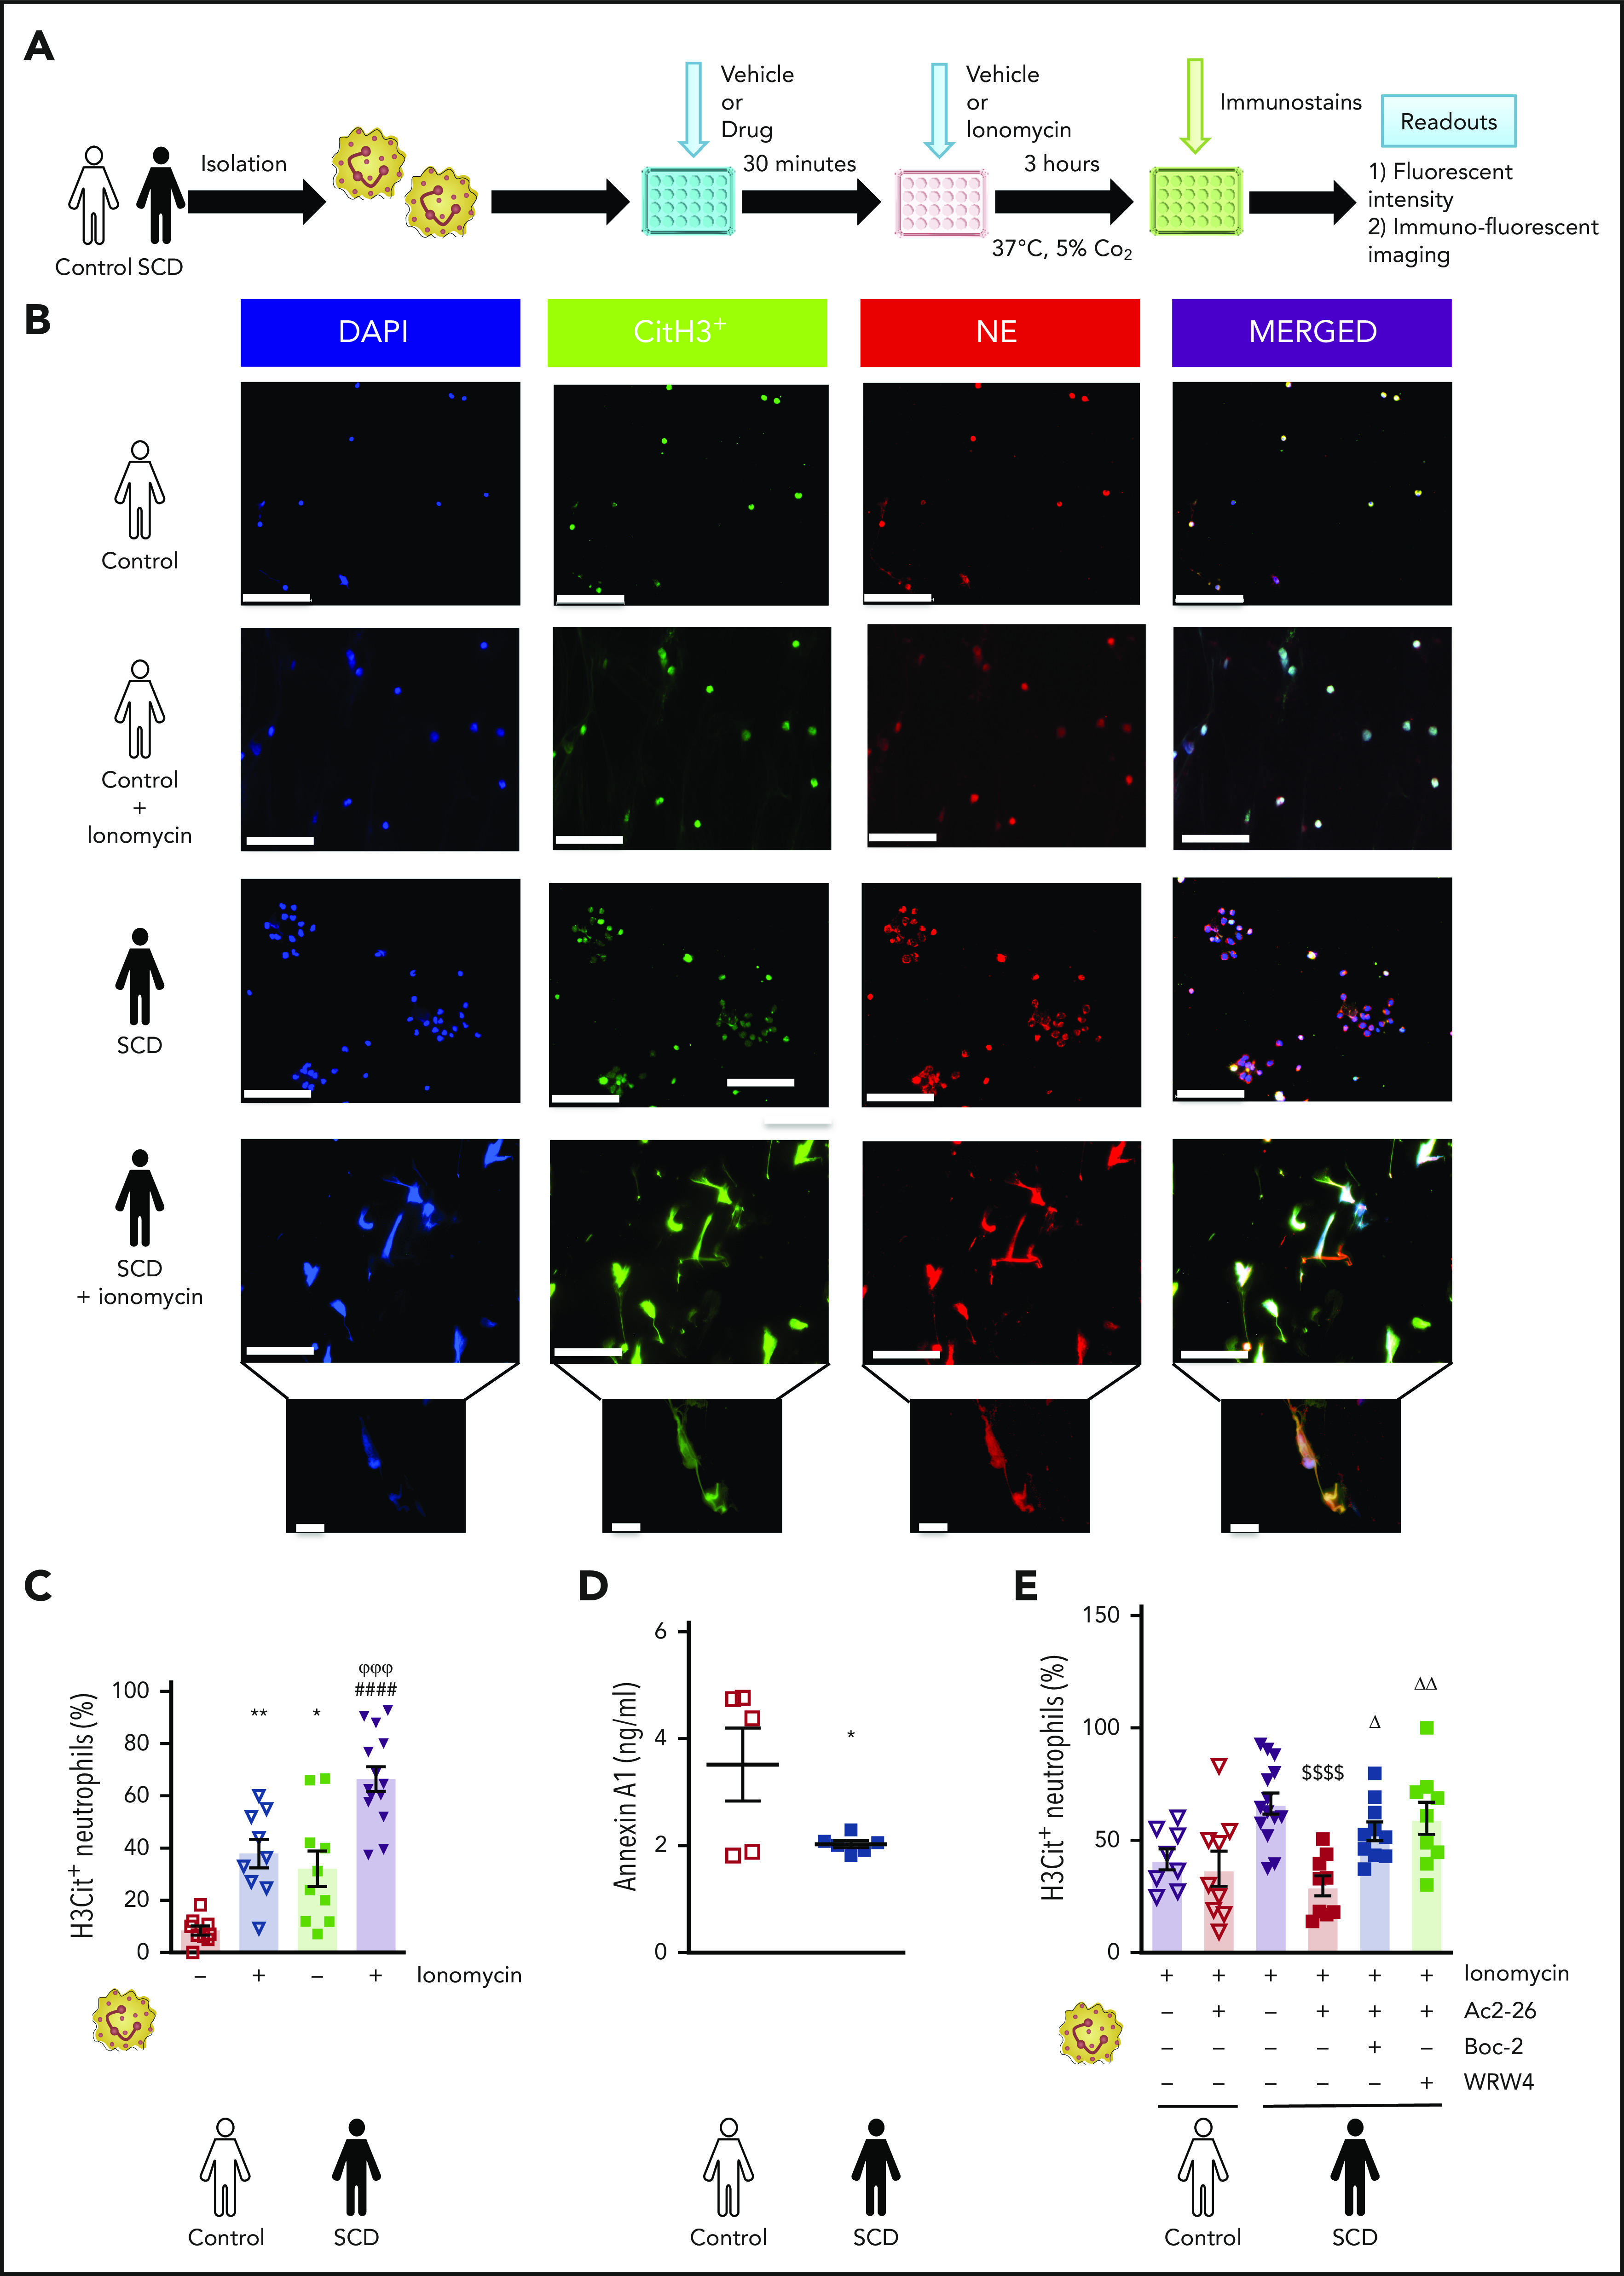
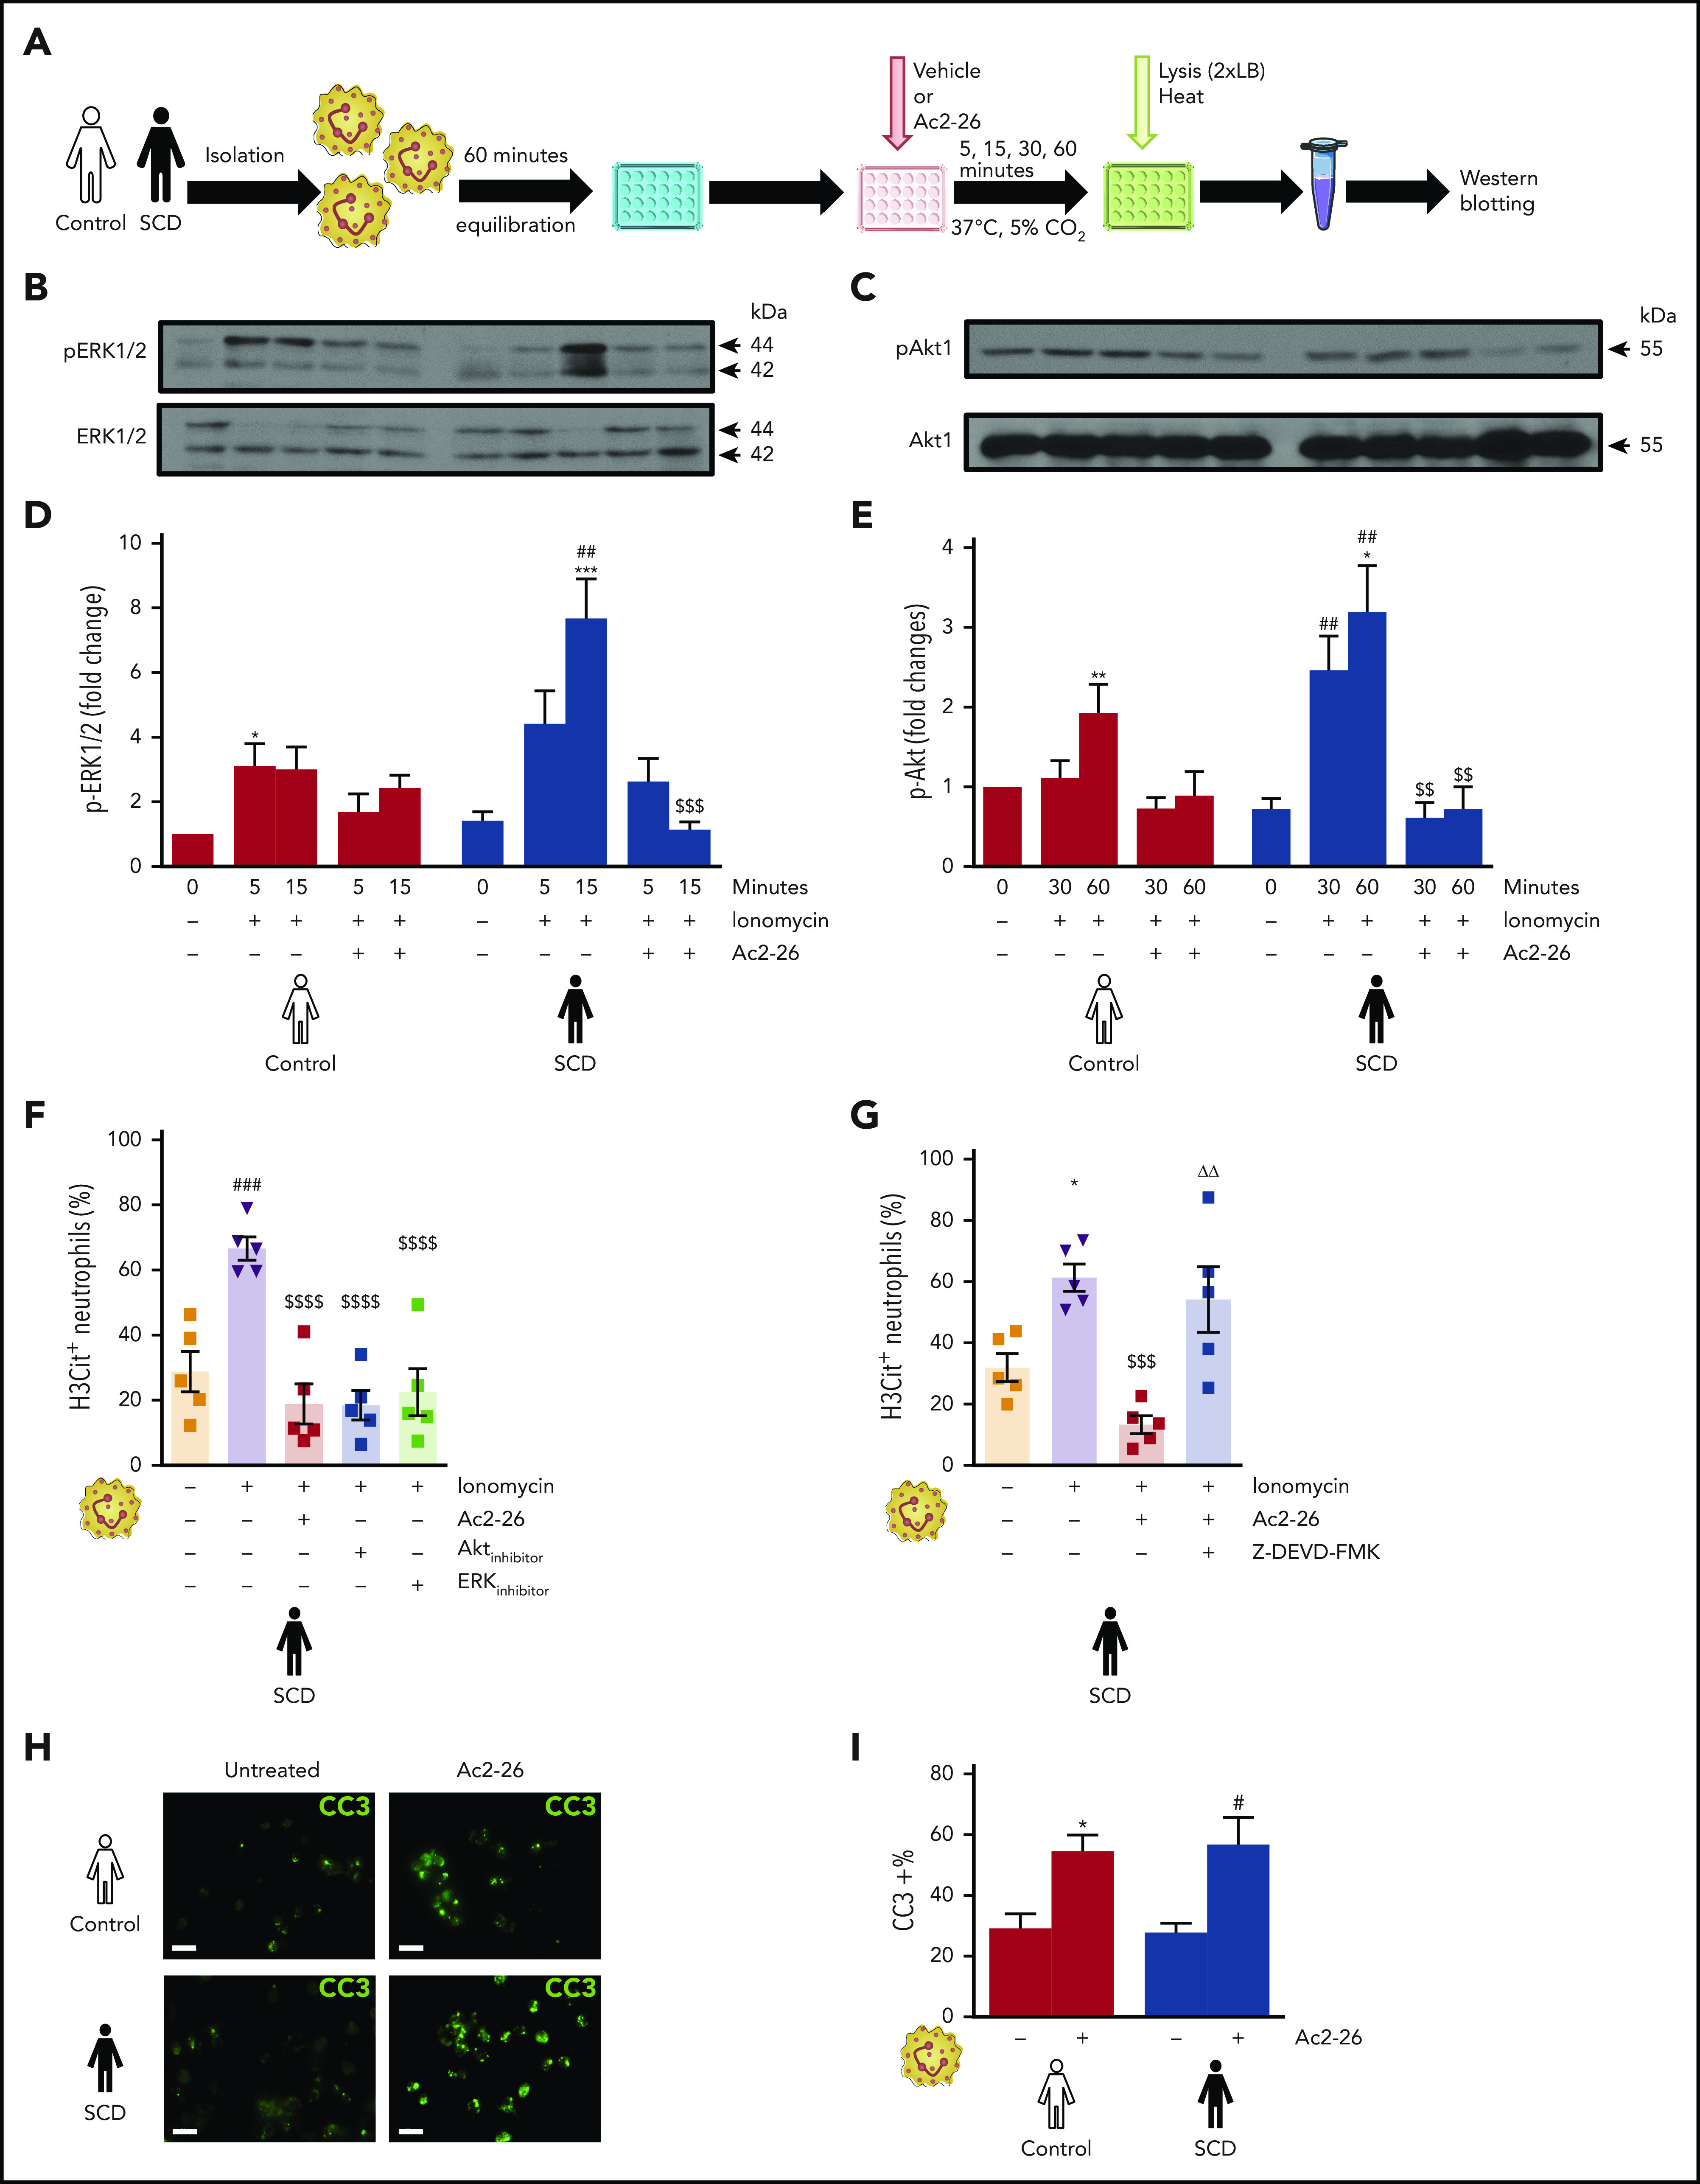
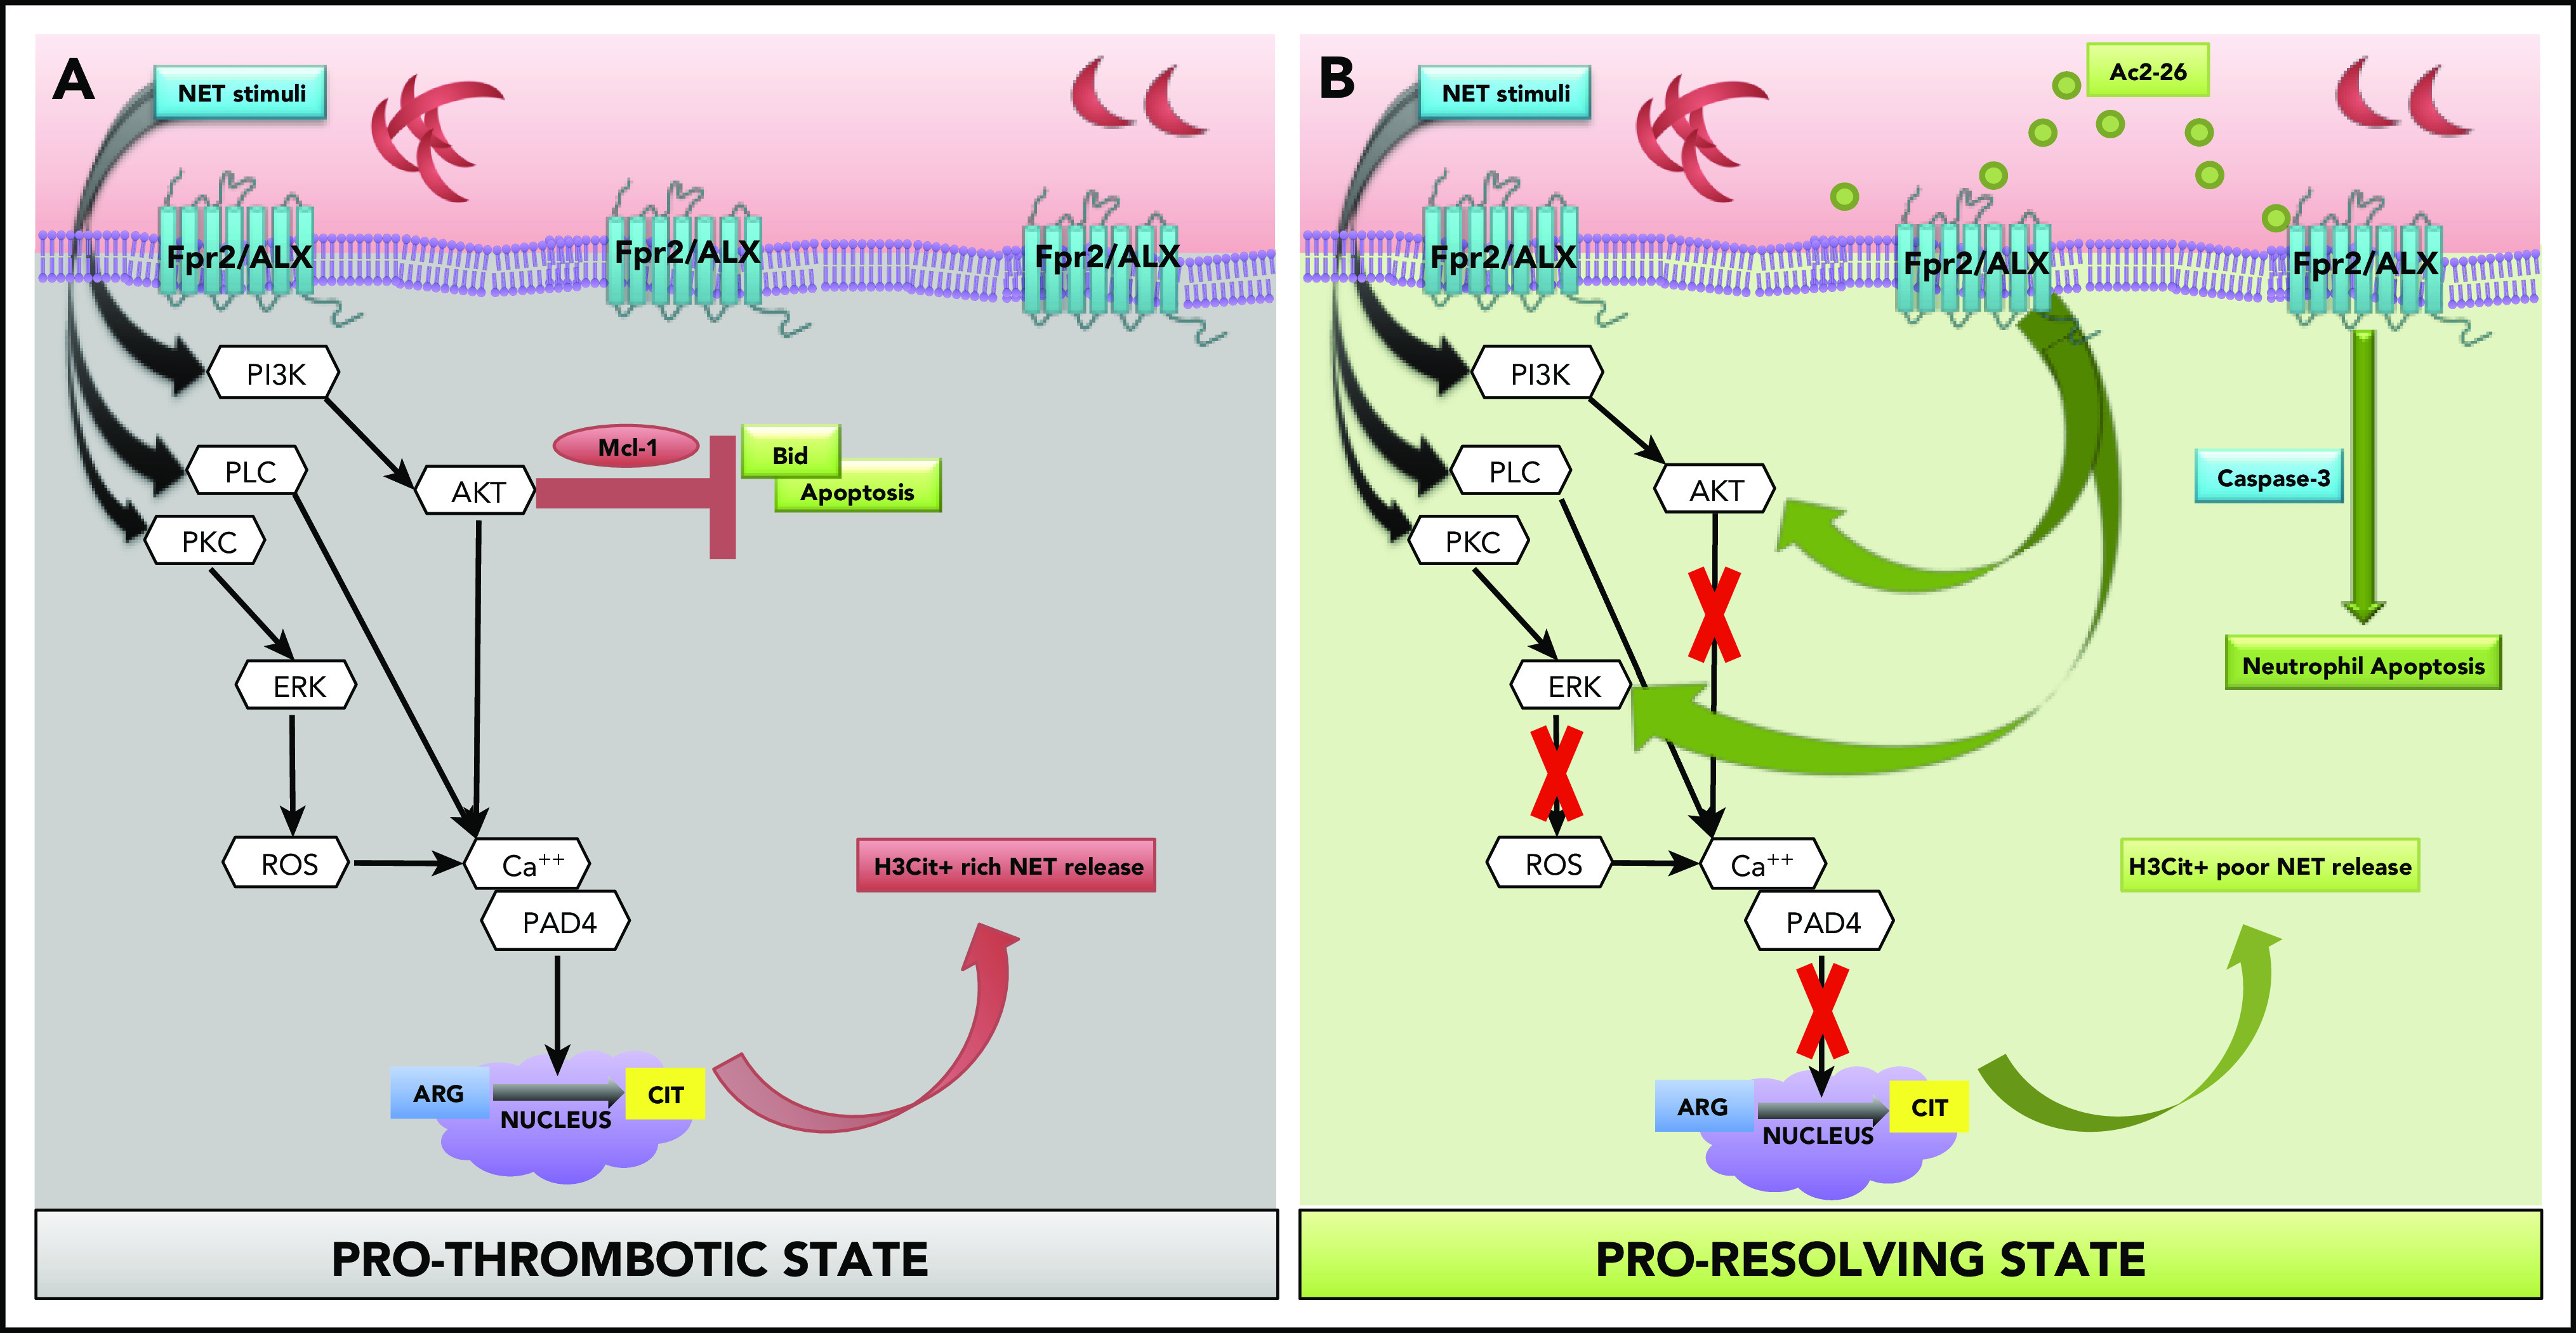
Neutrophils play a crucial role in the intertwined processes of thrombosis and inflammation. An altered neutrophil phenotype may contribute to inadequate resolution, which is known to be a major pathophysiological contributor of thromboinflammatory conditions such as sickle cell disease (SCD). The endogenous protein annexin A1 (AnxA1) facilitates inflammation resolution via formyl peptide receptors (FPRs). We sought to comprehensively elucidate the functional significance of targeting the neutrophil-dependent AnxA1/FPR2/ALX pathway in SCD. Administration of AnxA1 mimetic peptide AnxA1Ac2-26 ameliorated cerebral thrombotic responses in Sickle transgenic mice via regulation of the FPR2/ALX (a fundamental receptor involved in resolution) pathway. We found direct evidence that neutrophils with SCD phenotype play a key role in contributing to thromboinflammation. In addition, AnxA1Ac2-26 regulated activated SCD neutrophils through protein kinase B (Akt) and extracellular signal-regulated kinases (ERK1/2) to enable resolution. We present compelling conceptual evidence that targeting the AnxA1/FPR2/ALX pathway may provide new therapeutic possibilities against thromboinflammatory conditions such as SCD.


Conflict of interest statement

Conflict-of-interest disclosure: The authors declare no competing financial interests.

Figures

None
Graphical abstract
Figure 1.
Figure 1.
AnxA1Ac2-26 rescues enhanced cerebral thrombus formation. STM and control mice were subjected to light/dye-induced thrombosis with intravenous infusion of 10 mg/kg 5% FITC-dextran followed by photoactivation of cerebral microvessels. (A-D) Images of onset (start of platelet aggregation) and cessation (complete stop of flow for ≥30 seconds) of thrombus formation in control mice and STM. Bars represent 20 μm. The mice were treated with vehicle (saline), AnxA1Ac2-26 (100 μg per mouse), AnxA1Ac2-26+Boc2 (100 μg per mouse + 10 μg per mouse), or AnxA1Ac2-26+WRW4 (100 μg per mouse + 55 μg per mouse), and subjected to light/dye-induced thrombosis, and time of flow cessation (minutes) was quantified in cerebral (E) arterioles and (F) venules. Data are means ± SEM (6-7 mice per group). ***P < .001; ****P < .0001 vs controls. $$$P < .001; $$$$P < .0001 vs STM controls. ΔΔP < .01; ΔΔΔP < .001 vs STM+AnxA1Ac2-26–treated mice.
Figure 2.
Figure 2.
Neutrophils contribute to cerebral thrombosis in experimental thromboinflammation and exhibit enhanced extracellular DNA activity. Schematic representation of neutrophil transfer from donor control and STM into neutropenic ANS recipient STM followed by light/dye-induced thrombosis (A1-3) time of flow cessation was quantified in cerebral arterioles (B) and venules (C). (D) Cerebral microvessels were analyzed after DNase (2000 U) treatment (n = 4-6 mice/group). (E) Plasma levels of circulating annexin A1 (n = 6 each) were also determined in control mice and STM. (F) NE DNA complex (NE-DNA) levels were determined by ELISA in plasma from saline (vehicle) and AnxA1Ac2-26-treated mice (n = 12 saline-treated and n = 6 AnxA1Ac2-26–treated control and STM). Two values for control-AnxA1Ac2-26 and 1 value for STM-AnxA1Ac2-26 were under detectable levels and are not included. (G) Percentage of histone H3 (H3Cit+)–positive unstimulated (n = 10 [1 outlier removed]; n = 10 STM [1 outlier removed]) and ionomycin-stimulated (n = 10 control; n = 7 STM; 4 µM) neutrophils. Data are as means ± SEM from independent experiments. *P < .05; **P < .01 vs control mice. #P < .05; ###P < .001 vs STM. @@P < .01 vs unstimulated STM neutrophils. $P < .05 vs stimulated STM neutrophils. ØP < .05 vs STM+ANS. ΦP < .05 vs STM+ANS+ control neutrophils.
Figure 3.
Figure 3.
SCD-associated enhanced H3Cit+ neutrophils can be inhibited by AnxA1Ac2-26. (A) Neutrophil isolation and NET analysis. (B) Images of NETs: H3Cit (green/Alexa Fluor 488), NE (red/Alexa Fluor 568), and nucleus (4′,6-diamidino-2-phenylindole). Bars in main images represent 100 µm; in insets, 10 µm. (C) Percentage of NETs hypercitrullinated at histone H3 (H3Cit+) quantified from unstimulated and ionomycin-stimulated neutrophils from control volunteers (unstimulated [n = 10], 1 outlier removed; and stimulated [n = 10], 1 outlier removed) and from patients with SCD (unstimulated [n = 10]; and stimulated [n = 14]). (D) Plasma levels of circulating annexin A1 (n = 5, 6 respectively) were determined in control volunteers and patients with SCD. Statistical significance was determined by unpaired Student t test and presented as *P < .05 vs control volunteers. (E) Percentage of H3Cit+ ionomycin-stimulated neutrophils from control volunteers (n = 8 vehicle and n = 9 AnxA1Ac2-26 pretreatment) and patients with SCD (n = 14 vehicle, n = 9 AnxA1Ac2-26, n = 10 AnxA1Ac2-26+Boc-2, and n = 9 AnxA1Ac2-26+WRW4). Data are means ± SEM from independent experiments. *P < .05; **P < .01 vs control unstimulated neutrophils. ####P < .0001 vs SCD unstimulated neutrophils. $$$$P < .001 vs ionomycin-stimulated SCD neutrophils. ΔP < .05; ΔΔP < .01 vs SCD+AnxA1Ac2-26–treated SCD neutrophils. φφφP < .001 vs stimulated control neutrophils.
Figure 4.
Figure 4.
AnxA1Ac2-26 dampens ERK and Akt activation in neutrophils isolated from patients with SCD and activates cleaved caspase-3. (A) Procedure for sample preparation for western blot analysis. Representative western blots of neutrophils from control volunteers and patients with SCD for ERK (B) and Akt (C) activation after AnxA1Ac2-26 treatment and ionomycin stimulation. Densitometric analysis of p-ERK/total ERK (D; n = 5) and p-Akt/total Akt (E; [n = 4]. One outlier [defined as ≥2 standard deviations] removed from control ionomycin+AnxA1Ac2-26 [30 minutes]). (F-G) Percentage of H3Cit+ SCD neutrophils after stimulation with ionomycin (4 µM, 3 hours), with/without pretreatment with AnxA1Ac2-26 (30 µM, 15 minutes) and Akt (10 µM, 30 minutes), ERK (10 µM, 60 minutes), or caspase-3 (Z-DEVD-FMK, 20 µM, 45 minutes) inhibitors (n = 5 each group). (H) Representative immunofluorescence images of cleaved caspase-3 staining from SCD neutrophils with/without AnxA1Ac2-26 (30 μM) treatment. Scale bar, 100 µm. (I) Percentage of cleaved caspase-3+ neutrophils from control and patients with SCD with/without AnxA1Ac2-26 treatment (n = 5). Data expressed as mean ± SEM from independent experiments. *P < .05; **P < .01; ***P < .001 vs unstimulated control neutrophils. #P < .05; ##P < .01 vs unstimulated SCD neutrophils. $$P < .01; $$$P < .001; $$$$P < .0001 vs ionomycin-stimulated SCD neutrophils at the corresponding time points. ΔΔP < .01 vs AnxA1Ac2-26-pretreated, ionomycin-stimulated SCD neutrophils.
Figure 5.
Figure 5.
Schematic of proposed mechanisms. (A) Our data show that SCD neutrophils produce increased NETs, which are exacerbated upon stimulation (eg, ionomycin), leading to increased phosphorylation of NET specific kinases (ERK and Akt), which has been shown to result in histone citrullination and inhibition of apoptosis via upregulation of antiapoptotic proteins (eg, Mcl-1 [prothrombotic state]). Peptidylarginine deiminase 4 (PAD4) forms a complex with intracellular calcium to catalyze histone citrullination. NET stimuli activate PKC, PLC, and PI3K, which in turn activate ERK and AKT, resulting in calcium-PAD4 complex formation, which catalyzes histone citrullination. (B) We found that AnxA1Ac2-26 interacts with Fpr2/ALX, suppressing ERK and Akt phosphorylation, preventing histone citrullination, and enabling apoptosis by activating caspase-3 (proresolving state). Mcl-1, myeloid cell leukemia protein-1; PI3K, phosphatidylinositol-4,5-bisphosphate 3-kinase; PKC, protein kinase C; PLC, phospholipase C.

Comment in

  • Resolving thromboinflammation.
    McAdoo SP, Dhaun N. McAdoo SP, et al. Blood. 2021 Mar 18;137(11):1444-1446. doi: 10.1182/blood.2020010627. Blood. 2021. PMID: 33734338 No abstract available.

References

    1. Jackson SP, Darbousset R, Schoenwaelder SM. Thromboinflammation: challenges of therapeutically targeting coagulation and other host defense mechanisms. Blood. 2019;133(9):906-918. - PubMed
    1. Esmon CT. Crosstalk between inflammation and thrombosis. Maturitas. 2004;47(4):305-314. - PubMed
    1. Zhang D, Xu C, Manwani D, Frenette PS. Neutrophils, platelets, and inflammatory pathways at the nexus of sickle cell disease pathophysiology. Blood. 2016;127(7):801-809. - PMC - PubMed
    1. Hess K, Grant PJ. Inflammation and thrombosis in diabetes. Thromb Haemost. 2011;105(S 06 suppl 1):S43-S54. - PubMed
    1. Wolach O, Sellar RS, Martinod K, et al. . Increased neutrophil extracellular trap formation promotes thrombosis in myeloproliferative neoplasms. Sci Transl Med. 2018;10(436):eaan8292. - PMC - PubMed

Publication types

MeSH terms