

Association of Social and Demographic Factors With COVID-19 Incidence and Death Rates in the US
- PMID: 33512520
- PMCID: PMC7846939
- DOI: 10.1001/jamanetworkopen.2020.36462
Association of Social and Demographic Factors With COVID-19 Incidence and Death Rates in the US
Abstract
Importance: Descriptive data have revealed significant racial/ethnic disparities in coronavirus disease 2019 (COVID-19) cases in the US, but underlying mechanisms of disparities remain unknown.
Objective: To examine the association between county-level sociodemographic risk factors and US COVID-19 incidence and mortality.
Design, setting, and participants: This cross-sectional study analyzed the association between US county-level sociodemographic risk factors and COVID-19 incidence using mixed-effects negative binomial regression, and COVID-19 mortality using zero-inflated negative binomial regression. Data on COVID-19 incidence and mortality were collected from January 20 to July 29, 2020. The association of social risk factors with weekly cumulative incidence and mortality was also examined by interacting time with the index measures, using a random intercept to account for repeated measures.
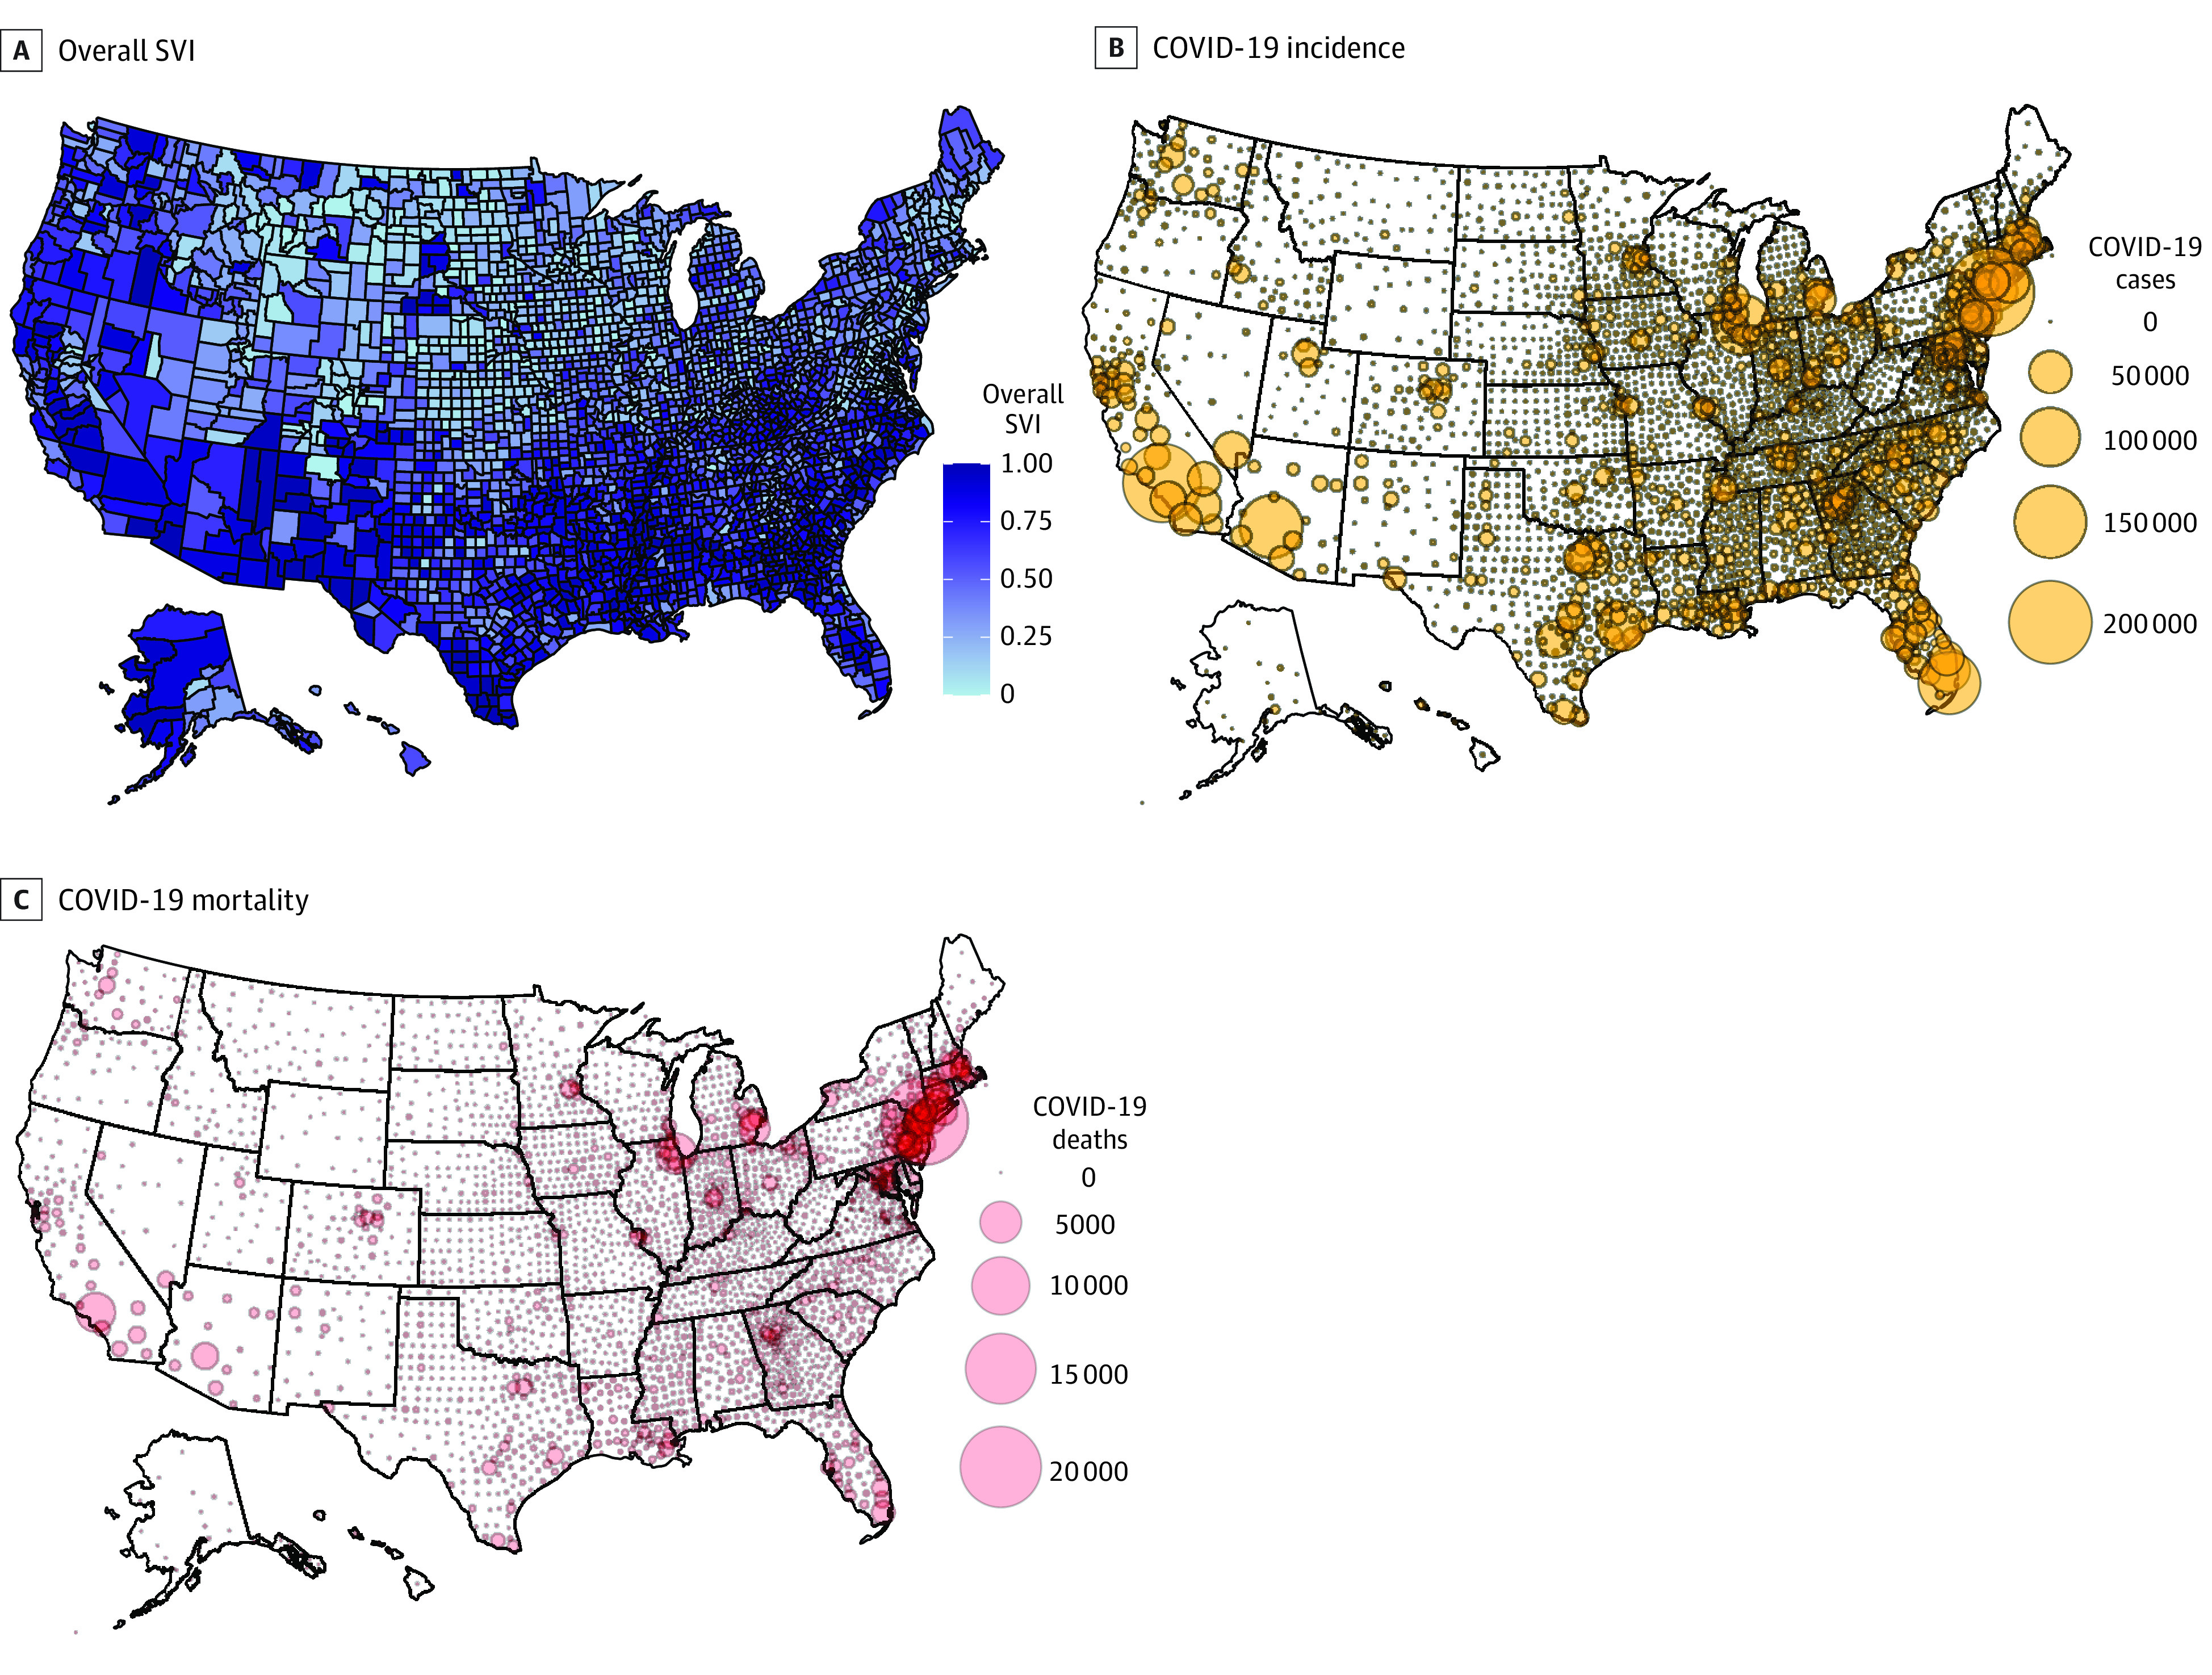
Main outcomes and measures: Sociodemographic data from publicly available data sets, including the US Centers for Disease Control and Prevention's Social Vulnerability Index (SVI), which includes subindices of socioeconomic status, household composition and disability, racial/ethnic minority and English language proficiency status, and housing and transportation.
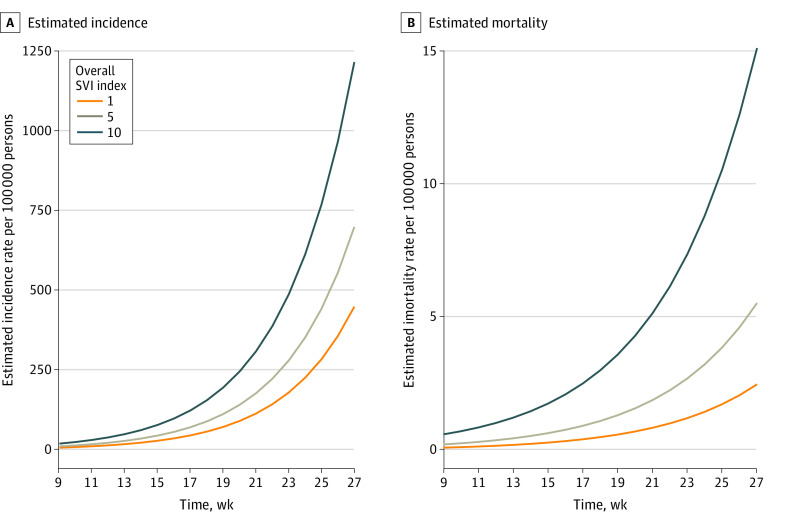
Results: As of July 29, 2020, there were a total of 4 289 283 COVID-19 cases and 147 074 COVID-19 deaths in the US. An increase of 0.1 point in SVI score was associated with a 14.3% increase in incidence rate (incidence rate ratio [IRR], 1.14; 95% CI, 1.13-1.16; P < .001) and 13.7% increase in mortality rate (IRR, 1.14; 95% CI, 1.12-1.16; P < .001), or an excess of 87 COVID-19 cases and 3 COVID-19 deaths per 100 000 population for a SVI score change from 0.5 to 0.6 in a midsize metropolitan county; subindices were also associated with both outcomes. A 0.1-point increase in the overall SVI was associated with a 0.9% increase in weekly cumulative increase in incidence rate (IRR, 1.01; 95% CI, 1.01-1.01; P < .001) and 0.5% increase in mortality rate (IRR, 1.01; 95% CI, 1.01-1.01; P < .001).
Conclusions and relevance: In this cross-sectional study, a wide range of sociodemographic risk factors, including socioeconomic status, racial/ethnic minority status, household composition, and environmental factors, were significantly associated with COVID-19 incidence and mortality. To address inequities in the burden of the COVID-19 pandemic, these social vulnerabilities and their root causes must be addressed.
Conflict of interest statement
Figures
References
-
- Michigan Department of Health and Human Services Coronavirus: Michigan data. Accessed June 1, 2020. https://www.michigan.gov/coronavirus/0,9753,7-406-98163_98173--,00.html
Publication types
MeSH terms
LinkOut - more resources
Full Text Sources
Other Literature Sources
Medical
Research Materials
