. 2021 Feb;95(2):591-615.
doi: 10.1007/s00204-020-02970-5. Epub 2021 Jan 29.

Neurotoxicity and underlying cellular changes of 21 mitochondrial respiratory chain inhibitors

Affiliations

Neurotoxicity and underlying cellular changes of 21 mitochondrial respiratory chain inhibitors

Johannes Delp et al. Arch Toxicol. 2021 Feb.

Abstract

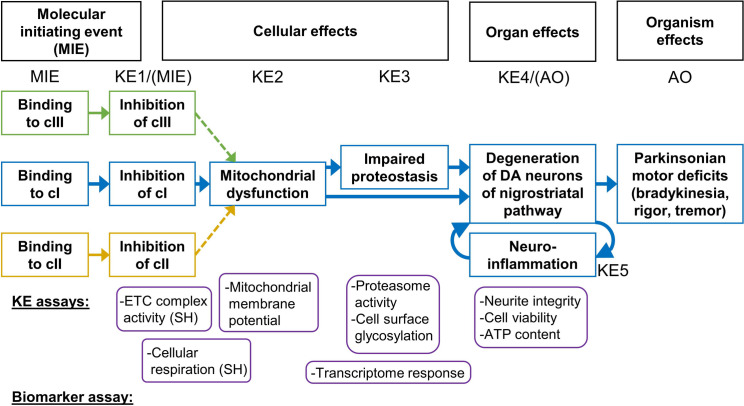
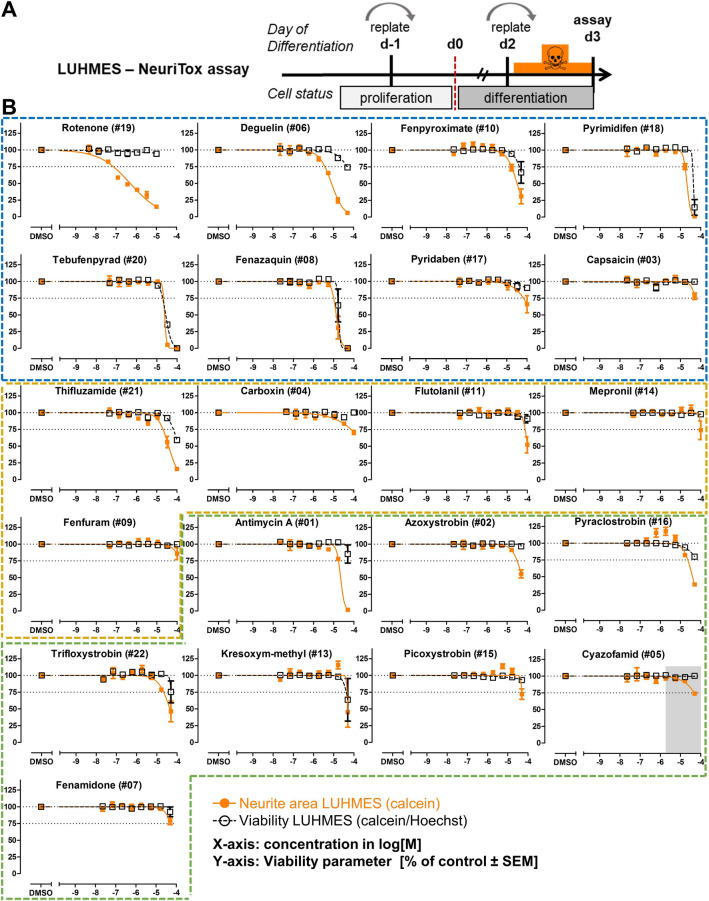
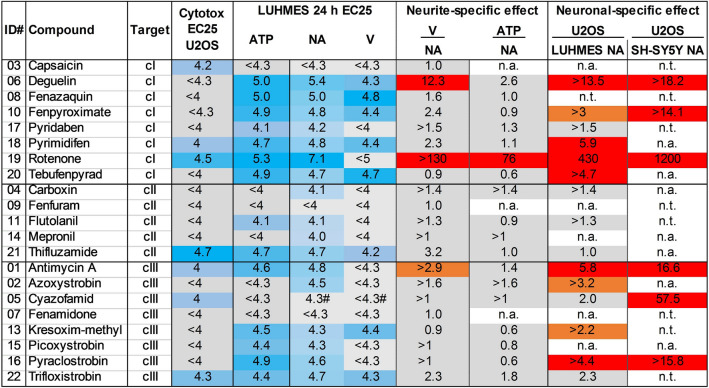
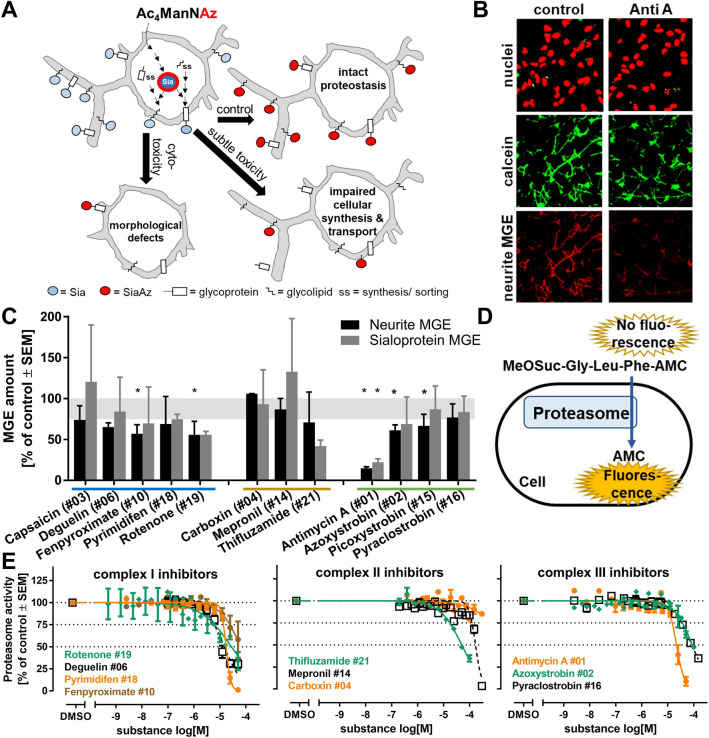
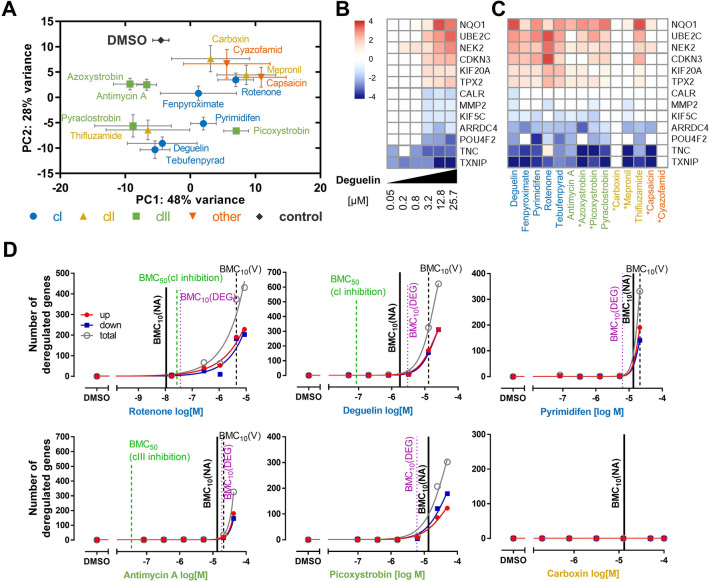
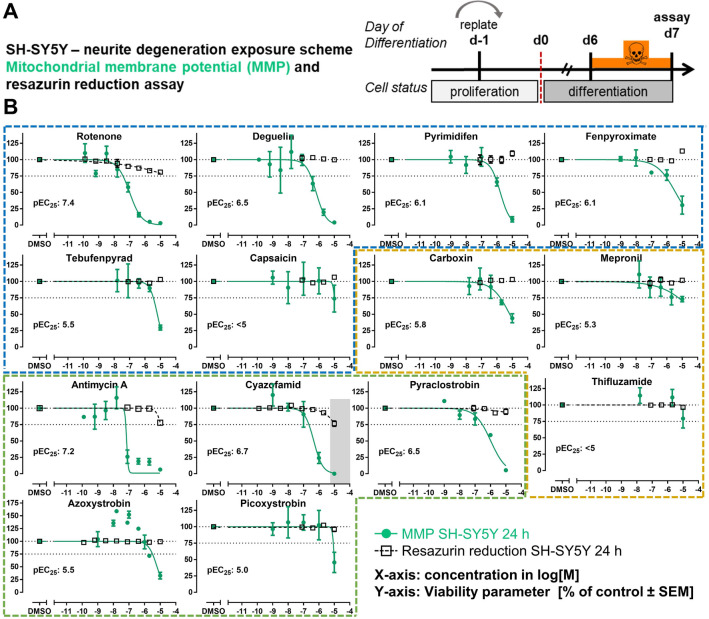
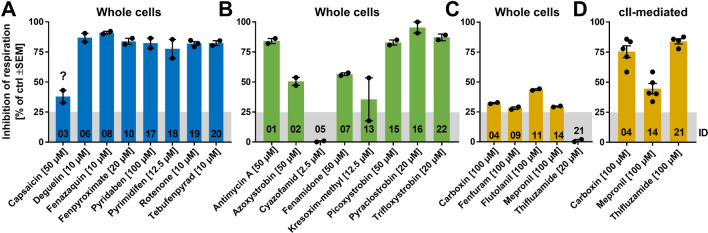
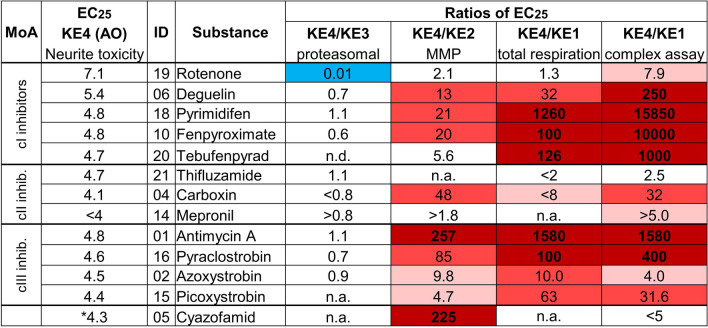
Inhibition of complex I of the mitochondrial respiratory chain (cI) by rotenone and methyl-phenylpyridinium (MPP +) leads to the degeneration of dopaminergic neurons in man and rodents. To formally describe this mechanism of toxicity, an adverse outcome pathway (AOP:3) has been developed that implies that any inhibitor of cI, or possibly of other parts of the respiratory chain, would have the potential to trigger parkinsonian motor deficits. We used here 21 pesticides, all of which are described in the literature as mitochondrial inhibitors, to study the general applicability of AOP:3 or of in vitro assays that are assessing its activation. Five cI, three complex II (cII), and five complex III (cIII) inhibitors were characterized in detail in human dopaminergic neuronal cell cultures. The NeuriTox assay, examining neurite damage in LUHMES cells, was used as in vitro proxy of the adverse outcome (AO), i.e., of dopaminergic neurodegeneration. This test provided data on whether test compounds were unspecific cytotoxicants or specifically neurotoxic, and it yielded potency data with respect to neurite degeneration. The pesticide panel was also examined in assays for the sequential key events (KE) leading to the AO, i.e., mitochondrial respiratory chain inhibition, mitochondrial dysfunction, and disturbed proteostasis. Data from KE assays were compared to the NeuriTox data (AO). The cII-inhibitory pesticides tested here did not appear to trigger the AOP:3 at all. Some of the cI/cIII inhibitors showed a consistent AOP activation response in all assays, while others did not. In general, there was a clear hierarchy of assay sensitivity: changes of gene expression (biomarker of neuronal stress) correlated well with NeuriTox data; mitochondrial failure (measured both by a mitochondrial membrane potential-sensitive dye and a respirometric assay) was about 10-260 times more sensitive than neurite damage (AO); cI/cIII activity was sometimes affected at > 1000 times lower concentrations than the neurites. These data suggest that the use of AOP:3 for hazard assessment has a number of caveats: (i) specific parkinsonian neurodegeneration cannot be easily predicted from assays of mitochondrial dysfunction; (ii) deriving a point-of-departure for risk assessment from early KE assays may overestimate toxicant potency.

Keywords: AOP:3; High-content imaging; In vitro neurotoxicity; Mechanistic safety assessment; Mitotoxicity; TempO-Seq.


Conflict of interest statement

The authors declare that there is no conflict of interest.

Figures

Fig. 1
Fig. 1
Depiction of AOP#03 with potential extensions. The adverse outcome pathway (AOP) #03 (“Inhibition of the mitochondrial complex I of nigrostriatal neurons leads to parkinsonian motor deficits”) is characterized by a sequence of key events (KE) that cause mitochondrial dysfunction and finally lead to parkinsonian motor symptoms via the selective loss of dopaminergic neurons. For mitochondrial respiratory chain complex II (cII) and cIII inhibitors, it is hypothesized that triggering their molecular initiating event (MIE) will cause mitochondrial dysfunction and might thereby trigger the same AO as cI inhibitors. Overlay of the common KE (mitochondrial dysfunction) may lead to an AOP network as displayed; modified after (Terron et al. 2018). The KE assays and biomarkers used in this study are shown below the AOP network. Note that for this particular AOP, KE1 and MIE are probed by the same assay. Moreover, KE4 qualifies as an alternative adverse outcome in classical animal studies, and it may be considered as AO for in vitro testing
Fig. 2
Fig. 2
Application of the NeuriTox test as KE4 assay to identify dopaminergic neurotoxicants (AO). a LUHMES cells were differentiated for 48 h, and treated for 24 h after replating during their differentiation phase. Neurite outgrowth (NA, orange) and viability (V, black) were assessed on day 3 (d3) of differentiation by automated high-content imaging with calcein/H-33342 staining. b Graphs for individual compounds were ordered according to the described mode of action of the test compounds (cI, II, III inhibitors in blue, yellow, and green boxes) and their potency within their group. Gray area: compound was insoluble in that concentration range. Data are means ± SEM from three independent experiments. The NeuriTox assay has an established prediction model, in which reductions of the neurite area by ≥ 25% are considered as (positive) hit (Delp et al. 2018a, b). Therefore, significance was not tested for individual data points, but the threshold is indicated by dotted lines (color figure online)
Fig. 3
Fig. 3
Assessment of neurite degeneration in SH-SY5Y cells after either 24 or 120 h exposure. a For the short exposure scenario (left), SH-SY5Y cells were differentiated for 6 days and treated once for 24 h (green). For the long-exposure scenario (right), the cells were differentiated for 3 days, subsequently treated 3 days, and retreated for another 2 days (brown). Neurite length and viability (black) were determined on day 7 (24 h exposure) or day 8 (120 h exposure), using high-content imaging and calcein/propidium iodide staining. b Concentration–response graphs for cI (blue), cII (yellow), and cIII (green) inhibitors, ordered according to the compounds’ potency within their MoA group. Note: only the 120 h viability data were plotted, since a 24 h exposure did not affect viability under any condition tested. Data are means ± SEM from three independent experiments (color figure online)
Fig. 4
Fig. 4
Synoptic overview of measures of specific neurotoxicity. Compounds are grouped according to their MoA. Columns 4–7 of the table indicate the potency of the test compounds for different test endpoints, are given in − log[M], and refer to the EC25 values. Concentrations were coded from intense blue (= highly active, low concentration) to light blue (= less active, high concentration); when the highest tested concentration did not result in 25% effect, the cell was colored gray. Columns 8–11 give potency ratios, calculated using potency data in their non-logarithmic form. Ratios were colored according to the established prediction model of the NeuriTox test, i.e., red if > 4 (= specific neurotoxicity), gray if < 4, i.e., unspecific, and orange if the ratio could not be fully calculated due to a lack of effect in the assessed concentrations, but was ≥ 2. Unspecific cytotoxicity was assessed using U2OS cells (osteosarcoma; treated for 24 h, cytotoxicity was measured by luminescence of constitutively expressed luciferase). The LUHMES 24 h endpoints were generated following the NeuriTox exposure scheme as in Fig. 2; the SH-SY5Y endpoint was determined by treating the cells for 120 h (data taken from Fig. 3). cI-III: electron transport chain complex I, II, or III; V: viability; NA: neurite area, n.t.: not tested; n.a.: ratio could not be calculated as compound did not trigger toxicity; #: cyazofamid was found to precipitate in the active concentration range; thus, it was considered to be inactive (color figure online)
Fig. 5
Fig. 5
Assessment of proteostasis endpoints. a Proteostasis consists of several processes, including synthesis, sorting, and glycosylation of lipids and proteins. These are assessed by the NeuroGlycoTest, which is based on metabolic glycoengineering (MGE), i.e., feeding of modified mannosamine sugars (peracetylated N-azidoacetylmannosamine, Ac4ManNAz) to cells. These are used instead of their natural analogs (N-acetylmannosamine, ManNAc) by glycosylation enzymes. These sugars become covalently linked to the proteins and lipids (as azide-modified sialic acid: SiaAz/Sia), and are then transported to the cell membrane. If toxic compounds interfere with any step of this proteostatic process, a reduced cell surface glycosylation can be detected (modified from (Kranaster et al. 2020)). b Example pictures of LUHMES cells treated for 6 h with 50 µM antimycin A (Anti A) or vehicle control. The first row shows nuclei stained with H-33342 as control for cell number and viability. The second row shows neurites stained with calcein (cell bodies were removed by image analysis algorithm). The third row displays the labeled sialic acids (as stained by MGE and a subsequent color reaction) on neurites. Pictures have a width of 166 µm. c A subset of 14 test compounds was investigated at their highest non-toxic concentration (concentrations given in Suppl. Figure 4) for effects on the sialic acid content on the surface of neurites (neurite MGE). As second endpoint, cells were lysed and the total amount of MGE labeled sialoproteins was determined by Western blot (sialoprotein MGE). Both endpoints were normalized to DMSO controls of two independent experiments. Error bards indicate the data range. To identify significant changes, a one-way ANOVA followed by Fisher’s LSD test was performed, *: p < 0.05. d To investigate the proteasomal activity as alternative indicator of proteostasis, d2 LUHMES cells were incubated with toxicants for 22 h. Subsequently, cell culture medium was replaced by assay buffer containing a cell-permeable proteasomal substrate. The coumarin fluorescence (AMC) generated by the proteasomal activity was quantified as described earlier (Gutbier et al. 2018b). e The proteasome activity was determined for selected cI-III inhibitors. Data are means ± SEM from three to four independent experiments
Fig. 6
Fig. 6
Investigation of altered mRNA transcripts as biomarker for mitochondrial respiratory chain impairment. a LUHMES cells were differentiated for 48 h and subsequently treated for 24 h. Analysis of the transcriptome (mRNA expression) was performed using Biospyder’s TempO-Seq technique. Test concentrations were the highest non-cytotoxic levels according to the NeuriTox assay. For non-cytotoxic compounds within the testing range, the highest possible concentration, i.e., 100 or 50 µM, was chosen (marked *). To visualize the overall data structure, a principal component (PC) analysis was performed. The 100 most variable genes were used to calculate the coordinates of PC1 and PC2, replicate values were plotted as mean ± SEM from 3 independent differentiations. Color-coding was applied based on the compounds’ MoA (respiratory chain complex inhibition), the PCA axes dimensioning was adjusted according to the variance explained by the individual PCs. b Genes regulated by deguelin as typical complex I inhibitor with strong transcriptional response were identified for EC10V (13 µM) and for a 4 × lower concentration (3.25 µM). The 13 overlap genes were considered to be regulated by definitely non-cytotoxic concentrations. They were used for expression analysis over the entire concentration range (26–0.05 µM). Upregulation by deguelin was color-coded red, down-regulation in blue, using a diverging scale of log2 fold change values. Regulations that had an FDR-corrected p value > 0.1 were colored white; data were from three independent differentiations; DEG were determined vs DMSO controls. c The regulation of the “deguelin-sensitive genes” identified in b) was investigated for all 14 compounds (tested at their EC10V concentration, if this was not reached, the highest tested concentration was used. b + c The mean fold change in expression relative to control from three independent differentiations was color-coded: blue indicates down-regulation, red indicates up-regulation, and white indicates that the regulation had an FDR-adjusted p value > 0.1. Compound colors indicate their target (cI, cIII, cII, other). d Concentration–response analysis of significantly differentially expressed genes (DEG). As reference values, the BMC50 concentrations of the respective respiratory chain complex inhibition (assessed in LUHMES cells) as well as the EC10 of viability [BMC10(V)] and neurite outgrowth impairment [BMC10(NA)] have been added (vertical dashed lines). DEG were defined by > 1.5-fold regulation (0.59 on log2 scale) and an FDR-corrected p value < 0.05 (data from three independent differentiations). The dotted pink line indicates the “BMC10” of gene regulation [BMC10(DEG)]. To determine this value, the degree of gene expression homeostasis (DGH) was defined as DGH = 100-number of deregulated genes; with a lower limit of DGH set to 0. The concentration-dependent DGH values were used as input for an algorithm to determine benchmark concentrations (Krebs et al. 2020) [http://invitrotox.uni-konstanz.de/BMC/] and BMC10 values were retrieved (color figure online)
Fig. 7
Fig. 7
Investigation of mitochondrial membrane potential (MMP) and resazurin reduction impairment to assess KE2. a SH-SY5Y cells were differentiated for 6 days and subsequently treated for 24 h. Endpoints were determined using either rhodamine-123 for MMP (green) or resazurin reduction for overall viability (black). b Concentration–response graphs for the subset of cI (blue), cII (yellow), and cIII (green) inhibitors, ordered according to the compounds’ potency within their MoA group. Data are means ± SEM from three independent experiments. The numbers in the graphs indicate the EC25 for MMP (crossing point of MMP curve fit with dotted line at 75%). These data are used for downstream data comparisons as KE2 output. pEC25: − log[M] concentration where MMP was reduced by 25% (color figure online)
Fig. 8
Fig. 8
Quantification of respiration of intact and permeabilized LUHMES cells. a–c As assay to assess MIE, KE1, and KE2, intact (whole cells) d3-differentiated LUHMES cells were acutely treated with the indicated inhibitors at their highest non-cytotoxic concentration and changes in mitochondrial oxygen consumption rate were quantified. Compounds are grouped and color-coded according to their MoA (inhibitors of cI, III, and II in blue, green, yellow). d Inhibition of cII activity by cII inhibitors was assessed using permeabilized LUHMES cells as depicted in Suppl. Figure 7. The assay specifically assesses cII activity. The numbers at the bottom of the bars indicate the compound ID. Bars represent means ± SEM, and each point represents the result of an independent experiment. The gray area is the negative control noise band of the assay as defined in (Delp et al. 2019), i.e., inhibition within this range is regarded to be insignificant (color figure online)
Fig. 9
Fig. 9
Synoptic overview of the sensitivities of different assays along the AOP. Synoptic overview of the EC25 concentrations (in − log[M]) of different assays along the AOP for the subset of 14 toxicants which have been characterized in depth. Anchoring point is the EC25 concentration for neurite outgrowth impairment of the NeuriTox test for KE4 (in vitro proxy for the AO). EC25 concentrations of other KE assays were displayed as ratio (e.g., KE4/KE1) and colored in faint red if > 3, in red if > 10 and dark red if > 100 (i.e., when upstream KE1-3 assay was more sensitive than KE4) and blue if < 0.33 (i.e., upstream KE3 was less sensitive than KE4) or white for ratios between 3 and 1/3. Note: data on respirometric inhibition were retrieved from HepG2-based assays (van der Stel et al. 2020); n.a.: ratio could not be determined due to low effects; n.d.: not determined. Cyazofamid was in this study not confirmed to be a cIII inhibitor

Similar articles

Cited by

References

    1. Allen TE, Goodman JM, Gutsell S, Russell PJ. Defining molecular initiating events in the adverse outcome pathway framework for risk assessment. Chem Res Toxicol. 2014;27(12):2100–2112. doi: 10.1021/tx500345j. - DOI - PubMed
    1. Bal-Price A, Lein PJ, Keil KP, et al. Developing and applying the adverse outcome pathway concept for understanding and predicting neurotoxicity. Neurotoxicology. 2017;59:240–255. doi: 10.1016/j.neuro.2016.05.010. - DOI - PMC - PubMed
    1. Bal-Price A, Leist M, Schildknecht S, Tschudi-Monnet F, Paini A, Terron A (2018) Adverse outcome pathway on inhibition of the mitochondrial complex I of nigro-striatal neurons leading to parkinsonian motor deficits. OECD Publishing, Paris. 10.1787/b46c3c00-en
    1. Blacker TS, Duchen MR. Investigating mitochondrial redox state using NADH and NADPH autofluorescence. Free Radic Biol Med. 2016;100:53–65. doi: 10.1016/j.freeradbiomed.2016.08.010. - DOI - PMC - PubMed
    1. Blecha J, Novais SM, Rohlenova K, et al. Antioxidant defense in quiescent cells determines selectivity of electron transport chain inhibition-induced cell death. Free Radic Biol Med. 2017;112:253–266. doi: 10.1016/j.freeradbiomed.2017.07.033. - DOI - PubMed

Publication types

MeSH terms

LinkOut - more resources