Clinical Trial
. 2020 Dec;11(12):e00274.
doi: 10.14309/ctg.0000000000000274.

Randomized, Placebo Controlled Trial of Experimental Hookworm Infection for Improving Gluten Tolerance in Celiac Disease

Affiliations
Clinical Trial

Randomized, Placebo Controlled Trial of Experimental Hookworm Infection for Improving Gluten Tolerance in Celiac Disease

John Croese et al. Clin Transl Gastroenterol. 2020 Dec.

Abstract

Introduction: Celiac disease is an autoimmune disorder where intestinal immunopathology arises after gluten consumption. Previous studies suggested that hookworm infection restores gluten tolerance; however, these studies were small (n = 12) and not placebo controlled.

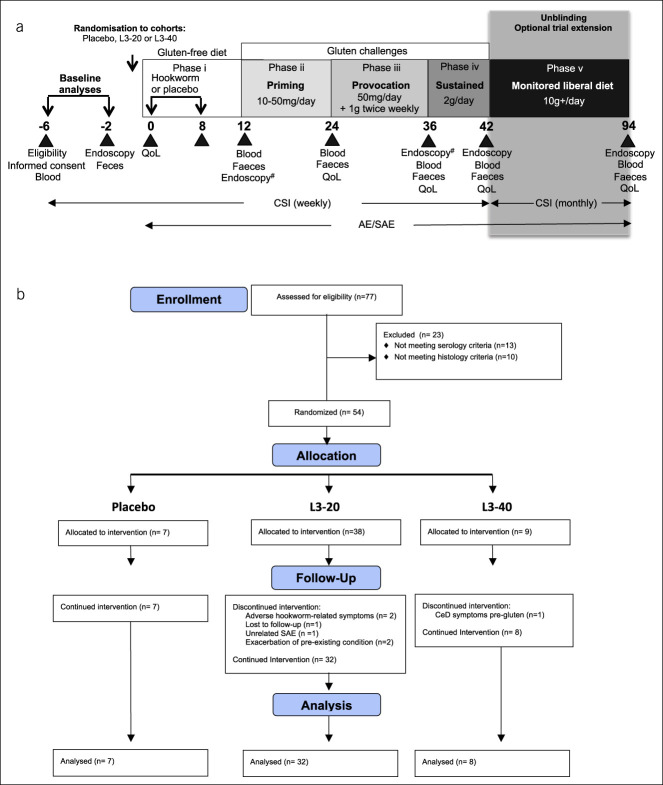
Methods: We undertook a randomized, placebo-controlled trial of hookworm infection in 54 people with celiac disease. The 94-week study involved treatment with either 20 or 40 Necator americanus third-stage larvae (L3-20 or L3-40) or placebo, followed by escalating gluten consumption (50 mg/d for 12 weeks, 1 g intermittent twice weekly for 12 weeks, 2 g/d sustained for 6 weeks, liberal diet for 1 year).

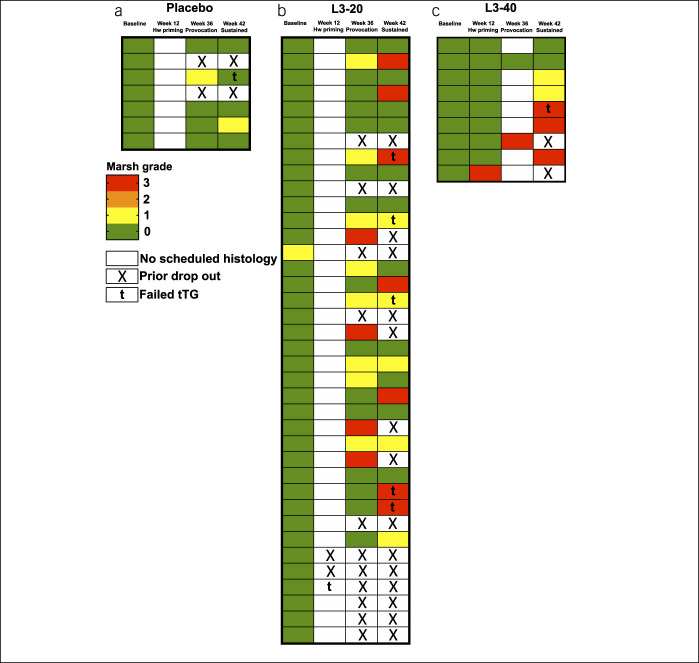
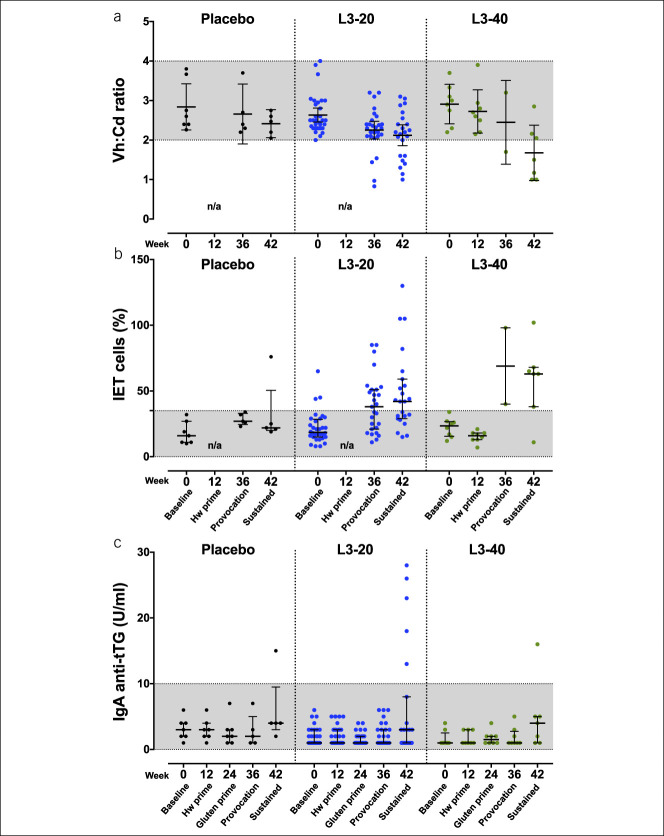
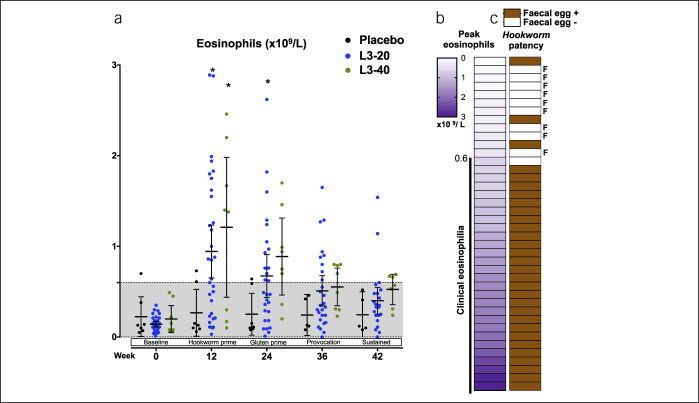
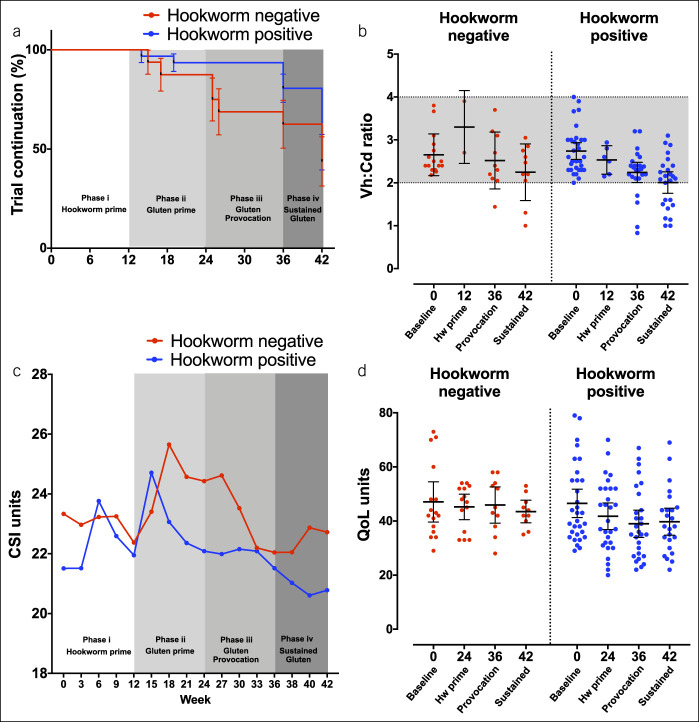
Results: Successful study completion rates at week 42 (primary outcome) were similar in each group (placebo: 57%, L3-20: 37%, and L3-40: 44%; P = 0.61), however gluten-related adverse events were significantly reduced in hookworm-treated participants: Median (range) adverse events/participant were as follows: placebo, 4 (1-9); L3-20, 1 (0-9); and L3-40, 0 (0-3) (P = 0.019). Duodenal villous height:crypt depth deteriorated similarly compared with their enrolment values in each group (mean change [95% confidence interval]: placebo, -0.6 [-1.3 to 0.2]; L3-20, -0.5 [-0.8 to 0.2]; and L3-40, -1.1 [-1.8 to 0.4]; P = 0.12). A retrospective analysis revealed that 9 of the 40 L3-treated participants failed to establish hookworm infections. Although week 42 completion rates were similar in hookworm-positive vs hookworm-negative participants (48% vs 44%, P = 0.43), quality of life symptom scores were lower in hookworm-positive participants after intermittent gluten challenge (mean [95% confidence interval]: 38.9 [33.9-44] vs 45.9 [39.2-52.6]).

Discussion: Hookworm infection does not restore tolerance to sustained moderate consumption of gluten (2 g/d) but was associated with improved symptom scores after intermittent consumption of lower, intermittent gluten doses.


Conflict of interest statement

Guarantor of the article: Paul R. Giacomin, PhD.

Specific author contributions: J.C., A.L., and P.R.G.: conceptualization. J.C., G.C.M., L.M., S.L., P.O., and P.R.G.: data analysis. J.C., L.M., A.L., G.R.-S., R.B.G., T.R., and P.R.G.: funding. J.C., G.C.M., R.G., M.N., C.W., J.W.M., R.B.G., T.R., and P.R.G.: investigation. J.C., G.C.M., R.G., S.L., L.B., J.S., P.M.V., J.S.M., A.D.C., J.S.M., A.L., and P.R.G.: methodology and administration. M.L.R., A.L., J.S.M., A.D.C., and G.R.-S.: supervision. J.C., L.M., S.L., and P.R.G.: writing—original draft. All authors: writing—review and editing. All authors approved the final manuscript.

Financial support: The work was funded by an Australian National Health and Medical Research Council (NHMRC) Project Grant (J.C., P.R.G., G.R.-S, L.M., and T.R.), Advance Queensland Fellowship (P.R.G.), The Prince Charles Hospital Foundation (J.C., T.R., and P.R.G.), Celiac Australia (J.C., P.R.G., T.R., A.L., and G.R.-S.), Bowel and Liver Trust, NZ Lottery Health Research Fund (R.G.), Australian Institute of Tropical Health and Medicine (P.R.G.), NHMRC Senior Principal Research Fellowship (A.L.), NHMRC Practitioner Fellowship (J.S.M.), NHMRC Program Grant (P.M.V.), and Australian Research Council (P.M.V.). Funders had no role in the design or conduct of the study.

Potential competing interests: None to report.

Figures

Figure 1.
Figure 1.
Study time line, interventions, and CONSORT flow chart. (a) After screening and baseline analyses, participants with CeD were allocated to receive either placebo (chilli pepper solution) or hookworm larvae (L3-20 or L3-40) delivered over 2 occasions, at week 0 and week 8 (phase i). L3 denotes Necator americanus stage 3. At week 12, subjects received a 12-week gluten priming challenge (phase ii: 10–50 mg/d for 12 weeks), followed by a gluten provocation challenge (phase iii: 50 mg/d +1 g twice weekly for 12 weeks) and sustained gluten challenge (phase iv: 2 g/d for 6 weeks). At week 42, following evaluation of patient symptoms, the study became unblinded and participants in active L3-treated cohorts were given the option of undertaking a monitored “liberal diet” of at least 10 g of gluten/day, with freedom of food choice for 12 months (phase v). Participants underwent regular clinic visits as denoted by the black triangles, where various biological samples and survey assessments were taken for analysis of safety and CeD pathology. #Denotes endoscopy performed at week 12 instead of week 36 in the L3-40 cohort. (b) CONSORT chart showing flow of patients through the clinical trial. AE, adverse event; CeD, celiac disease; CSI, CeD symptom index survey; QoL, CeD quality of life survey; SAE, serious AE.
Figure 2.
Figure 2.
Heat map displaying safety assessment outcomes and completion of study phases. Color-coded heat map displaying Marsh score, IgA-tTG safety assessment results and dropouts in the intention-to-treat (a) placebo, (b) L3-20, and (c) L3-40 cohorts at baseline and at designated visits after escalating gluten challenge. Marsh 3 represents failed histology; t denotes failed tTG assessment. Each row represents an individual participant. tTG, tissue transglutaminase.
Figure 3.
Figure 3.
Histology and serum autoantibody (anti-tTG) responses. (a) Duodenal villous height:crypt depth ratio (Vh:Cd, mean ± 95% CI) and (b) intraepithelial CD3+ T cell (IET cell) frequency (median ± IQR) in each individual's duodenal biopsy specimen at baseline and each study visit after intervention and escalating gluten challenge. (c) Serum IgA-tTG titers (median ± IQR) at baseline and each study visit. Dot points represent each individual's value and grayed area indicates the normal ranges for each parameter. CI, confidence interval; Hw, hookworm; IgA, immunoglobulin A; IQR, interquartile range; n/a, not applicable; tTG, tissue transglutaminase.
Figure 4.
Figure 4.
Evaluation of establishment of hookworm infections. (a) Peripheral blood eosinophil counts at baseline, after treatment with placebo or hookworm L3, and after escalating gluten challenges. Each individual data point is shown along with mean ± 95% confidence interval. Grayed area indicates the normal range. (b) Peak eosinophil counts in each participant from the L3-30 or L3-40 cohorts were ranked from lowest to highest and correlated with the (c) detection of hookworm eggs in feces by quantitative polymerase chain reaction (patency). F denotes participants who demonstrated both a lack of clinical eosinophilia (<0.6 × 10⁹/L) and an absence of a patent hookworm infection (total of 9 participants were deemed to be “hookworm treatment failures”).
Figure 5.
Figure 5.
Analysis of outcomes in hookworm-positive vs hookworm-negative participants. (a) Kaplan-Meier analysis of rates of trial continuation (%) during the various phases of the trial in the 31 hookworm-positive participants vs the 16 hookworm-negative participants, displayed as mean survival ±SEM. Survival required stable (Marsh 0 or I) intestinal pathology, subclinical immunoglobulin A-tissue transglutaminase titer (<10 units) and asymptomatic tolerance to the gluten challenge. (b) Duodenal villous height:crypt depth ratio (Vh:Cd) in hookworm-negative vs hookworm-positive participants. Each individual data point is shown along with mean ± 95% confidence interval. Grayed area indicates the normal ranges. (c) Mean CeD symptom index (CSI) in each group, averaged for each 3-week period. (d) Mean CeD quality of life (QoL) score ±95% CI determined at each clinic visit. For both CSI and QoL, a lower value indicates lessened CeD-related symptoms. CeD, celiac disease.

References

    1. Qiao SW, Iversen R, Raki M, et al. The adaptive immune response in celiac disease. Semin Immunopathol 2012;34:523–40. - PubMed
    1. Abadie V, Discepolo V, Jabri B. Intraepithelial lymphocytes in celiac disease immunopathology. Semin Immunopathol 2012;34:551–66. - PubMed
    1. Di Sabatino A, Vanoli A, Giuffrida P, et al. The function of tissue transglutaminase in celiac disease. Autoimmun Rev 2012;11:746–53. - PubMed
    1. Spatola BN, Kaukinen K, Collin P, et al. Persistence of elevated deamidated gliadin peptide antibodies on a gluten-free diet indicates nonresponsive coeliac disease. Aliment Pharmacol Ther 2014;39:407–17. - PMC - PubMed
    1. Ludvigsson JF, Rubio-Tapia A, van Dyke CT, et al. Increasing incidence of celiac disease in a North American population. Am J Gastroenterol 2013;108:818–24. - PMC - PubMed

Publication types

MeSH terms