. 2021 Jan 29;17(1):e1008668.
doi: 10.1371/journal.pcbi.1008668. eCollection 2021 Jan.

A sensory integration account for time perception

Affiliations

A sensory integration account for time perception

Alessandro Toso et al. PLoS Comput Biol. .

Abstract

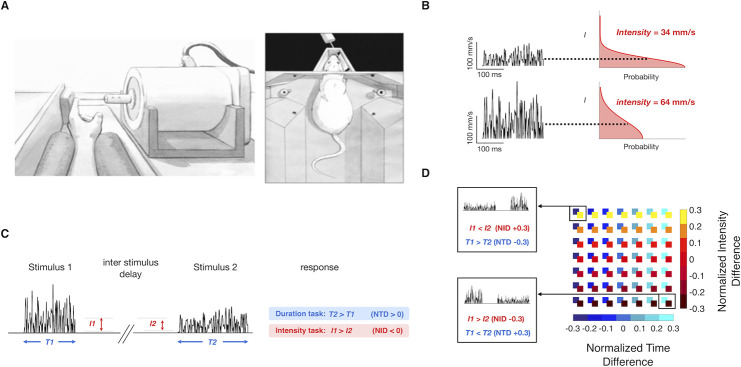
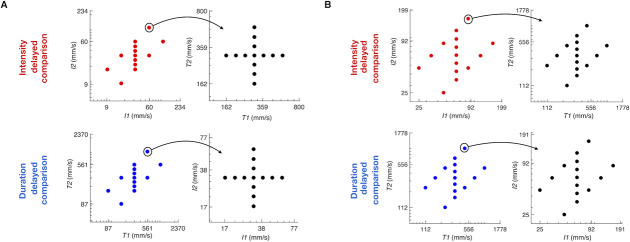
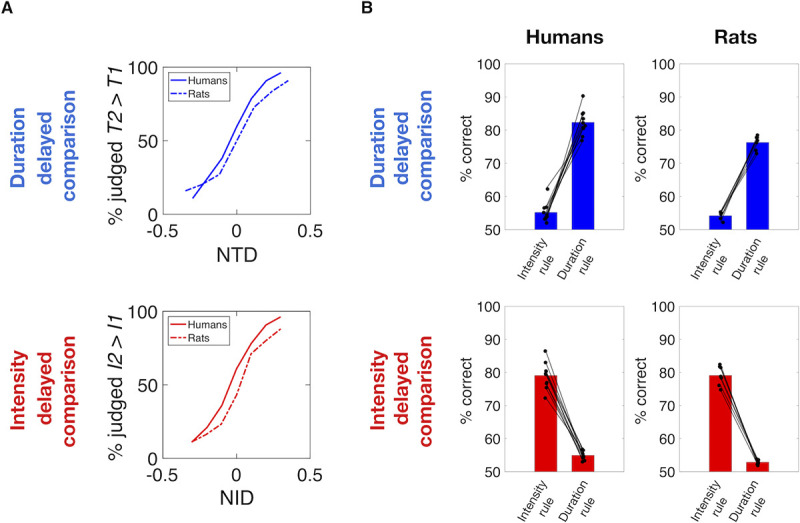
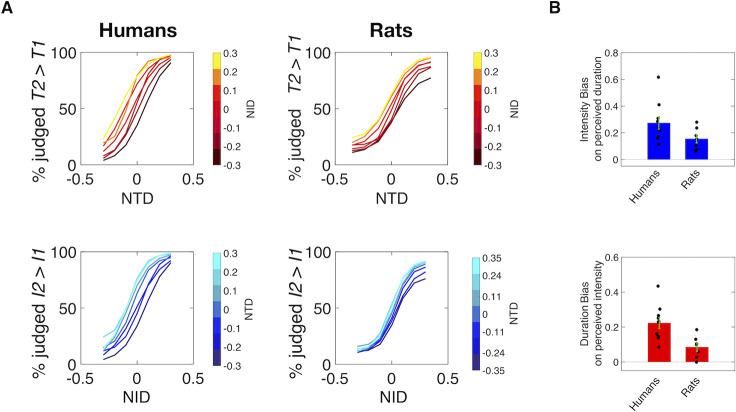
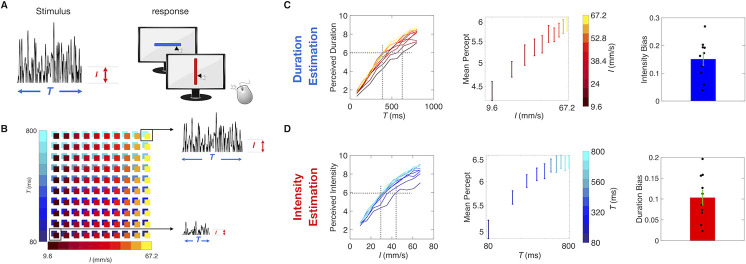
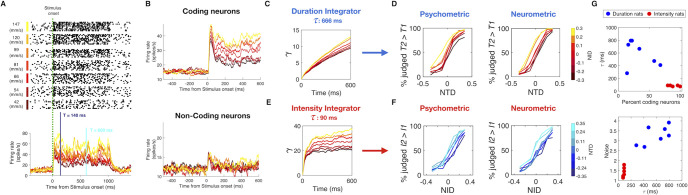
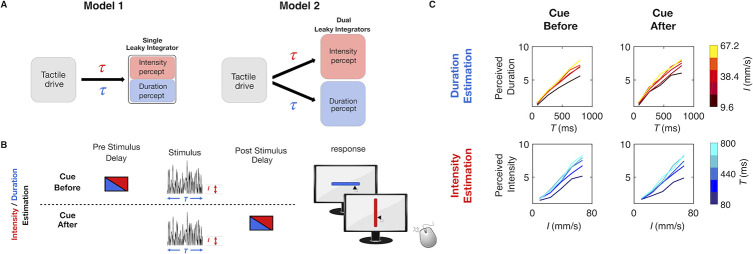
The connection between stimulus perception and time perception remains unknown. The present study combines human and rat psychophysics with sensory cortical neuronal firing to construct a computational model for the percept of elapsed time embedded within sense of touch. When subjects judged the duration of a vibration applied to the fingertip (human) or whiskers (rat), increasing stimulus intensity led to increasing perceived duration. Symmetrically, increasing vibration duration led to increasing perceived intensity. We modeled real spike trains recorded from vibrissal somatosensory cortex as input to dual leaky integrators-an intensity integrator with short time constant and a duration integrator with long time constant-generating neurometric functions that replicated the actual psychophysical functions of rats. Returning to human psychophysics, we then confirmed specific predictions of the dual leaky integrator model. This study offers a framework, based on sensory coding and subsequent accumulation of sensory drive, to account for how a feeling of the passage of time accompanies the tactile sensory experience.


Conflict of interest statement

The authors have declared that no competing interests exist.

Figures

Fig 1
Fig 1. Experiment conditions and stimulus parameters.
A) Left: Experiment setup, with the rat’s whiskers in contact with the vibrating plate. Right: Experiment setup for the human, with the left index fingertip in contact with the vibrating probe. B) Schematic representation of the noisy vibrations delivered by the motor. The left side shows two traces of sampled speed over time, and the right side shows the folded half Gaussian distribution to which each sample corresponds. The distribution’s expected value is shown for each trace. C) Delayed comparison trial structure. Each trial consisted of the presentation of two noisy stimuli, with specified durations and intensities, separated by an interstimulus delay. The response was deemed correct according to the task rule: to compare the relative durations (blue-shaded rule) or relative intensities of Stimulus 1 and 2 (red-shaded rule). D) Representation of all possible stimulus intensities and durations presented to the subjects in the delayed comparison task. Each square in the matrix is color coded according to the NTD and NID of the two vibrations presented. Selected NID/NTD combinations from the top left and bottom right of the matrix are illustrated.
Fig 2
Fig 2. Stimulus generation matrix.
A) Upper row: Matrices used for the intensity delayed comparison task. Lower row: matrices used for the duration delayed comparison task, for human subjects. Each trial’s pair of task relevant feature values (I in the intensity task, T in the duration task) was drawn uniform randomly from the set of pairs scattered in the leftmost plots. Each trial’s pair of task irrelevant feature values (T in the intensity task, I in the duration task) was drawn uniform randomly from the set of pairs scattered in the rightmost plots. B) Same as A, for rat subjects.
Fig 3
Fig 3. Humans and rats extract two distinct percepts.
A) Psychometric curves averaged across all subjects as a function of NTD while averaging across all NID values (upper panel), and as a function of NID while averaging across all NTD values (lower panel). Solid lines show the choice probability for humans, while dashed lines show the choice probability for rats. B) Upper plots: Performance obtained by human subjects (left column) and rats (right column) in duration delayed comparison task. Bars on the left of each plot show the performance calculated according to the intensity rule (correctness according to stimulus intensity difference) revealing a consistent bias of the irrelevant feature on choice in both species. Bars on the right of each plot show the performance according to the duration rule, revealing similar performances in both species. Lower plots: Symmetrical analyses for intensity delayed comparison task, showing comparable performance and biases caused by the non-relevant feature on choice between the two species. In all plots, each line connecting a pair of dots represent single subjects.
Fig 4
Fig 4. Interacting stimulus features in delayed comparison.
A) Psychometric curves for 10 humans (left) and 7 rats (right) in the duration (top) and intensity (bottom) delayed comparison tasks. B) Upper plot: Bias caused by the non-relevant stimulus feature, intensity, in duration comparison. Lower plot: Bias caused by the non-relevant stimulus feature, duration, in intensity comparison. In all plots, dots represent single subjects, bars represent mean of biases across subjects, while error bars represent the standard error of the mean across all subjects. The median value of each bias was significantly different from zero (humans: p = 0.002 for both intensity and duration bias, rats: p = 0.0156 for intensity bias, p = 0.032 for duration bias, Wilcoxon signed rank test).
Fig 5
Fig 5. Interacting stimulus features in direct estimation.
A) Experiment setup. 10 Human subjects received a single noisy vibration and reported perceived duration or intensity by mouse-clicking on a computer screen. B) Stimulus matrix. The vibration duration and intensity was randomly picked from the set of (T, I) combinations represented by the colored squares. Two sample stimuli from the upper right and lower left of the matrix are illustrated. C) Duration estimation results. The left plot shows the median perceived duration as a function of true duration. Middle plot shows how the mean percept, averaged across all values of T, changed with increasing values of I in log scale, for the duration estimation session. On the right, the intensity bias, calculated as the linear coefficient between mean perception and different values of I in log scale, across all 10 subjects. D) Intensity estimation results, following the same convention as panel C).
Fig 6
Fig 6. Leaky integration of vS1 neuronal activity replicates psychophysical results.
A) Raster plots of one neuronal cluster recorded from vS1 of an awake-behaving rat as it received vibrations. Stimulus duration was 1 s and plots are arranged according to vibration I, from 147 mm/s (top) to 42 mm/s (bottom). Lower panel shows the peristimulus time histogram of the same neuronal cluster, sorted by vibration I. In order to replicate behavioral stimulus set, responses of individual neurons were measured from t = 0 to 7 different duration T, logarithmically spaced from a minimum of 140 ms to a maximum 600 ms. B) Upper plot: PSTH of all I-coding neurons (n = 66) sorted by I. Lower plot: PSTH of all non I-coding neurons (n = 57) sorted by I. Color scale for I as in A). C) Output γ of the duration leaky integrator as a function of time, obtained by integrating 34% of coding neurons and 66% of non-coding neurons with a time constant τ of 666 ms, and a noise parameter of 3.1 standard deviations. Color scale for I as in A). D) Comparison between the psychometric curves (left plot) and the neurometric curves (right plot) obtained for one example rat trained in duration delayed comparison. E) Output γ of the intensity leaky integrator as a function of time, obtained by integrating 90% of coding neurons and 10% of non-coding neurons with a time constant τ of 90 ms, and a noise parameter of 1.6. Color scale for I as in A). F) Comparison between the psychometric curves (left plot) and the neurometric curves (right plot) obtained for one example rat trained in the intensity delayed comparison task. G) Optimal values of the 3 parameters of the leaky integrator model obtained for each individual duration rat (blue dots) and intensity rat (red dots). The upper plot shows the percent of coding neurons versus τ. The lower plot shows τ versus the neuronal noise.
Fig 7
Fig 7. Test of single versus dual integrators.
A) Alternative hypotheses for the leaky integration process underlying the construction of both intensity and duration perception. Model 1 is represented by a single integrator that receives tactile drive but switches between task-specific values for the parameter τ. Model 2 is represented by dual integrators that receive the same tactile drive. Each integrator has task-specific values for the parameter τ. B) Schematic representation of cue-before versus cue-after direct estimation experiment. On half the trials, the cue providing trial instruction (symbolized by red or blue box) was provided before the vibration (above dashed line), and on the remaining half, the cue was presented after the vibration (below dashed line). C) Comparison of median perceived duration (upper row) and median perceived intensity (lower row) when the cue was presented before (left column) versus after (right column) the vibration, for 8 human subjects. Time of cue did not affect estimation.

References

    1. Gibbon J, Church RM, Meck WH. Scalar Timing in Memory. Ann N Y Acad Sci. 1984;423: 52–77. 10.1111/j.1749-6632.1984.tb23417.x - DOI - PubMed
    1. Bueti D, Bahrami B, Walsh V. Sensory and association cortex in time perception. J Cogn Neurosci. 2008;20: 1054–1062. 10.1162/jocn.2008.20060 - DOI - PubMed
    1. Bueti D. The Sensory Representation of Time. Front Integr Neurosci. 2011;5: 34 10.3389/fnint.2011.00034 - DOI - PMC - PubMed
    1. Buhusi C V., Meck WH. What makes us tick? Functional and neural mechanisms of interval timing. Nat Rev Neurosci. 2005;6: 755–765. 10.1038/nrn1764 - DOI - PubMed
    1. Merchant H, Harrington DL, Meck WH. Neural Basis of the Perception and Estimation of Time. Annu Rev Neurosci. 2013;36: 313–336. 10.1146/annurev-neuro-062012-170349 - DOI - PubMed

Publication types

LinkOut - more resources