. 2021 Jan 29;17(1):e1008223.
doi: 10.1371/journal.pcbi.1008223. eCollection 2021 Jan.

Causal network inference from gene transcriptional time-series response to glucocorticoids

Affiliations

Causal network inference from gene transcriptional time-series response to glucocorticoids

Jonathan Lu et al. PLoS Comput Biol. .

Abstract

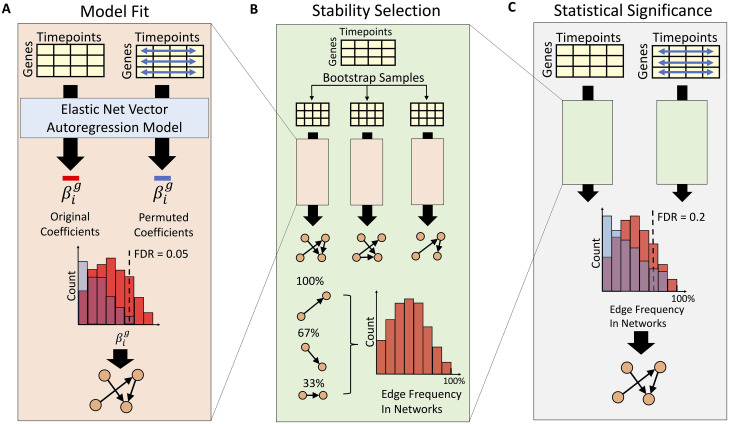
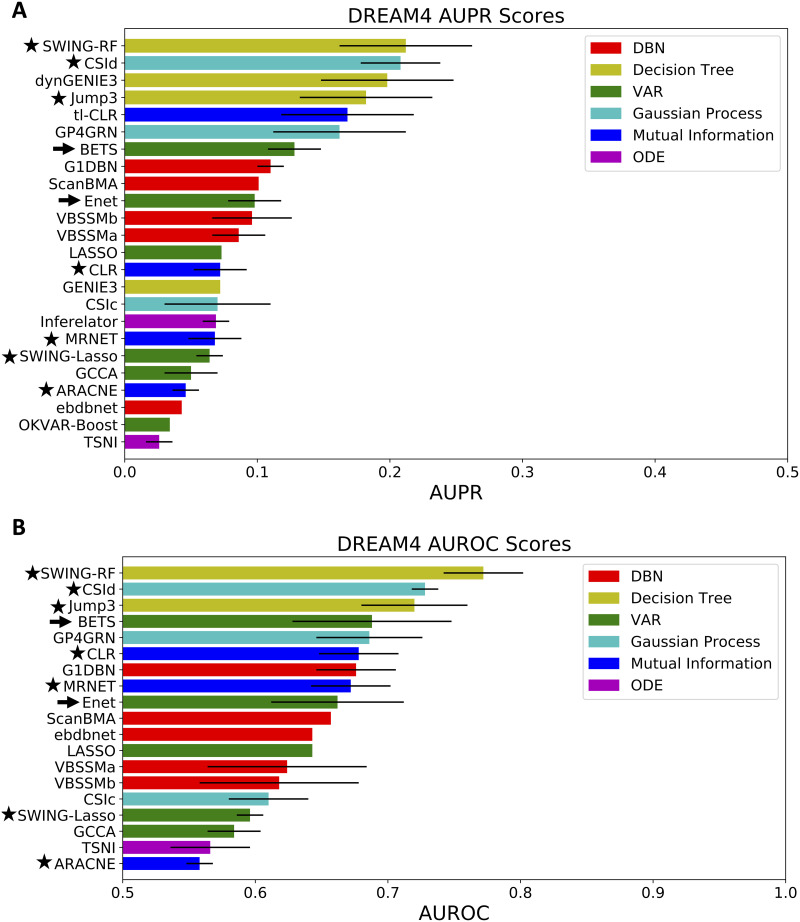
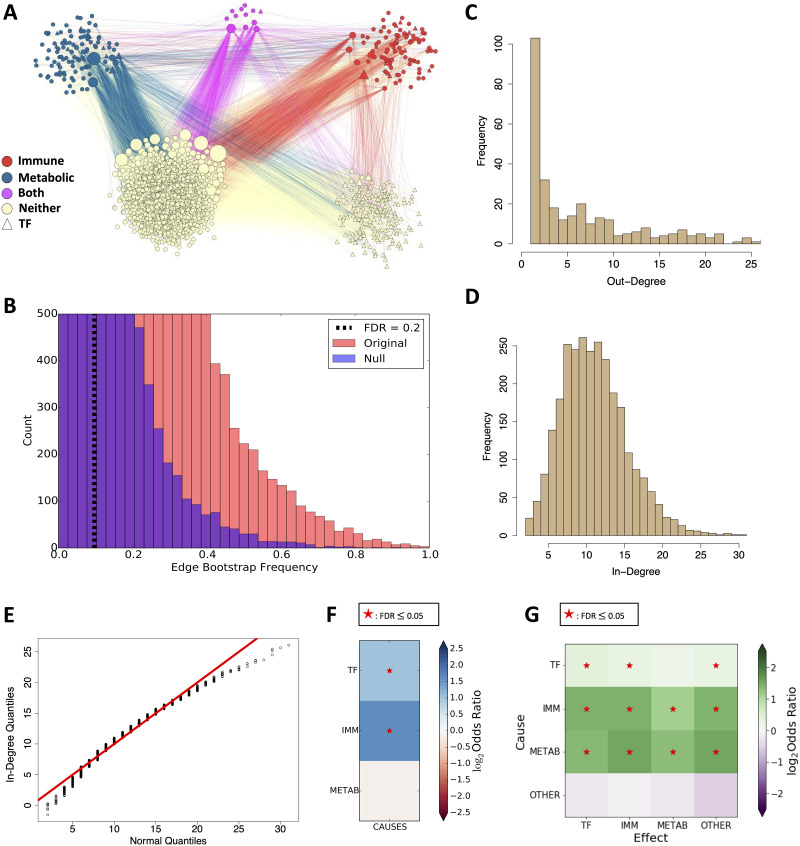
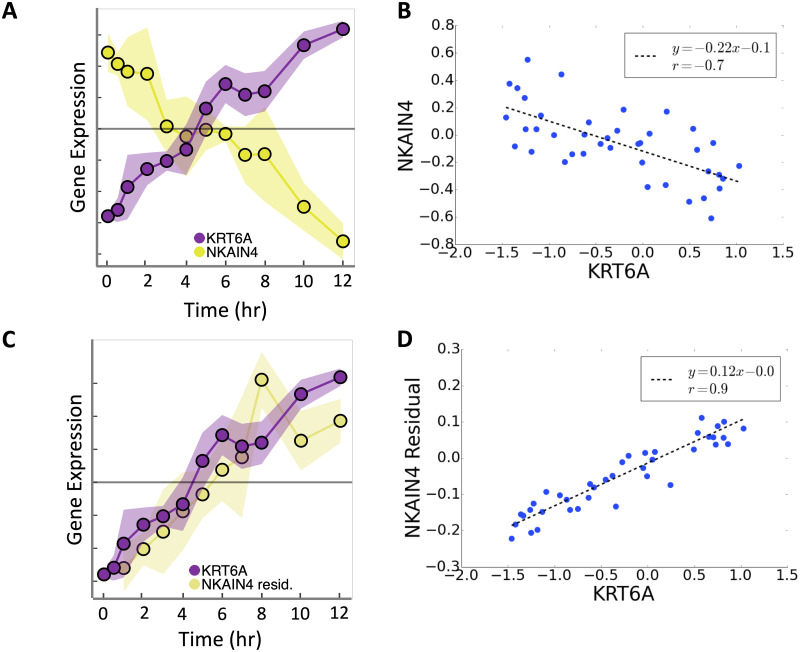
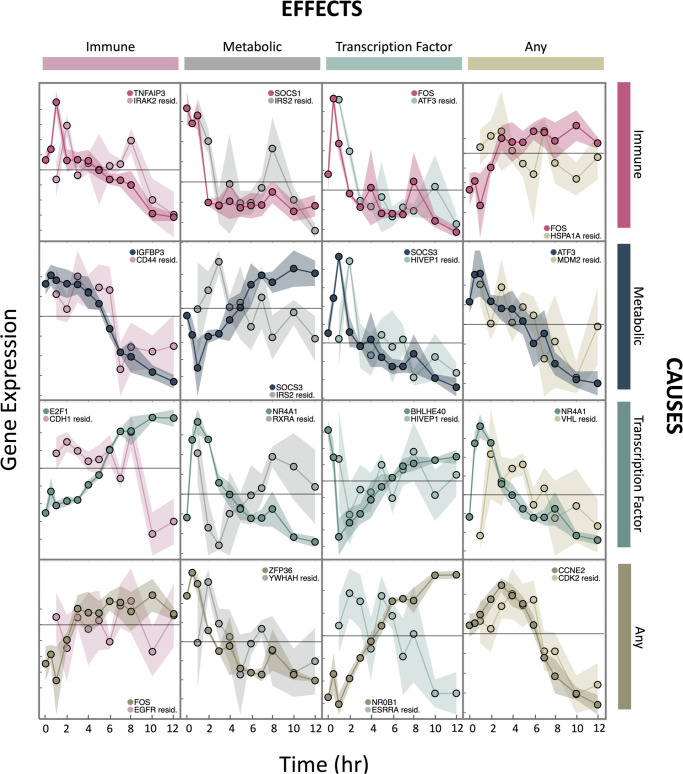
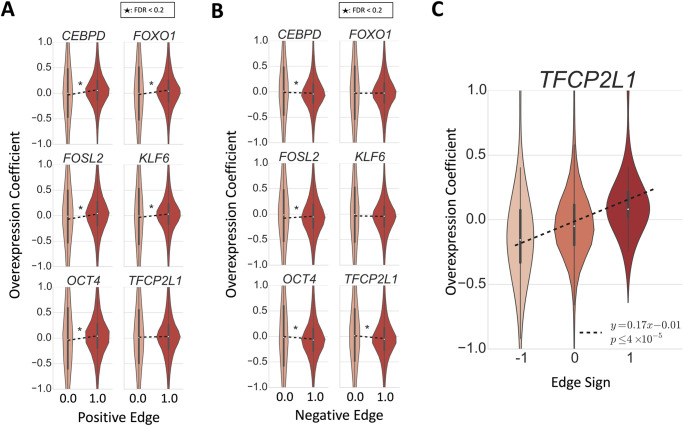
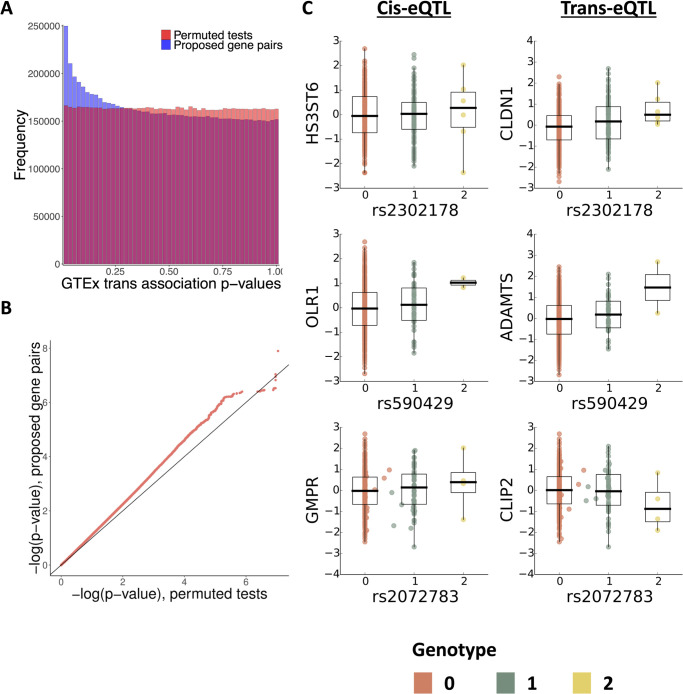
Gene regulatory network inference is essential to uncover complex relationships among gene pathways and inform downstream experiments, ultimately enabling regulatory network re-engineering. Network inference from transcriptional time-series data requires accurate, interpretable, and efficient determination of causal relationships among thousands of genes. Here, we develop Bootstrap Elastic net regression from Time Series (BETS), a statistical framework based on Granger causality for the recovery of a directed gene network from transcriptional time-series data. BETS uses elastic net regression and stability selection from bootstrapped samples to infer causal relationships among genes. BETS is highly parallelized, enabling efficient analysis of large transcriptional data sets. We show competitive accuracy on a community benchmark, the DREAM4 100-gene network inference challenge, where BETS is one of the fastest among methods of similar performance and additionally infers whether causal effects are activating or inhibitory. We apply BETS to transcriptional time-series data of differentially-expressed genes from A549 cells exposed to glucocorticoids over a period of 12 hours. We identify a network of 2768 genes and 31,945 directed edges (FDR ≤ 0.2). We validate inferred causal network edges using two external data sources: Overexpression experiments on the same glucocorticoid system, and genetic variants associated with inferred edges in primary lung tissue in the Genotype-Tissue Expression (GTEx) v6 project. BETS is available as an open source software package at https://github.com/lujonathanh/BETS.


Conflict of interest statement

I have read the journal’s policy and the authors of this manuscript have the following competing interests: BEE is on the SAB for Freenome, Celsius Therapeutics, and Creyon Bio; is a consultant for Freenome; and was an employee of Genomics plc during a year of absence from Princeton University.

Figures

Fig 1
Fig 1. BETS Algorithm.
A) Model fit. The VAR model is fit on both the original and a permuted data set (blue arrows indicate shuffling each gene’s expression independently across time). Based on the null distribution of coefficients, a threshold is chosen to control the edge FDR at ≤ 0.05. B) Stability selection. From the original data, 1000 bootstrap samples are generated. For each sample, a network is inferred as in A. Each edge’s selection frequency across the bootstrapped networks is computed. C) Statistical significance. For both the original and permuted data, a selection frequency distribution is generated for stability selection as in B. Edges are thresholded to control the stability FDR at ≤ 0.2. See S1 Fig for an overview of network inference methods.
Fig 2
Fig 2. Algorithm performance on the DREAM community benchmark.
A) AUPR scores from 24 methods, averaged across the five DREAM networks. B) AUROC scores from 19 methods, averaged across the five DREAM networks. Arrows indicate our methods. Stars indicate methods that we ran in-house; results were consistent with reported results. The bars reach one standard deviation from the average as calculated across the five DREAM networks; no bar indicates the standard deviation was not reported. See also S1–S5 Tables.
Fig 3
Fig 3. Causal network inferred from glucocorticoid receptor data.
A) Causal network clustered by gene type. Edge color indicates the type of the causal gene: red edge indicates an immune causal edge, blue edge indicates a metabolic causal edge, purple edge (both) indicates an immune and metabolic causal edge, and tan edge indicates a neither immune nor metabolic other causal edge. B) Significance thresholding for edges, based on the null distribution of selection frequencies. C) Out-degree distribution of network. For clarity, several high out-degree values with low frequencies are not shown. D) In-degree distribution of network. E) Quantile-quantile (Q-Q) plot of in-degree distribution against normal quantiles. The in-degrees have a heavier left tail and lighter right tail than the normal distribution. F) Enrichment of gene classes among network causal genes, measured by odds ratio. G) Enrichment of edge classes among network edges, measured by odds ratio. See also S6 Table.
Fig 4
Fig 4. Conditional Granger causality reveals opposite sign of relationship KRT6ANKAIN4.
A) Time series and B) scatter plot of expression values from KRT6A and NKAIN4. C) Time series and D) scatter plot of expression values from KRT6A and residual expression values from NKAIN4 after controlling for the effects of other covariates in NKAIN4. Each y-axis tick in A and C indicates 0.1 unit-variance standardized ln(TPM), where TPM is Transcripts Per kilobase Million. The grey line marks zero-centered expression. B and D axes are in units of ln(TPM).
Fig 5
Fig 5. Time-series profiles of experimentally validated causal interactions across gene classes.
For each gene pair, their profiles were from either the original exposure data set or the unperturbed data set. The effects of all covariates beside the causal gene were controlled in the effect gene values to show the conditional Granger-causal relationship. Colors encode gene classes: pink shows immune genes, dark blue/gray shows metabolic genes, teal shows TFs, and brown/tan shows other genes. Darker colors show causal genes and lighter colors show effect genes. The grey line marks zero-centered expression. Each y-axis tick indicates 0.1 unit-variance standardized ln(TPM). See also S7 Table and S2 Fig.
Fig 6
Fig 6. Validation of inferred network on overexpression data.
A-B) Regression of one-hot encoding of positive (negative for B) edges as the predictor against the VAR model edge coefficient from the overexpression data as the response. A 1 indicates that an edge had a positive (in A) or negative (in B) coefficient in the original inferred network (FDR ≤ 0.2). C) For the 123 causal edges from TFCP2L1, regression of edge sign as the predictor against the VAR model edge coefficient from TFCP2L1 overexpression data as the response.
Fig 7
Fig 7. Network edge validation using known cis- elements from GTEx v6 lung cis-eQTLs.
A) Enrichment of trans associations in primary lung tissue among p-values from edges inferred by BETS compared to p-values from permutations. B) Quantile-quantile plot of validated edges shows signal enrichment in lung samples when compared to signals from four other tissues in the GTEx v6 study. C) SNPs associated with inferred gene pairs. Genotype-phenotype plots corresponding to the cis-effect (left column), correlation in the GTEx v6 data between cause (y-axis) and effect (x-axis) gene pairs (right column).

References

    1. Bar-Joseph Z, Gitter A, Simon I. Studying and modelling dynamic biological processes using time-series gene expression data. Nature Reviews Genetics. 2012;13(8):552–564. 10.1038/nrg3244 - DOI - PubMed
    1. Bernardo J, Bayarri M, Berger J, Dawid A, Heckerman D, Smith A, et al. Bayesian factor regression models in the “large p, small n” paradigm. Bayesian Statistics. 2003;7:733–742.
    1. Bühlmann P, Kalisch M, Meier L. High-dimensional statistics with a view toward applications in biology. Annual Review of Statistics and Its Application. 2014;1:255–278. 10.1146/annurev-statistics-022513-115545 - DOI
    1. Mas P. Circadian clock function in Arabidopsis thaliana: time beyond transcription. Trends in cell biology. 2008;18(6):273–281. 10.1016/j.tcb.2008.03.005 - DOI - PubMed
    1. Robinson JW, Hartemink AJ. Learning non-stationary dynamic Bayesian networks. Journal of Machine Learning Research. 2010;11(Dec):3647–3680.

Publication types

Substances