. 2021 Jan 29;17(1):e1009285.
doi: 10.1371/journal.pgen.1009285. eCollection 2021 Jan.

Genome-scale CRISPR screening for modifiers of cellular LDL uptake

Affiliations

Genome-scale CRISPR screening for modifiers of cellular LDL uptake

Brian T Emmer et al. PLoS Genet. .

Abstract

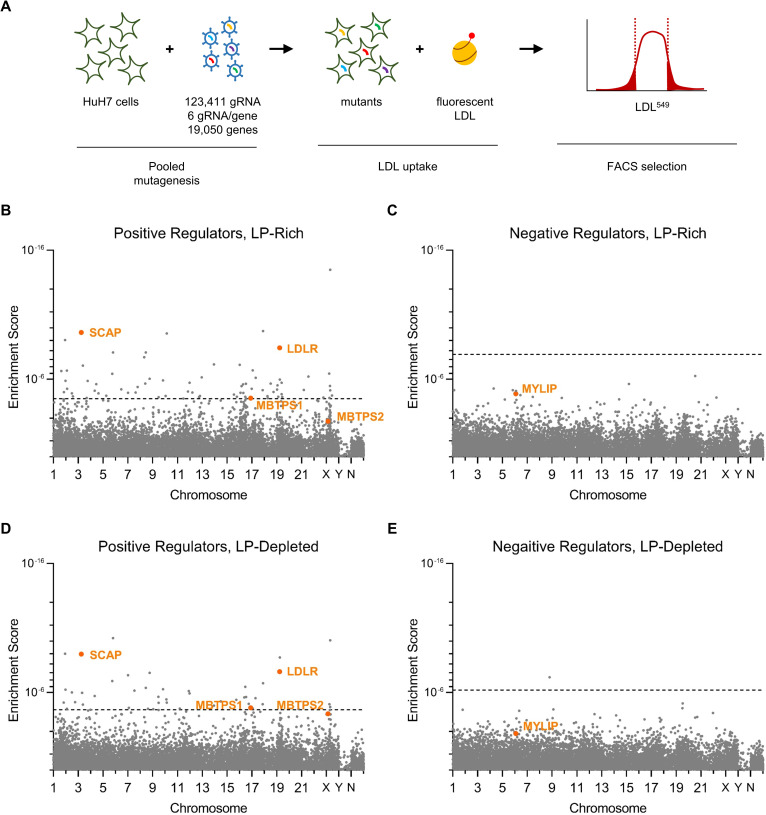
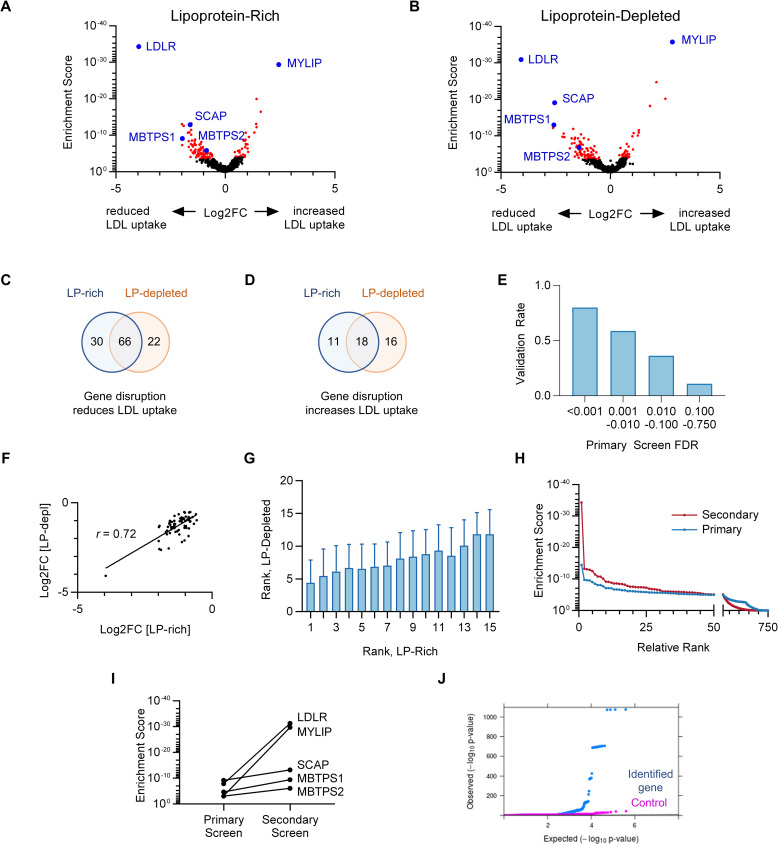
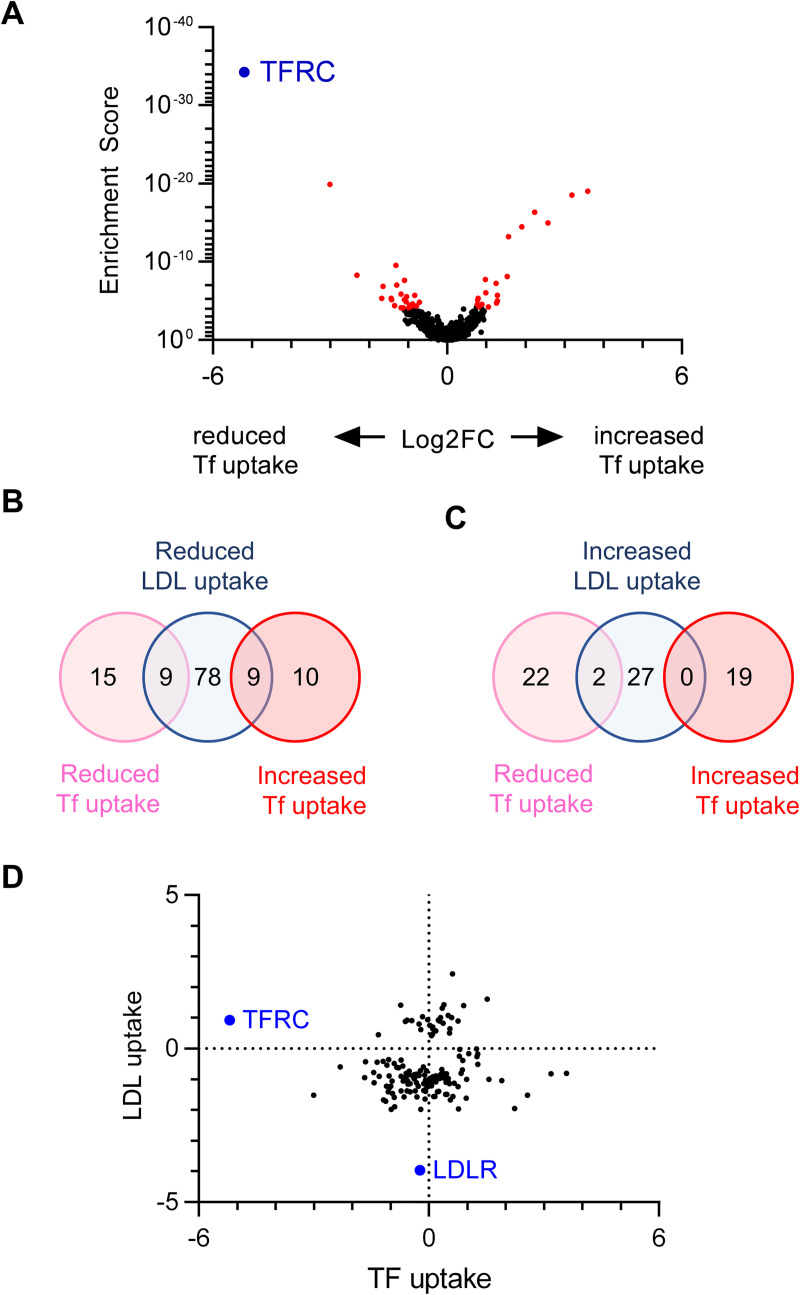
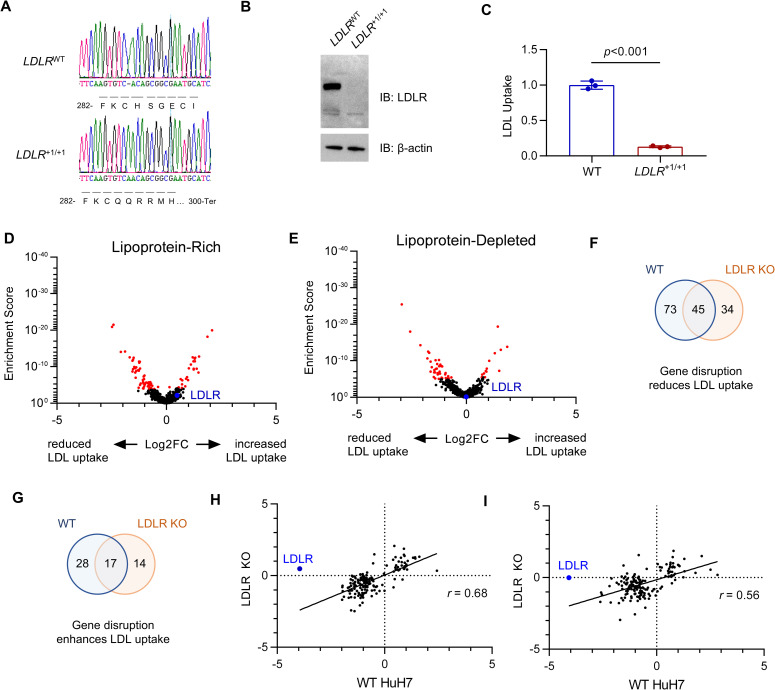
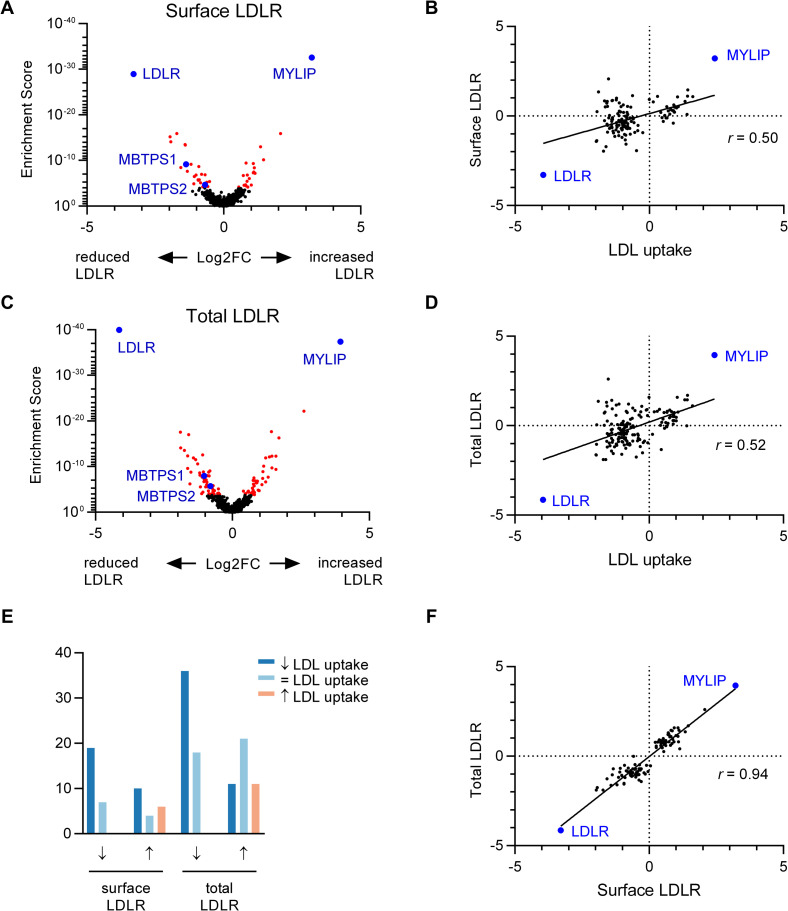
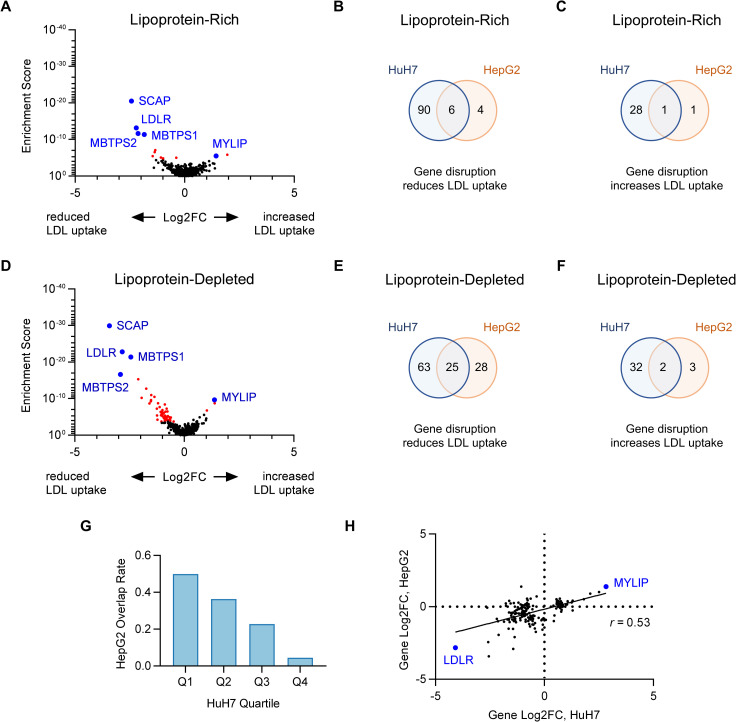
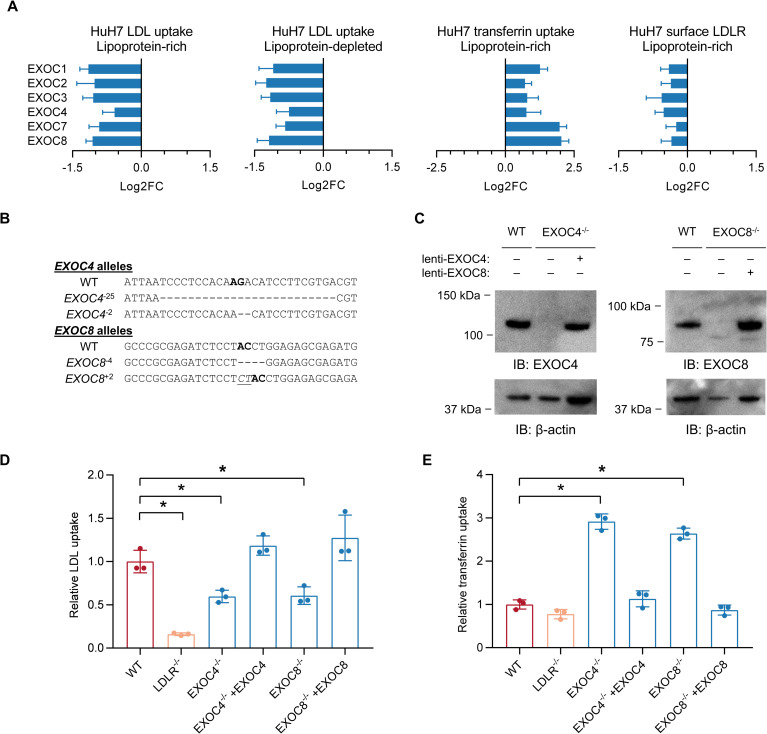
Hypercholesterolemia is a causal and modifiable risk factor for atherosclerotic cardiovascular disease. A critical pathway regulating cholesterol homeostasis involves the receptor-mediated endocytosis of low-density lipoproteins into hepatocytes, mediated by the LDL receptor. We applied genome-scale CRISPR screening to query the genetic determinants of cellular LDL uptake in HuH7 cells cultured under either lipoprotein-rich or lipoprotein-starved conditions. Candidate LDL uptake regulators were validated through the synthesis and secondary screening of a customized library of gRNA at greater depth of coverage. This secondary screen yielded significantly improved performance relative to the primary genome-wide screen, with better discrimination of internal positive controls, no identification of negative controls, and improved concordance between screen hits at both the gene and gRNA level. We then applied our customized gRNA library to orthogonal screens that tested for the specificity of each candidate regulator for LDL versus transferrin endocytosis, the presence or absence of genetic epistasis with LDLR deletion, the impact of each perturbation on LDLR expression and trafficking, and the generalizability of LDL uptake modifiers across multiple cell types. These findings identified several previously unrecognized genes with putative roles in LDL uptake and suggest mechanisms for their functional interaction with LDLR.


Conflict of interest statement

The authors have declared that no competing interests exist.

Figures

Fig 1
Fig 1. Primary genome-wide CRISPR screens for HuH7 LDL uptake modifiers.
(A) Schematic of screening strategy. (B-E) MAGeCK gene level enrichment scores for genes whose perturbation causes reduced LDL uptake (B, D) or increased LDL uptake (C, E) under lipoprotein-rich (B-C) or lipoprotein-depleted (D-E) culture conditions.
Fig 2
Fig 2. Targeted secondary CRISPR screens for modifiers of LDL uptake by HuH7 cells.
(A-B) Volcano plots displaying MAGeCK gene level enrichment scores and associated gRNA log2 fold changes for each gene tested in the secondary gRNA library, under lipoprotein-rich (A) or lipoprotein-depleted (B) cultured conditions, with genes identified with FDR<5% displayed in red and positive controls in blue. (C-D) Venn diagrams of genes identified whose targeting was associated with reduced (C) or enhanced (D) cellular LDL uptake under lipoprotein-rich and/or lipoprotein-depleted culture conditions. (E) Genes identified in the primary screen for LDL uptake were stratified by FDR tier and compared for their validation rate (FDR<5%) in the secondary screen for LDL uptake. (F) Correlation of effect size for genes identified as positive regulators of LDL uptake under both lipoprotein-rich and lipoprotein-depleted culture conditions. (G) Average relative ranking of each individual gRNA among the 15 gRNA per gene in lipoprotein-depleted conditions relative to ranking of that same gRNA in lipoprotein-rich conditions. (H) Cumulative distribution function of MAGeCK enrichment scores for genes tested in both the primary and secondary CRISPR screens for LDL uptake. (I) Comparison of MAGeCK gene level enrichment scores for positive control genes in the primary versus secondary CRISPR screens for LDL uptake. (J) QQ plot of LDL GWAS results in UK Biobank within identified LDL uptake regulator genes compared to matched control genes.
Fig 3
Fig 3. Orthogonal CRISPR screen for modifiers of transferrin uptake by HuH7 cells.
(A) Volcano plot displaying transferrin uptake MAGeCK gene level enrichment scores and log2 fold change for each gene tested in the customized gRNA library, with genes identified with FDR<5% displayed in red and TFRC in blue. (B-C) Venn diagrams of genes identified whose targeting was associated with reduced (B) or increased (C) cellular transferrin uptake, in comparison to the effect of targeting each gene on HuH7 LDL uptake. (D) Relative effect sizes with log2 fold change for targeting of each gene on transferrin and LDL uptake.
Fig 4
Fig 4. Orthogonal CRISPR screen for modifiers of LDL uptake by LDLR-deleted HuH7 cells.
(A) Genotyping at the genomic DNA target site, (B) immunoblotting, and (C) quantification of LDL uptake by flow cytometry for a single cell HuH7 clone targeted by CRISPR at the LDLR locus. (D-E) Volcano plots displaying MAGeCK gene level enrichment scores and log2 fold change for each gene tested in the secondary gRNA library, under lipoprotein-rich (D) or lipoprotein-depleted (E) cultured conditions, with genes identified with FDR<5% displayed in red. (F-G) Venn diagrams demonstrating the overlap in genes identified from HuH7 WT and LDLR KO cells for genes whose disruption was associated with reduced (F) or enhanced (G) LDL uptake. (H-I) Comparison of effect size on LDL uptake in WT and LDLR KO cells under lipoprotein-rich (H) or lipoprotein-depleted (I) conditions for each gene showing a significant effect in either background.
Fig 5
Fig 5. Orthogonal CRISPR screen for modifiers of LDLR abundance in HuH7 cells.
(A) Volcano plot displaying surface LDLR abundance MAGeCK gene level enrichment score and log2 fold change for each gene tested in the customized gRNA library, with genes identified with FDR<5% displayed in red. (B) Comparison of effect size for LDL uptake and surface LDLR abundance for each gene showing a significant effect for either. (C) Volcano plot and (D) comparison of effect size for LDL uptake and total cellular LDLR abundance. (E) Comparison of corresponding effect on LDL uptake for each gene exhibiting an influence on surface or total LDLR abundance. (F) Comparison of effect size for each gene exhibiting an influence on either surface or total LDLR abundance.
Fig 6
Fig 6. Orthogonal CRISPR screen for modifiers of LDL uptake by HepG2 cells.
(A-F) Volcano plots displaying MAGeCK gene level enrichment score and log2 fold change for each gene tested in the secondary gRNA library, under lipoprotein-rich (A) or lipoprotein-depleted (D) cultured conditions, with genes identified with FDR<5% displayed in red. Venn diagrams demonstrating the overlap between HuH7 and HepG2 cells for positive (B, E) and negative (C, F) regulators of LDL uptake under lipoprotein-rich (B-C) or lipoprotein-depleted (E-F) culture conditions. (G) Positive regulators of LDL uptake in HuH7 cells under lipoprotein-depleted conditions were grouped by quartile and the proportion in each group that also influenced LDL uptake in HepG2 cells is displayed. (H) The effect size in lipoprotein-depleted conditions for gene-level gRNA enrichment in each cell type is plotted for genes showing a functional role in either cell type.
Fig 7
Fig 7. Disruption of the exocyst causes a discordant effect on HuH7 uptake of LDL and transferrin.
(A) Average log2-fold change +/- SEM for the 15 gRNA in our secondary CRISPR library targeting each exocyst component in selected populations. Reduction in gRNA frequency reflects a decrease in LDL or transferrin uptake or LDLR staining. (B) Allele genotypes from individual HuH7 clones isolated after CRISPR targeting of either EXOC4 or EXOC8. (C) Immunoblotting of lysates prepared from wild-type HuH7 cells, or EXOC4-25/-2 or EXOC8-4/+2 clones with and without ectopic lentiviral expression of a EXOC4 or EXOC8 CRISPR-resistant cDNA. (D) LDL uptake assay and (E) transferrin uptake assay of WT, LDLR+1/+1, and EXOC4-25/-2 or EXOC8-4/+2 clones with and without ectopic expression of a CRISPR-resistant cDNA. * = p < 0.05.

References

    1. Ference BA, Ginsberg HN, Graham I, Ray KK, Packard CJ, Bruckert E, et al. Low-density lipoproteins cause atherosclerotic cardiovascular disease. 1. Evidence from genetic, epidemiologic, and clinical studies. A consensus statement from the European Atherosclerosis Society Consensus Panel. Eur Heart J. 2017;38(32):2459–72. Epub 2017/04/27. 10.1093/eurheartj/ehx144 - DOI - PMC - PubMed
    1. Luo J, Yang H, Song BL. Mechanisms and regulation of cholesterol homeostasis. Nat Rev Mol Cell Biol. 2019. Epub 2019/12/19. 10.1038/s41580-019-0190-7 . - DOI - PubMed
    1. Goldstein JL, Brown MS. A century of cholesterol and coronaries: from plaques to genes to statins. Cell. 2015;161(1):161–72. Epub 2015/03/31. 10.1016/j.cell.2015.01.036 - DOI - PMC - PubMed
    1. Kathiresan S, Srivastava D. Genetics of human cardiovascular disease. Cell. 2012;148(6):1242–57. Epub 2012/03/20. 10.1016/j.cell.2012.03.001 - DOI - PMC - PubMed
    1. Horton JD, Cohen JC, Hobbs HH. Molecular biology of PCSK9: its role in LDL metabolism. Trends Biochem Sci. 2007;32(2):71–7. Epub 2007/01/12. 10.1016/j.tibs.2006.12.008 - DOI - PMC - PubMed

Publication types