. 2021 Apr;15(4):866-886.
doi: 10.1002/1878-0261.12910. Epub 2021 Mar 9.

Single-cell transcriptomics reveal the intratumoral landscape of infiltrated T-cell subpopulations in oral squamous cell carcinoma

Affiliations

Single-cell transcriptomics reveal the intratumoral landscape of infiltrated T-cell subpopulations in oral squamous cell carcinoma

Jingtao Chen et al. Mol Oncol. 2021 Apr.

Abstract

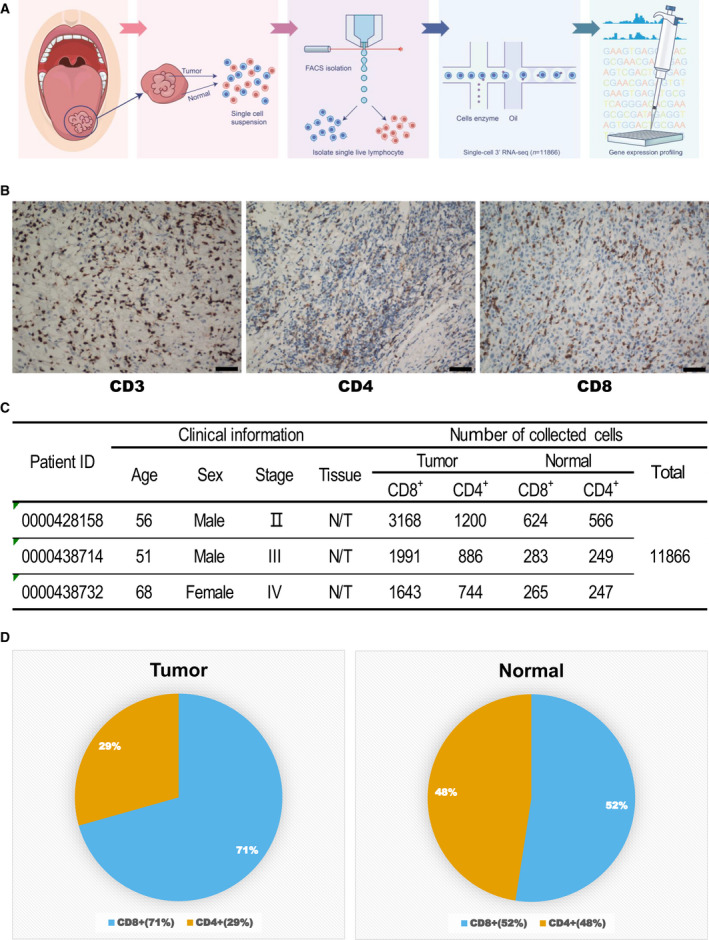
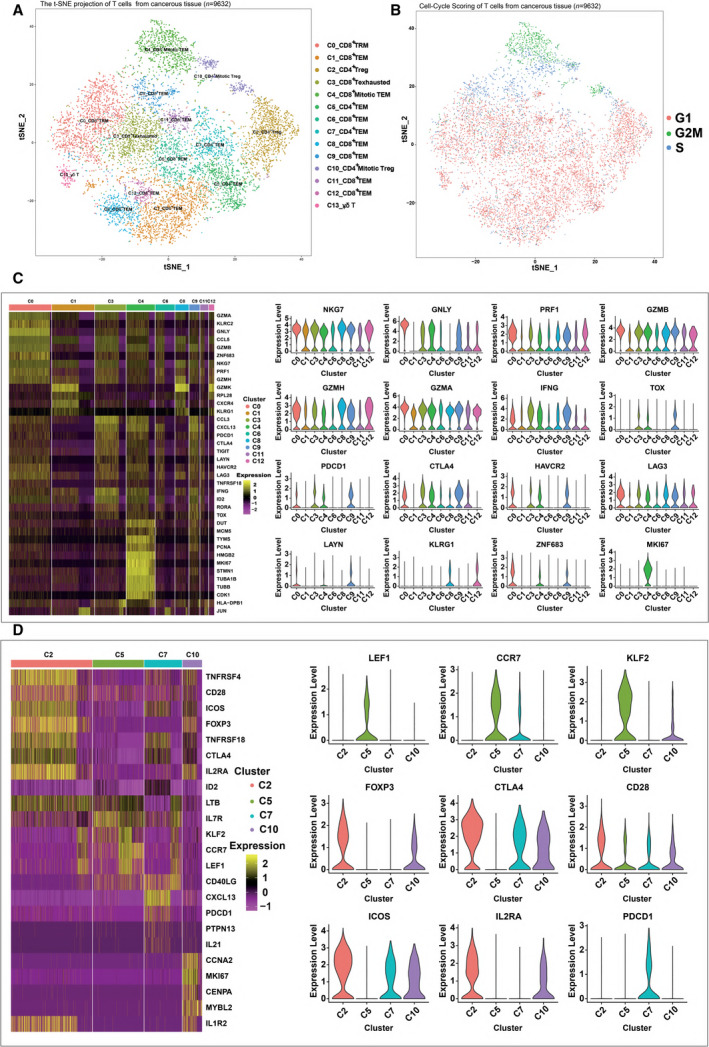
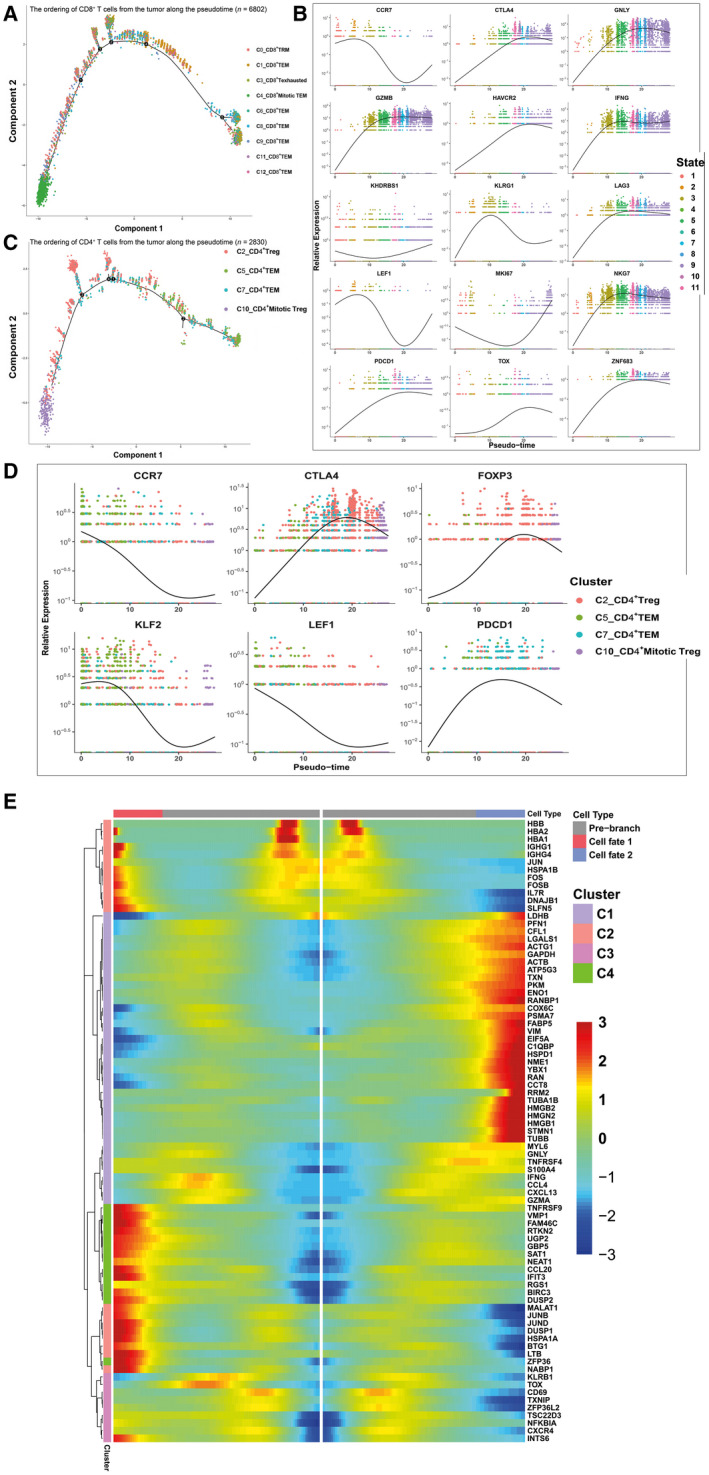
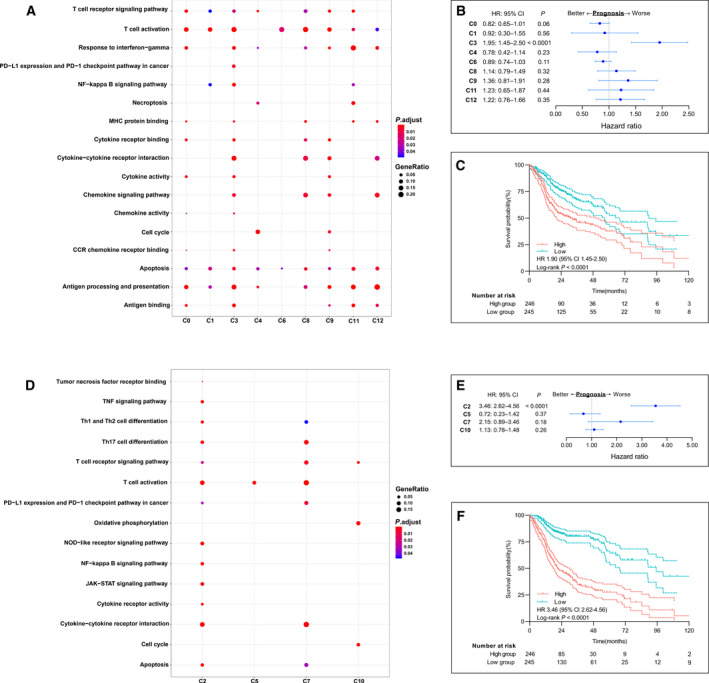
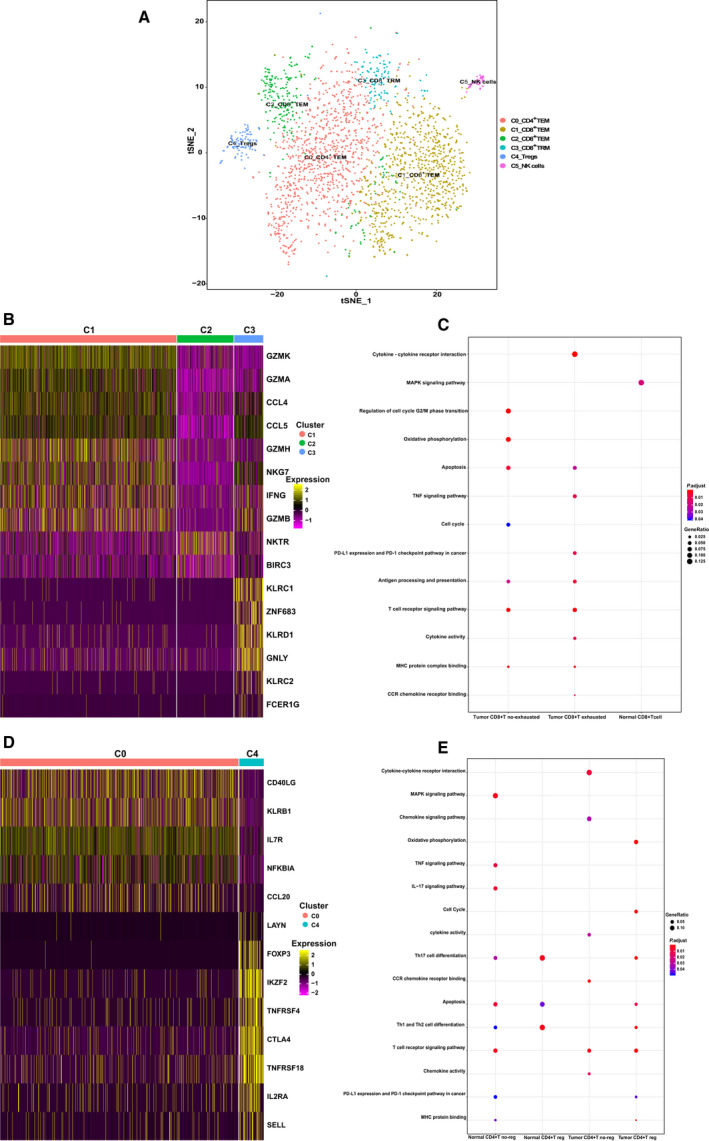
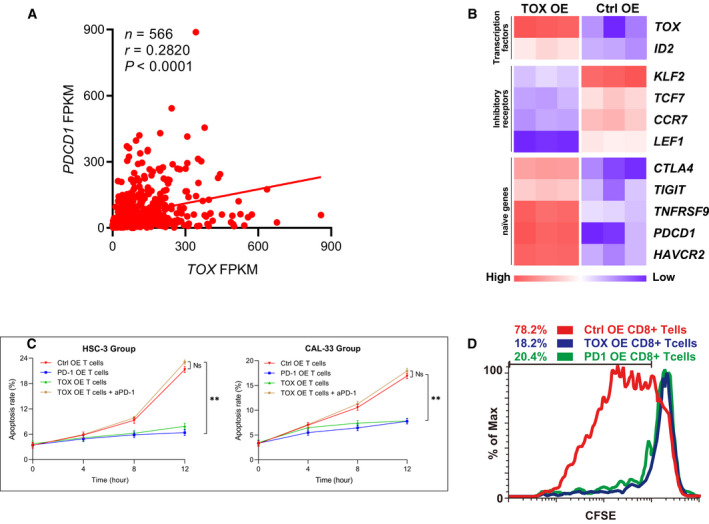
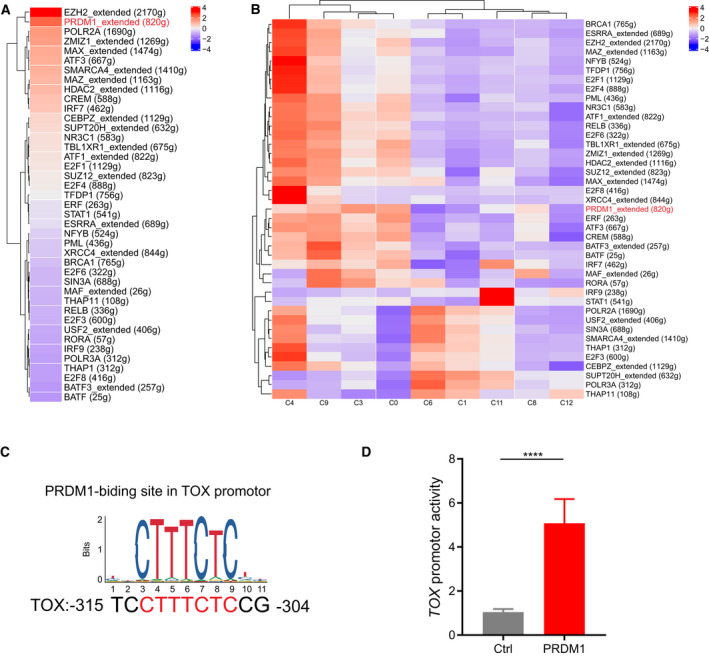
Systematic analysis of tumor-infiltrating lymphocytes is essential for the development of new cancer treatments and the prediction of clinical responses to immunotherapy. Immunomodulatory drugs are used for the treatment of oral squamous cell carcinoma (OSCC), depending on immune infiltration profiles of the tumor microenvironment. In this study, we isolated 11,866 single T cells from tumors and paired adjacent normal tissues of three patients with OSCC. Using single-cell RNA sequencing, we identified 14 distinct T-cell subpopulations within the tumors and 5 T-cell subpopulations in the adjacent normal tissues and delineated their developmental trajectories. Exhausted CD8+ T cells and regulatory CD4+ T cells (CD4+ Tregs) were enriched in OSCC tumors, potentially linked to tumor immunosuppression. Programmed death protein 1 (PD-1) and cytotoxic T lymphocyte-associated protein 4 (CTLA4) were identified as marker genes in exhausted CD8+ T cells, whereas forkhead box P3 (FOXP3) and CTLA4 were identified as markers of CD4+ Tregs. Furthermore, our data revealed that thymocyte selection-associated high-mobility group box (TOX) may be a key regulator of T-cell dysfunction in the OSCC microenvironment. Overexpression of TOX upregulated expression of genes related to T-cell dysfunction. In vitro experiments demonstrated that cytotoxic activity and proliferation efficiency of CD8+ T cells overexpressing PD-1 or TOX were reduced. Notable, the transcription factor PRDM1 was found to transactivate TOX expression via a binding motif in the TOX promoter. Our findings provide valuable insight into the functional states and heterogeneity of T-cell populations in OSCC that could advance the development of novel therapeutic strategies.

Keywords: T-cell exhaustion; cancer immunology; oral squamous cell carcinoma; single-cell sequencing; tumor-infiltrating lymphocytes.


Conflict of interest statement

The authors declare no conflict of interest.

Figures

Fig. 1
Fig. 1
Overall characteristics of oral squamous cell carcinoma (OSCC) samples used for single‐cell RNA sequencing (scRNA‐seq). (A) Workflow for collection and processing of fresh biopsy samples of primary oral squamous cell carcinoma and matched adjacent normal tissues for scRNA‐seq. (B) Immunohistochemical staining using anti‐CD3, CD4, and CD8 antibodies. Scale bars, 100 μm. (C) Clinical characteristics of patients with OSCC and number of T cells sequenced. N/T represents T cells isolated from adjacent normal and tumor tissues. (D) The proportion of CD4+ and CD8+ cells in the tumor and normal tissues.
Fig. 2
Fig. 2
Expression heterogeneity of CD8+ and CD4+ T cells in the OSCC ecosystem. (A) The t‐distributed stochastic neighbor embedding (t‐SNE) projection of T cells from cancerous tissue of patients with OSCC, showing the formation of 11 main clusters in different colors. The functional description of each cluster is determined by the gene expression characteristics. Cluster 0: resident memory CD8+ T Cells (C0_CD8+ TRM); Cluster 1: effector memory CD8+ T cells (C1_CD8+ TEM); Cluster 2: regulatory CD4+ T cells (C2_CD4+ Treg); Cluster 3: exhausted CD8+ T cells (C3_CD8+ T Exhausted); Cluster 4: effector memory M‐phage CD8+ T cells (C4_CD8+ Mitotic TEM); Cluster 5: effector memory CD4+ T cells (C5_CD4+ TEM); Cluster 6: effector memory CD8+ T cells (C6_CD8+ TEM); Cluster 7: effector memory CD4+ T cells (C7_CD4+ TEM); Cluster 8: effector memory CD8+ T cells (C8_CD8+ TEM); Cluster 9: effector memory CD8+ T cells (C9_CD8+ TEM); Cluster 10: effector memory M‐phage CD4+ T cells (C10_CD4+ Mitotic TEM); Cluster 11: effector memory CD8+ T cells (C11_CD8+ TEM); Cluster 12: effector memory CD8+ T cells (C12_CD8+ TEM); Cluster 13: γδ T. (B) Cell‐Cycle Scoring of T cells from cancerous tissue of patients with OSCC, showing the three clusters of cells in different cell cycles in different colors. (C) Heatmap of key genes expressed in each cluster of CD8+ tumor‐infiltrating lymphocytes (TILs) with cells grouped by clusters. The columns correspond to the cells; the rows correspond to the genes. Yellow: high expression; purple: low expression. Selected key markers are shown on the right. (D) Heatmap of key genes expressed in each cluster of CD4+ TILs with cells grouped by clusters. The columns correspond to the cells; the rows correspond to the genes. Yellow: high expression; purple: low expression. Selected key genes are shown on the right.
Fig. 3
Fig. 3
Gene expression dynamics along the pseudotime of T‐cell development. (A) The ordering of CD8+ T cells from the tumor along the pseudotime in a two‐dimensional state‐space. Each point corresponds to a single cell, and each color represents a T‐cell cluster. (B) The ordering of the different marker genes of CD8+ T cells from the tumor along the pseudotime in a two‐dimensional state‐space. Each point corresponds to a single cell, and each color represents a T‐cell cluster. A natural spline was used to model gene expression as a smooth, nonlinear function over the pseudotime. (C) The ordering of CD4+ T cells from the tumor along the pseudotime in a two‐dimensional state‐space. Each point corresponds to a single cell, and each color represents a T‐cell cluster. (D) The ordering of the different marker genes of CD4+ T cells from the tumor along the pseudotime in a two‐dimensional state‐space. Each point corresponds to a single cell, and each color represents a T‐cell cluster. A natural spline was used to model gene expression as a smooth, nonlinear function over the pseudotime. (E) Heatmap depicting genes in a branch‐dependent manner for branch point 4. Each row represents the dynamic expression of a gene.
Fig. 4
Fig. 4
Prognostic values of immune signatures of each cluster of T cells in patients with OSCC. (A) Gene Ontology (GO) Biological Process enrichment plot for clusters of CD8+ T cells in tumors. (B) Forest plots show hazard ratios (HRs; blue squares), confidence intervals (CIs, horizontal ranges), and P values of each signature gene cluster of CD8+ T cells; cluster 3 has a clear prognostic value (HR: 1.95, 95% CI: 1.45–2.50, log‐rank P < 0.0001). (C) Survival curves of The Cancer Genome Atlas (TCGA) cohorts of patients with head and neck squamous cell carcinoma (HNSCC). Patients were grouped according to the level of cluster 3 gene signature derived from single‐cell data (HR: 1.95, 95% CI: 1.45‐2.50, log‐rank P <0.0001). (D) GO enrichment plots for clusters of CD4+ T cells in tumor. (E) Forest plots show HRs (blue squares), CIs (horizontal ranges) and P values of each cluster signature genes of CD4+ T cells; cluster 2 has a clear prognostic value (HR: 3.46, 95% CI: 2.62–4.56, log‐rank < 0.0001). (F) Survival curves of TCGA cohorts of patients with head and neck squamous cell carcinoma (HNSCC). Patients were grouped according to the level of cluster 2 gene signature derived from single‐cell data (HR: 3.46, 95% CI: 2.62–4.56, log‐rank <0.0001).
Fig. 5
Fig. 5
Heterogeneity of CD8+ and CD4+ T cells in normal tissue. (A) The t‐distributed stochastic neighbor embedding (t‐SNE) projection of T cells from adjacent normal tissue of patients with OSCC, showing the formation of six main clusters in different colors. The functional description of each cluster is determined by the gene expression characteristics. Cluster 0: C0_CD4+ TEM; Cluster 1: C1_CD8+ TEM; Cluster 2: C2_CD8+ TEM; Cluster 3: C3_CD8+ TRM; Cluster 4: C4_Tregs; Cluster 5: C5_NK cells. (B) Heatmap of key genes expressed in normal tissue CD8+ T‐cell clusters with cells grouped by clusters. Columns correspond to the cells, and rows correspond to the genes. Yellow: high expression; purple: low expression. Selected key genes are shown on the right. (C) Gene ontology (GO) enrichment plots for CD8+ T cells in the tumor and adjacent normal tissue. (D) Heatmap of normal CD4+ T cells, with two main clusters identified, each containing a unique set of signature genes. Selected genes with high expression are shown on the right. Yellow: high expression; red: low expression. (E) GO enrichment plots for CD4+ T cells in the tumor and adjacent normal tissue.
Fig. 6
Fig. 6
Results of immunohistochemical staining using antiprogrammed death protein‐1 (PD‐1) and PD‐ligand 1 (PD‐L1) antibodies (= 30). Scale bars, 100 μm. (A) Positive staining for PD‐1 on tumor‐infiltrating lymphocytes. (B) Negative staining for PD‐1 on normal tissue‐infiltrating lymphocytes. (C) Positive staining for PD‐L1 on tumor cells. (D) Negative staining for PD‐L1 on normal cells.
Fig. 7
Fig. 7
In vitro experiments on the effects of and thymocyte selection‐associated high‐mobility group box (TOX) on the antitumor function of human T cells. (A) Schematic of linear regression revealed a positive correlation between TOX expression level and (programmed death protein 1) PDCD1 expression level in The Cancer Genome Atlas (TCGA) expression profiles (t‐test, < 0.01. = 566). (B) The overexpression of TOX led to reduced expression of TCF7, KLF2, LEF1, and CCR7, and increased expression of PDCD1, TIGIT, CTLA4, HAVCR2, TNFRSF9, and ID2. (C) Line graph of apoptosis assays of tumor cells cocultured for 12 h using fluorescence‐activated cell sorting (t‐test, < 0.01, = 3) . Data are presented as means ± SD. (D) Proliferation efficiency of three types of CD8+ T cells: control (Ctrl), overexpressing (OE) CD8+ T cells, PDCD1 OE CD8+ T cells, and TOX‐overexpressing OE CD8+ T cells detected using carboxyfluorescein succinimidyl amino ester (CFSE).
Fig. 8
Fig. 8
PRDM1 activated TOX gene transcription. (A) Transcription factor networks that drive the expression of TOX in total CD8+ T cells predicted by SCENIC. (B) Heatmap of regulators predicted by SCENIC that drives the expression of TOX in CD8+ T cells clusters. The PRDM1 regulon is indicated in red. (C) A conserved PRDM1‐binding motif at the TOX promoter was predicted by JASPAR. (D) Dual‐luciferase reporter assays of Jurkat cells transfected with PRDM1 overexpression plasmid and reporter plasmid containing TOX promoter (ANOVA, < 0.0001, = 3). Jurkat cells transfected with a blank pGL3 plasmid served as a negative control. Data are presented as means ± SD.

References

    1. Stratton MR, Campbell PJ & Futreal PA (2009) The cancer genome. Nature 458, 719–724. - PMC - PubMed
    1. Weinberg RA (2014) Coming full circle—from endless complexity to simplicity and back again. Cell 157, 267–271. - PubMed
    1. Meacham CE & Morrison SJ (2013) Tumour heterogeneity and cancer cell plasticity. Nature (London) 501, 328–337. - PMC - PubMed
    1. Tirosh I, Izar B, Prakadan SM, Wadsworth MH, Treacy D, Trombetta JJ, Rotem A, Lian C, Murphy G, Fallahi‐Sichani M, et al. (2016) Dissecting the multicellular ecosystem of metastatic melanoma by single‐cell RNA‐seq. Science 352, 189–196. - PMC - PubMed
    1. Ferlay J, Colombet M, Soerjomataram I, Mathers C, Parkin Dm, Piñeros M, Znaor A & Bray F (2019) Estimating the global cancer incidence and mortality in 2018: GLOBOCAN sources and methods. Int J Cancer 144, 1941–1953. - PubMed

Publication types