. 2021 Feb 9;16(2):252-263.
doi: 10.1016/j.stemcr.2020.12.018. Epub 2021 Jan 28.

Gene Therapy of Dominant CRX-Leber Congenital Amaurosis using Patient Stem Cell-Derived Retinal Organoids

Affiliations

Gene Therapy of Dominant CRX-Leber Congenital Amaurosis using Patient Stem Cell-Derived Retinal Organoids

Kamil Kruczek et al. Stem Cell Reports. .

Abstract

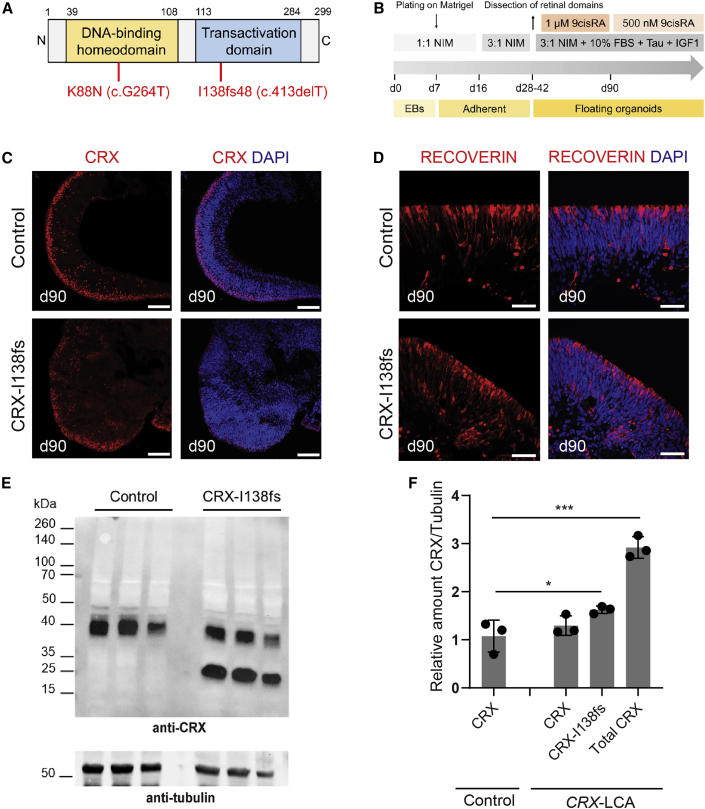
Mutations in the photoreceptor transcription factor gene cone-rod homeobox (CRX) lead to distinct retinopathy phenotypes, including early-onset vision impairment in dominant Leber congenital amaurosis (LCA). Using induced pluripotent stem cells (iPSCs) from a patient with CRX-I138fs48 mutation, we established an in vitro model of CRX-LCA in retinal organoids that showed defective photoreceptor maturation by histology and gene profiling, with diminished expression of visual opsins. Adeno-associated virus (AAV)-mediated CRX gene augmentation therapy partially restored photoreceptor phenotype and expression of phototransduction-related genes as determined by single-cell RNA-sequencing. Retinal organoids derived from iPSCs of a second dominant CRX-LCA patient carrying K88N mutation revealed the loss of opsin expression as a common phenotype, which was alleviated by AAV-mediated augmentation of CRX. Our studies provide a proof-of-concept for developing gene therapy of dominant CRX-LCA and other CRX retinopathies.

Keywords: 3-D organoids; AAV; disease modeling; iPSC; pluripotent stem cells; retinal degeneration; scRNA-seq; therapy; transcription factor; transcriptome.


Figures

None
Graphical abstract
Figure 1
Figure 1
Differentiation of Photoreceptors in CRX-I138fs Retinal Organoids (A) Schematic representation of CRX protein, showing domain structure and the positions of dominant pathological mutations in the study patients. Number of amino acid residue is indicated over the bar. N and C indicate amino- and carboxyl-terminal of the CRX protein. (B) An overview of the retinal organoid differentiation protocol. (C) CRX expression in developing photoreceptors at day 90. CRX antibody labeled apically aligning developing photoreceptors in both control and patient organoids. Scale bar, 50 μm. Note a more diffuse pattern in the patient sample. Nuclei were stained with DAPI (4′,6-diamidino-2-phenylindole). (D) Developing photoreceptors of both genotypes also express the marker protein Recoverin. Scale bar, 20 μm. (E) Immunoblot analysis of organoid protein extracts at day 90. Molecular mass markers (kDa) are indicated on the left. Protein samples from control and patient stem cell-derived organoids (n = 3 biological replicates containing three organoids each) were run in separate lanes. Tubulin was used as a loading control. A smaller molecular weight band, which corresponds to the mutant CRX-I138fs48 isoform, is evident in the patient samples. (F) Densitometry quantification of CRX protein bands normalized to the Tubulin loading control. Total CRX protein is significantly more abundant in CRX-I138fs patient samples. Mean ± SD plotted, p < 0.05, ∗∗∗p < 0.001, one-way ANOVA.
Figure 2
Figure 2
Impaired Photoreceptor Maturation in CRX-LCA Retinal Organoids (A) Brightfield images of apical aspect of organoid neural retina. Scale bar, 400 μm. Note loss of brush-like outer segment (OS) structures in patient (arrowheads). (B) Rhodopsin (RHO) immunostaining at day 125 and fluorescence intensity quantification. Nuclei were stained with DAPI (4′,6-diamidino-2-phenylindole). Scale bar, 20 μm. (C) L/M Opsin immunostaining with quantification of positive cells. Scale bar, 20 μm. (D) Representative whole-mount confocal images of organoids at day 200 immunostained for RHO, L/M Opsin, and Visual System Homeobox 2 (VSX2). Scale bar, 160 μm. (E) Peripherin2 (PRPH2) staining and puncta quantification. Scale bar, 10 μm. (F) Heatmap comparing expression of genes (bulk RNA-seq) across organoid development (days 90, 125, 150, and 200). Values are shown as log2(CPM+1). TFs, transcription factors; OS, outer segment. Number of organoids per genotype analyzed for quantifications: (A) control n = 10, patient n = 10; (B) control n = 8, patient n = 5; (C) n = 5 control, n = 3 patient; (E) control n = 3, patient n = 3. Values represent mean ± SD with individual data points plotted (three sections per organoid). Statistical significance was determined by Student’s t test; p values indicated.
Figure 3
Figure 3
AAV-Delivered Gene Augmentation for CRX-LCA Caused by I138fs Mutation (A) Transduction of CRX-expressing cells by AAV2 and AAV8 serotypes. Quantification of percent of AAV-delivered GFP reporter in CRX-positive cells on control organoid cryosections. Scale bar, 20 μm. For both serotypes, n = 4 organoids, three sections each averaged; mean ± SD, statistical significance by Student’s t test, p value indicated. (B) Promoter testing in retinal organoids. Comparison of GFP reporter expression driven by CMV or CRX promoters in day 150 control organoids (left; scale bar, 20 μm). Note broad expression using CMV as compared with localization primarily to outer organoid layer with CRX promoter. GFP expression driven by CRX promoter in CRX-I138fs48 patient organoids at day 200 (right). Nuclei were stained with DAPI (4′,6-diamidino-2-phenylindole). Scale bar, 200 μm. (C) Schematic representation of the therapeutic AAV vector design and testing in retinal organoids. (D and E) Rhodopsin (D) and Cone L/M Opsin (E) staining in healthy control, and untreated and AAV-treated patient retinal organoids at day 180. Two doses of AAV-CRX vector were tested (1×10¹¹ and 3×10¹¹ vg per organoid). Scale bar, 20 μm. Efficiency of treatment was evaluated with quantification of Rhodopsin expression rescue and percentage of L/M Opsin + cones. Number of organoids analyzed for quantifications: (D) control n = 4, untreated and AAV-treated n = 3 each dose; (E) control and untreated n = 6; AAV-treated n = 5 each dose; three sections each. Values represent mean ± SD with individual data points plotted. Statistical significance was determined by one-way ANOVA; p values indicated.
Figure 4
Figure 4
Long-Term Effects of AAV-CRX Gene Augmentation in CRX-I138fs Retinal Organoids Retinal organoids were transduced at day 120 with AAV-CRX vector at 1×10¹¹ vg per organoid and examined 180 days later, at day 300 in culture. Immunostaining for (A) Rhodopsin, (B) L/M Opsin, (C) cleaved Caspase3. Nuclei were counterstained with DAPI. Note the continued presence of cells with rescued expression of opsins. Prolonged CRX expression does not appear to induce apoptotic cell death in the photoreceptor layer, where cleaved Caspase3 staining is absent (C, left), in contrast to the core region of the organoid showing extensive apoptosis in extended culture (C, right). Scale bar in all images, 20 μm.
Figure 5
Figure 5
Altered Gene Expression Patterns and AAV Treatment Effects in Cone and Rod Photoreceptor Subtypes of CRX-I138fs48 Patient Retinal Organoids at day 200 (A) Top: UMAP representation of the single-cell RNA-seq dataset (n = 40,712 transcriptomes) displaying major cell types (annotated using known cell-type marker genes). Bottom: UMAP plots showing the distribution of cells of control (n = 2 biological replicates, 4 organoids each), and untreated and AAV-CRX (n = 2 biological replicates, 3 organoids each) organoid samples. (B) Expression of photoreceptor cell-type- (CRX, RCVRN) and subtype-specific markers (rods: GNGT1, GNAT1; cones: ARR3, PDE6H). (C) Violin plot profiles of CRX expression levels in rods and cones. Note increased expression with AAV-CRX gene augmentation. (D–I) Treatment effects in rod (D–F) and cone (G–I) photoreceptor subtypes. (D and G) UMAP plots showing the distribution of rod and cone cells by sample origin (control, blue; untreated, red; AAV-CRX, green). (E and H) Hexagonal bin plots illustrating identity of cell origin (coloring each hexagon according to the origin of the majority of cells it covers). Note placement of AAV-CRX treatment between patient and control sample majority areas. (F and I) Opsin transcript reads in the different samples visualizing increased expression in patient-derived samples following treatment. Percentages of cells of each origin in which transcript reads were detected are indicated.
Figure 6
Figure 6
Disease Phenotype and Gene Augmentation Therapy of CRX-K88N Patient Retinal Organoids (A) Brightfield images of control and CRX-K88N patient organoids showing reduced outer segment (OS) apical “brush” layer (arrowheads). (B) Quantification of the outer segment-like layer thickness; n = 6 organoids per group, three sections each; mean ± SD, p values from one-way ANOVA. (C) Immunostaining of organoids at day 200 for CRX, Recoverin, Rhodopsin and L/M Opsin. Note diminished Rhodopsin and L/M Opsin staining in patient-derived organoids. Nuclei were stained with DAPI (4′,6-diamidino-2-phenylindole). Scale bar, 100 μm. (D) Heatmap comparing expression of genes (bulk RNA-seq) of day 120 and day 200 organoids. Expression of many photoreceptor-specific transcripts is either delayed or reduced in CRX-K88N patient samples. Normalized log2(CPM+1) values plotted. TFs, transcription factors; OS, outer segment. (E) AAV treatment assessment by immunostaining. Immunoreactivity for both Rhodopsin and L/M Opsin is partially restored following AAV treatment. Scale bar, 100 μm. (F) Quantification of Rhodopsin fluorescence intensity in AAV-treated retinal organoids. Control n = 6, untreated n = 5, and AAV-treated n = 6 organoids; three sections each; mean ± SD, p values from one-way ANOVA. (G) Quantification of the percentage of L/M Opsin + cones in AAV-treated retinal organoids. Control n = 7, untreated n = 7, and AAV-treated n = 8 organoids; three sections each; mean ± SD, p values from one-way ANOVA.

References

    1. Ahmed C.M., Dwyer B.T., Romashko A., Van Adestine S., Park E.H., Lou Z., Welty D., Josiah S., Savinainen A., Zhang B. SRD005825 acts as a pharmacologic chaperone of opsin and promotes survival of photoreceptors in an animal model of autosomal dominant retinitis pigmentosa. Transl. Vis. Sci. Technol. 2019;8:30. - PMC - PubMed
    1. Apte R.S. Gene therapy for retinal degeneration. Cell. 2018;173:5. - PubMed
    1. Assawachananont J., Kim S.Y., Kaya K.D., Fariss R., Roger J.E., Swaroop A. Cone-rod homeobox CRX controls presynaptic active zone formation in photoreceptors of mammalian retina. Hum. Mol. Genet. 2018;27:3555–3567. - PMC - PubMed
    1. Capowski E.E., Samimi K., Mayerl S.J., Phillips M.J., Pinilla I., Howden S.E., Saha J., Jansen A.D., Edwards K.L., Jager L.D. Reproducibility and staging of 3D human retinal organoids across multiple pluripotent stem cell lines. Development. 2019;146:dev171686. - PMC - PubMed
    1. Collin J., Queen R., Zerti D., Dorgau B., Hussain R., Coxhead J., Cockell S., Lako M. Deconstructing retinal organoids: single cell RNA-seq reveals the cellular components of human pluripotent stem cell-derived retina. Stem Cells. 2019;37:593–598. - PMC - PubMed

Publication types

MeSH terms