. 2021 Feb 9;16(2):264-280.
doi: 10.1016/j.stemcr.2020.12.019. Epub 2021 Jan 28.

Cell-to-Cell Adhesion and Neurogenesis in Human Cortical Development: A Study Comparing 2D Monolayers with 3D Organoid Cultures

Affiliations

Cell-to-Cell Adhesion and Neurogenesis in Human Cortical Development: A Study Comparing 2D Monolayers with 3D Organoid Cultures

Soraya Scuderi et al. Stem Cell Reports. .

Abstract

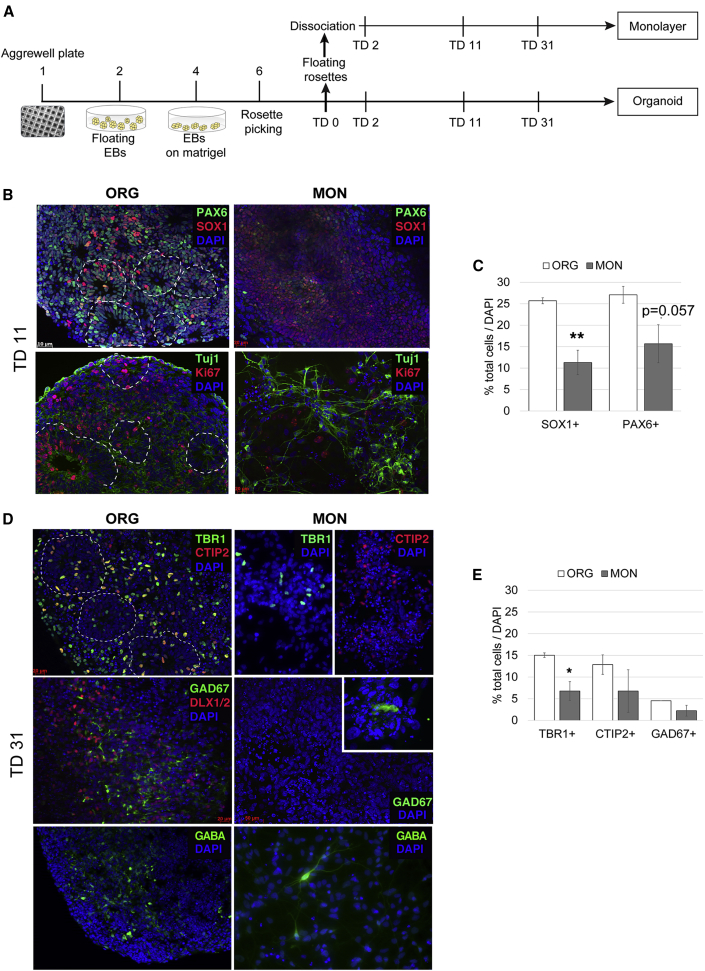
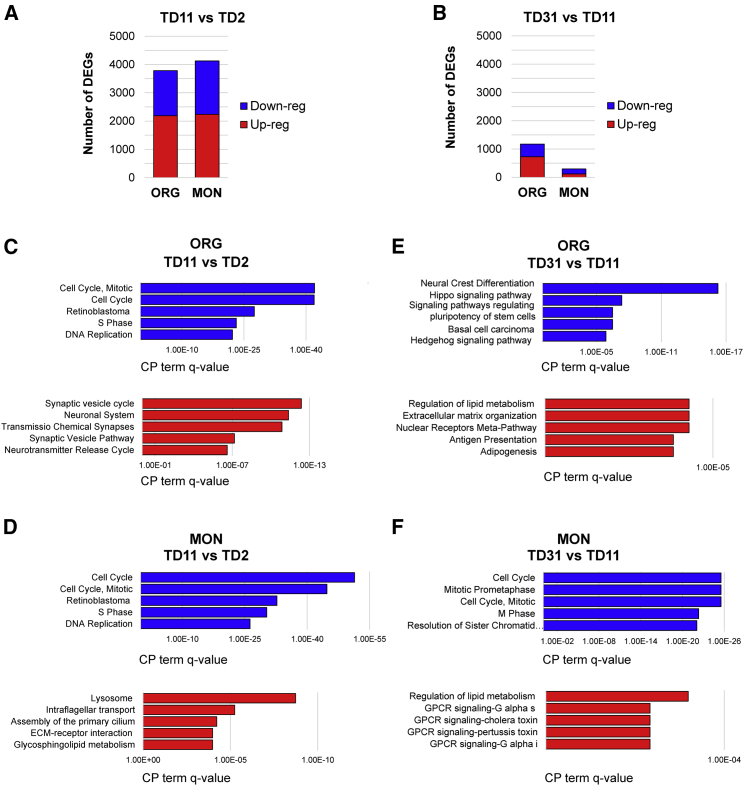
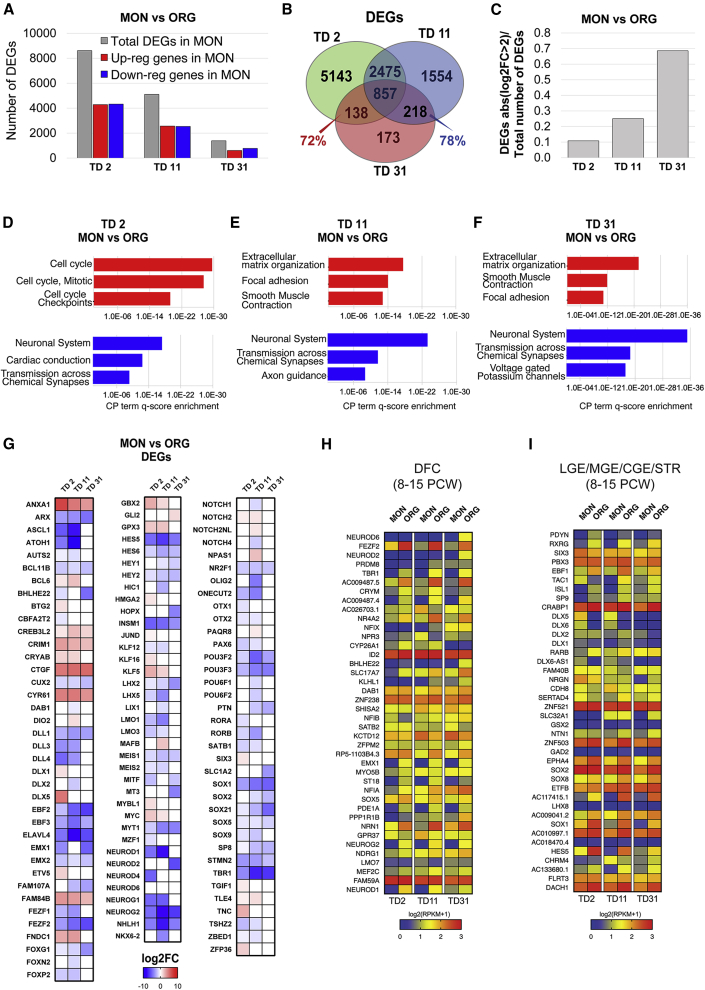
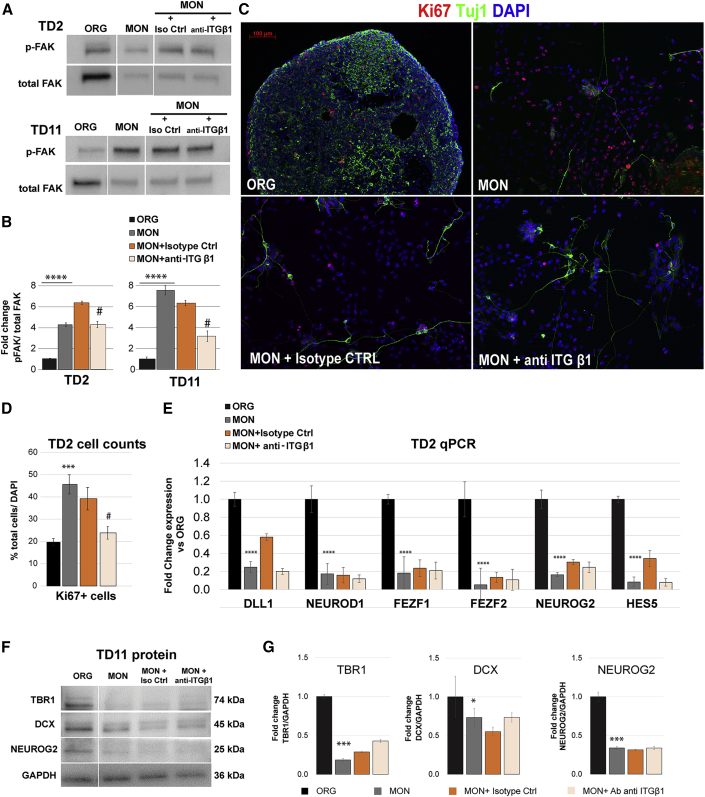
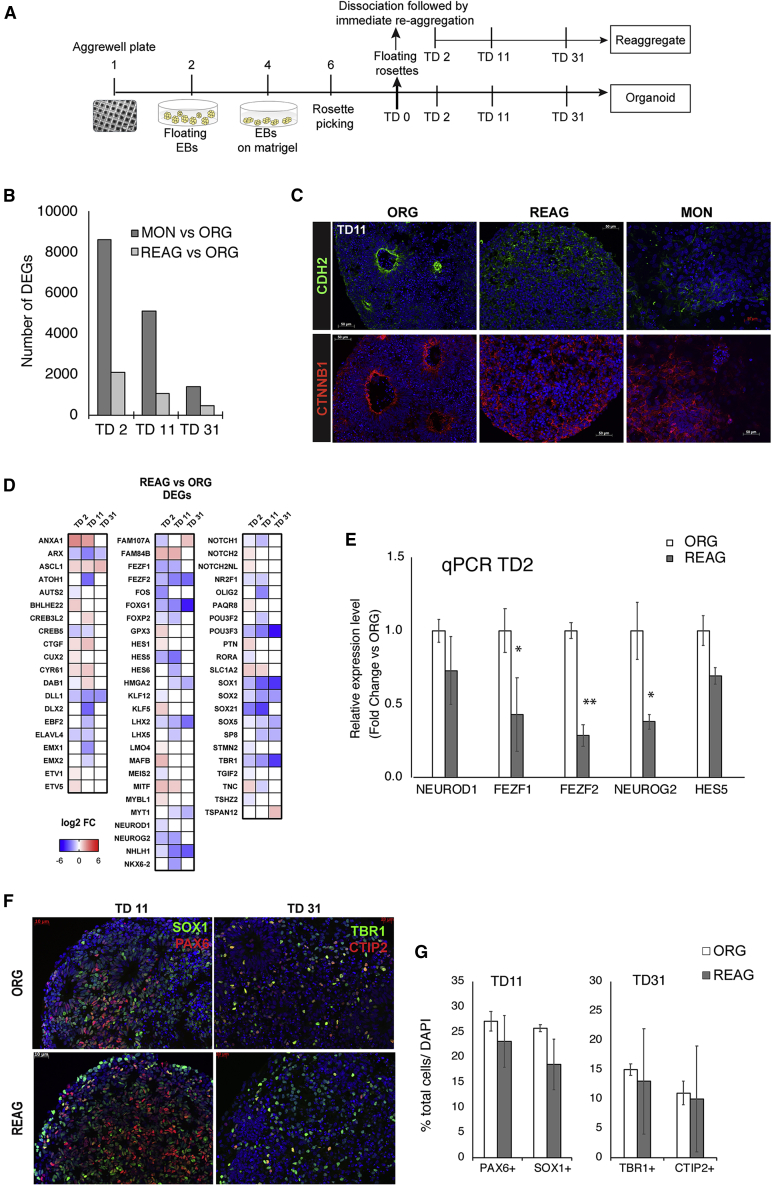
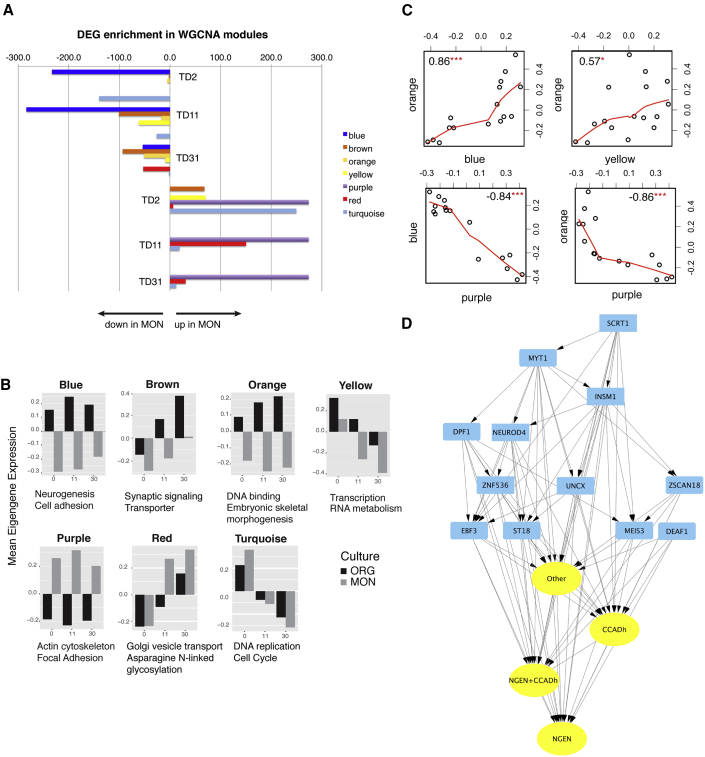
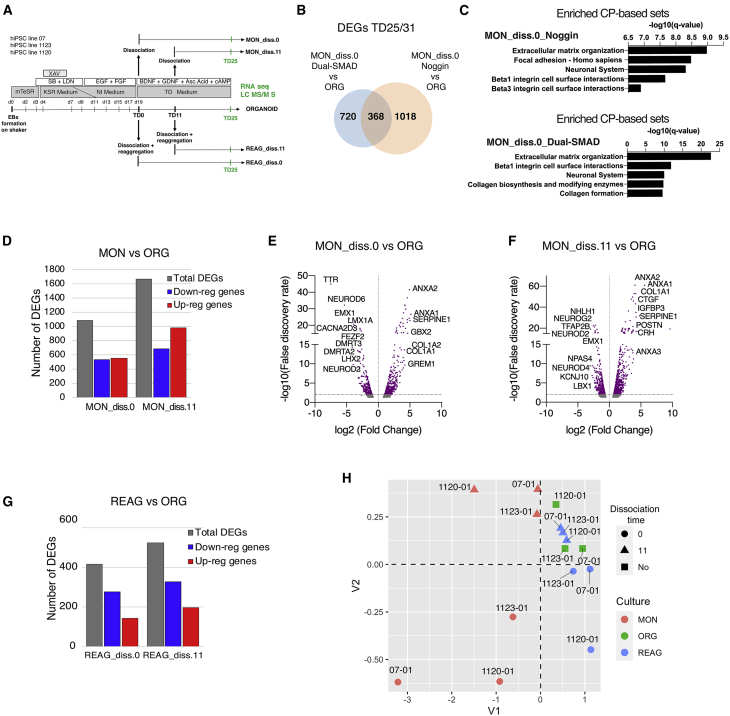
Organoids (ORGs) are increasingly used as models of cerebral cortical development. Here, we compared transcriptome and cellular phenotypes between telencephalic ORGs and monolayers (MONs) generated in parallel from three biologically distinct induced pluripotent stem cell (iPSC) lines. Multiple readouts revealed increased proliferation in MONs, which was caused by increased integrin signaling. MONs also exhibited altered radial glia (RG) polarity and suppression of Notch signaling, as well as impaired generation of intermediate progenitors, outer RG, and cortical neurons, which were all partially reversed by reaggregation of dissociated cells. Network analyses revealed co-clustering of cell adhesion, Notch-related transcripts and their transcriptional regulators in a module strongly downregulated in MONs. The data suggest that ORGs, with respect to MONs, initiate more efficient Notch signaling in ventricular RG owing to preserved cell adhesion, resulting in subsequent generation of intermediate progenitors and outer RG, in a sequence that recapitulates the cortical ontogenetic process.

Keywords: Notch signaling; RNA-seq; cerebral cortex; human; iPSCs; network analyses; organoids; proteomics.


Figures

Figure 1
Figure 1
Comparison of 2D versus 3D In Vitro Cell Cultures (A) Experimental design. TD, terminal differentiation day; EB, embryoid bodies; MON, monolayer; ORG, organoid. (B) Representative images of immunocytochemical staining with the dorsal telencephalic marker PAX6, the neuroectodermal marker SOX1, the proliferative marker Ki67, and the neuron-specific class III β-tubulin at TD11. (C) Proportion of SOX1+ and PAX6+ cells by stereological quantification over DAPI+ nuclei. (D) Immunocytochemical staining of excitatory (TBR1+ and CTIP2+) and inhibitory (GABA+, GAD67+) cortical neurons at TD31. (E) Proportion of excitatory and inhibitory neurons over DAPI+ nuclei assessed by stereological analysis. Results in (C and E) are the mean ± SEM of n = 3 biologically different iPSC lines per condition (ORG, MON) differentiated in parallel with two technical replicates per cell line. ∗∗p < 0.01, p < 0.05 Student's t test, two tailed. See also Figure S1.
Figure 2
Figure 2
Longitudinal Differential Gene Expression Analysis in ORGs and MONs (A and B) Number of differentially expressed genes (DEGs) at the first transition (TD11 versus TD2) (A) and at the second transition (TD31 versus TD11) (B) within each model. Blue, downregulated genes; red, upregulated genes. (C–F) Canonical pathway (CP) term enrichment for genes upregulated (red) and downregulated (blue) per transition as indicated: (C and D) TD11 versus TD2; (E and F) TD31 versus TD11. The x axis indicates FDR-corrected p value in reverse order. For full annotation see Table S2. Results are from between two and three biologically different iPSC lines differentiated in parallel.
Figure 3
Figure 3
Comparison of MON and ORG Transcriptional Profiles at Three Different Stages of Neuronal Differentiation (TD2, TD11, and TD31) (A) Total number of DEGs (gray bar), downregulated DEGs (blue bar), and upregulated DEGs (red bar) in MONs versus ORGs. (B) Venn diagram of DEGs in MONs versus ORGs at each time point. (C) Ratio between the number of highly differentially expressed genes (absolute value [log2 fold change > 2]) and the total number of DEGs in MONs versus ORGs along the time course. (D–F) CP term enrichment for genes upregulated (red) and downregulated (blue) in MONs versus ORGs at each time point, TD2 (D), TD11 (E), and TD31 (F), with the FDR-corrected p value in reverse order on the x axis. For full annotation see Table S3. (G) Heatmap displaying the log2 fold change values of transcripts from the Neuronal Cell Fate sublist (Table S4A) differentially expressed in MONs versus ORGs. (H and I) Expression level (log2 (RPKM +1)) in MONs and ORGs of genes that are highly expressed in human dorsolateral prefrontal cortex (DFC) (H) versus basal telencephalon (lateral ganglionic eminence, medial ganglionic eminence, caudal ganglionic eminence, and striatum) or highly expressed in basal telencephalon versus DFC (I).
Figure 4
Figure 4
β1 Integrin Signaling Increases MON Cell Proliferation at Early Stages of Differentiation (A and B) Western blot analysis (A) and quantification of protein expression level (B) of phospho-FAK in ORG, MON and MON treated with either an isotype control antibody (Iso Ctrl) or an anti-β1-integrin antibody (anti- β1ITG) at TD2 and TD11. (C and D) Representative images (C) and stereological quantification (D) of immunostaining with the proliferative marker Ki67 and the neuron-specific marker TUJ1 at TD2 under the conditions described above. (E) Relative expression level of a subset of genes from the Neuronal Cell Fate list (Table S4A) at TD2. (F and G) Western blot analysis (F) and quantification of protein expression level (G) of TBR1, DCX, and NEUROG2 at TD11. GAPDH was used as loading control. Data are expressed as mean ± SEM of n = 3 preparations per condition (ORGs or MONs with or without each antibody) from one iPSC line. p < 0.05, ∗∗∗p < 0.01, ∗∗∗∗p < 0.001; MONs versus ORGs; #p < 0.05 MONs + anti-ITGβ1 versus MONs + Isotype Ctrl. One-way ANOVA with Tukey multiple comparisons test. See also Figure S4.
Figure 5
Figure 5
Dissociation followed by Immediate Reaggregation (A) Experimental design. (B) Number of DEGs, at each time point, for the comparisons REAGs versus ORGs and MONs versus ORGs. (C) Representative images of immunocytochemical staining for N-cadherin (CDH2, green) and β-catenin (CTNNB1, red) at TD11 in ORG, REAGs, and MON preparations (DAPI+ nuclei in blue). (D and E) Heatmap showing the log2 fold change (D) and bar graph of mRNA expression level by qPCR (E) of DEGs from the Neuronal Cell Fate gene sublist (Table S4A). (F and G) Representative images of immunocytochemical staining with neuronal progenitor markers (PAX6, SOX1), and the excitatory cortical neuron markers TBR1 and CTIP2 (F) with proportion of different cell types assessed by stereological analysis (G). Results of RNA-seq analysis are from n = 2 biologically different iPSC lines per condition (ORG, REAG) differentiated in parallel. Immunocytochemical data are expressed as mean ± SEM of n = 3 biologically different iPSC lines per condition (ORG, REAG). Two technical replicates per cell line were analyzed. ∗∗p < 0.01, p < 0.05, MONs versus ORGs analyzed by t test, two tailed. See also Table S5.
Figure 6
Figure 6
Characterization of the Seven Transcript Modules Differentially Expressed between MONs and ORGs (A) Modules' overlap q values (as –log10 [q-value]) with DEGs in MONs versus ORGs at each time point. (B) Barplots of modules' eigengenes versus time in MONs and ORGs. Reported also are the top scoring functional annotation for each module. (C) Module to module correlation plots. Represented are the eigengenes as dots and the corresponding correlation coefficients. (D) Blue module subnetwork, focusing on inferred TFs and associated target genes, as described in Table S7C, after filtering out any edge with an absolute value of the correlation coefficient <0.5. Yellow ovals, cell adhesion (CCADh)-related genes and neurogenesis (NGEN)-related genes, differentially expressed between MONs and ORGs that are TF targets. Blue, upstream TF; arrows, direction of TF-target relationship. See also Figure S5 and Tables S6 and S7.
Figure 7
Figure 7
Consistency of Transcriptomic Changes between MONs and ORGs across Protocols and Times of Dissociation (A) Experimental design. Cells derived from three iPSC lines were processed for transcriptomic or proteomic analysis. Abbreviations as in the text. (B) Venn diagram showing overlap between early dissociated MON versus ORG DEGs under Noggin (n = 2 biological different iPSC lines per condition) or Dual-SMAD neuronal induction protocol (n = 3 biologically different iPSC lines per condition). (C) Top CP-based annotations for the sets of DEGs between early dissociated MONs versus ORGs under Noggin and Dual-SMAD protocols, respectively. (D) Total number of DEGs (gray bar), downregulated DEGs (blue bar), and upregulated DEGs (red bar) in early and late dissociated MONs versus ORGs at TD25. (E and F) Volcano plots of MON_diss.0 versus ORG (E) and MON_diss.11 versus ORG (F) DEGs after early and late dissociation. Dots above the horizontal line are statistically significant (FDR < 0.01). (G) Total number of DEGs (gray bar), downregulated DEGs (blue bar), and upregulated DEGs (red bar) in early and late REAGs versus ORGs at TD25. (H) Multidimensional scaling plot of RNA-seq data at TD25 for all conditions.

References

    1. Ardhanareeswaran K., Mariani J., Coppola G., Abyzov A., Vaccarino F.M. Human induced pluripotent stem cells for modelling neurodevelopmental disorders. Nat. Rev. Neurol. 2017;13:265–278. - PMC - PubMed
    1. Arlotta P., Pasca S.P. Cell diversity in the human cerebral cortex: from the embryo to brain organoids. Curr. Opin. Neurobiol. 2019;56:194–198. - PubMed
    1. Bultje R.S., Castaneda-Castellanos D.R., Jan L.Y., Jan Y.N., Kriegstein A.R., Shi S.H. Mammalian Par3 regulates progenitor cell asymmetric division via notch signaling in the developing neocortex. Neuron. 2009;63:189–202. - PMC - PubMed
    1. Camp J.G., Badsha F., Florio M., Kanton S., Gerber T., Wilsch-Brauninger M., Lewitus E., Sykes A., Hevers W., Lancaster M. Human cerebral organoids recapitulate gene expression programs of fetal neocortex development. Proc. Natl. Acad. Sci. U S A. 2015;112:15672–15677. - PMC - PubMed
    1. Cappello S., Attardo A., Wu X., Iwasato T., Itohara S., Wilsch-Brauninger M., Eilken H.M., Rieger M.A., Schroeder T.T., Huttner W.B. The Rho-GTPase cdc42 regulates neural progenitor fate at the apical surface. Nat. Neurosci. 2006;9:1099–1107. - PubMed

Publication types

MeSH terms

LinkOut - more resources