. 2021 Jan 27;22(3):1231.
doi: 10.3390/ijms22031231.

Blood-Brain Barrier Disruption Increases Amyloid-Related Pathology in TgSwDI Mice

Affiliations

Blood-Brain Barrier Disruption Increases Amyloid-Related Pathology in TgSwDI Mice

Ihab M Abdallah et al. Int J Mol Sci. .

Abstract

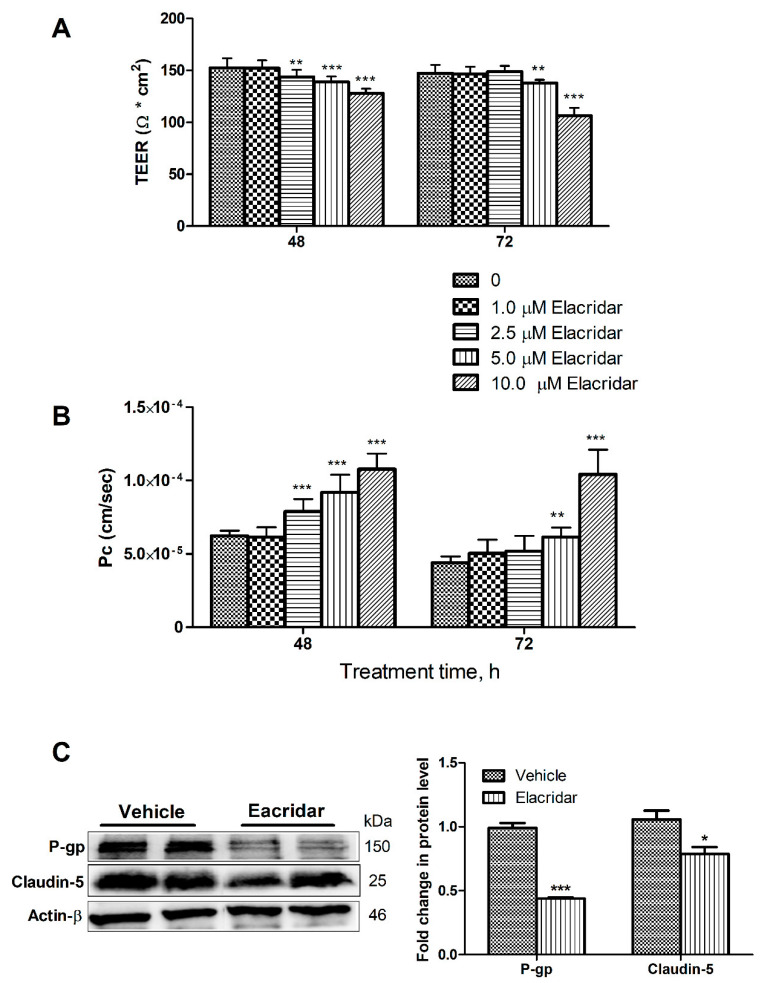
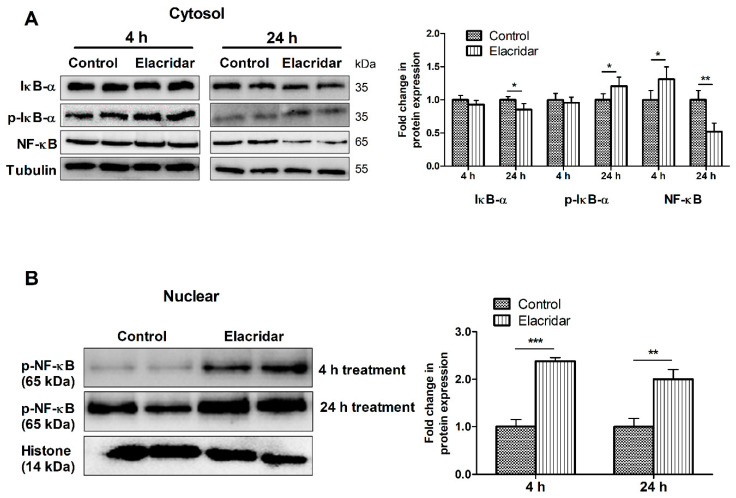
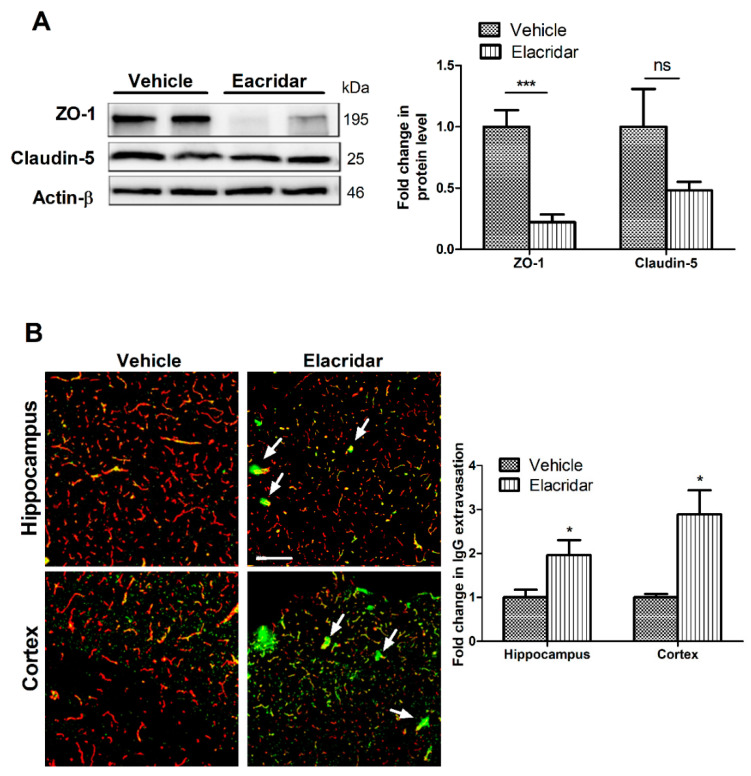
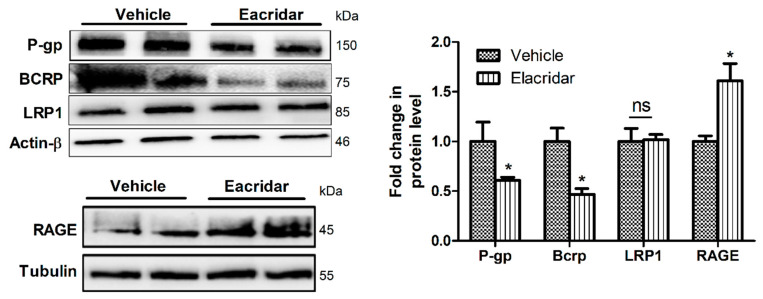
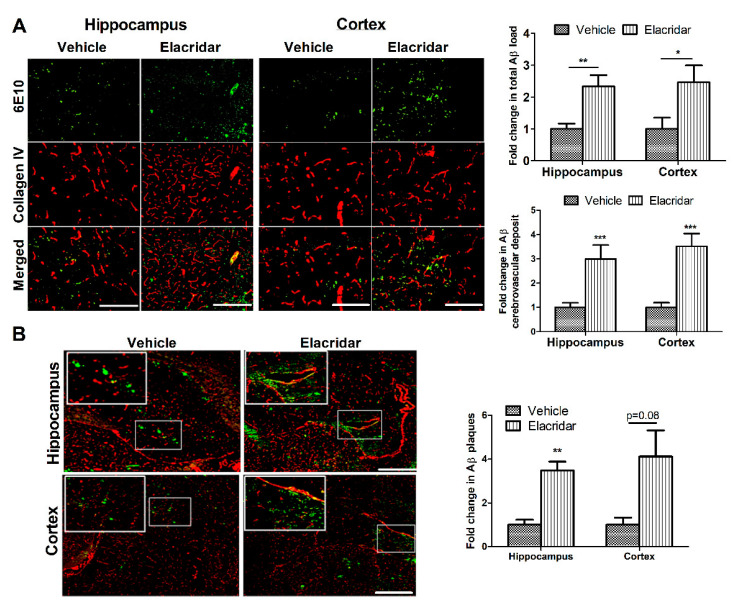
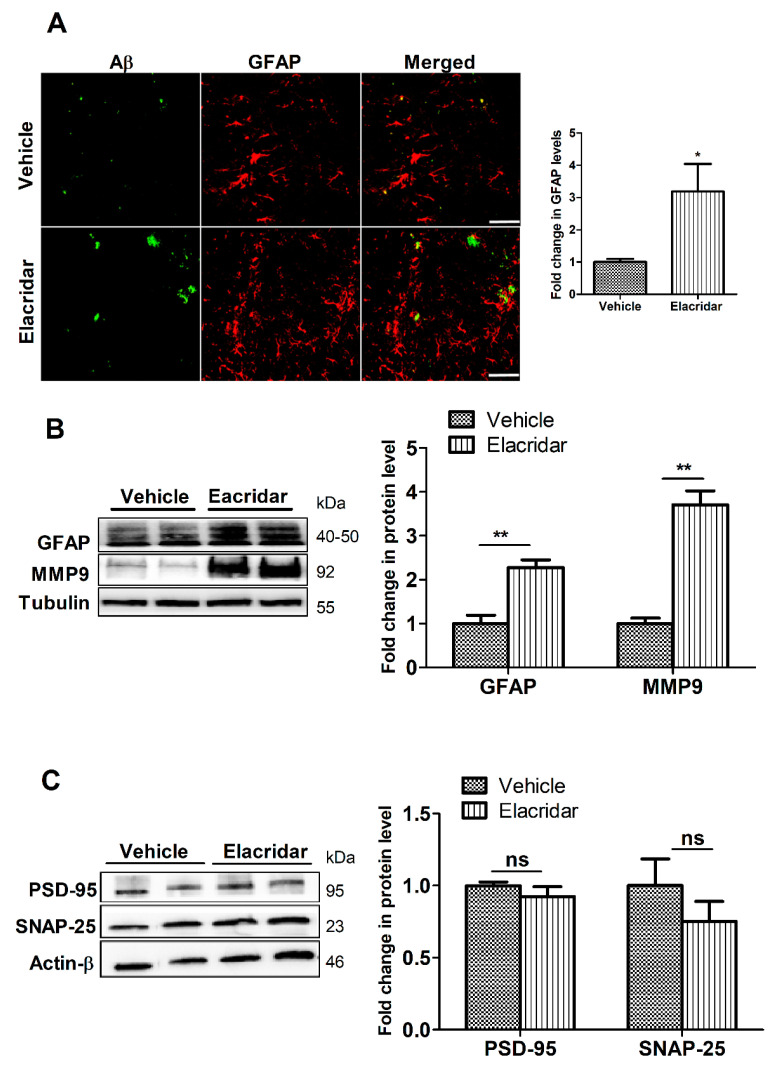
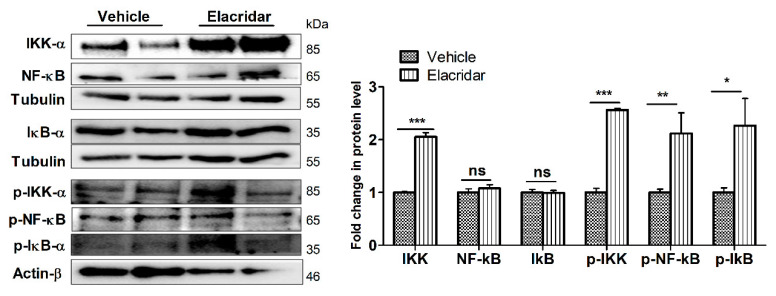
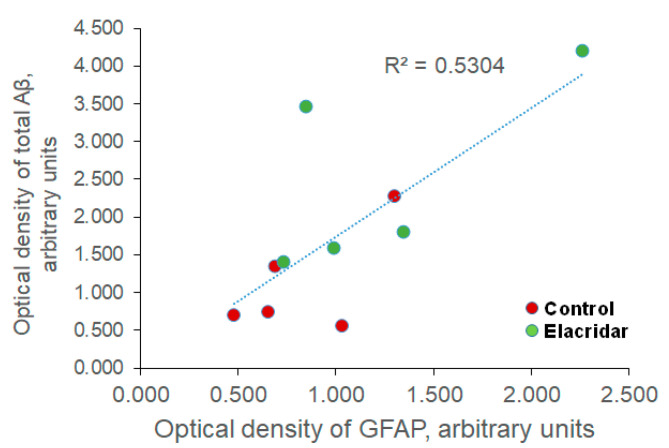
In Alzheimer's disease (AD), several studies have reported blood-brain barrier (BBB) breakdown with compromised function. P-glycoprotein (P-gp) and breast cancer resistance protein (BCRP) are transport proteins localized at the BBB luminal membrane and play an important role in the clearance of amyloid-β (Aβ). The purpose of this study was to investigate the effect of pharmacological inhibition of Aβ efflux transporters on BBB function and Aβ accumulation and related pathology. Recently, we have developed an in vitro high-throughput screening assay to screen for compounds that modulate the integrity of a cell-based BBB model, which identified elacridar as a disruptor of the monolayer integrity. Elacridar, an investigational compound known for its P-gp and BCRP inhibitory effect and widely used in cancer research. Therefore, it was used as a model compound for further evaluation in a mouse model of AD, namely TgSwDI. TgSwDI mouse is also used as a model for cerebral amyloid angiopathy (CAA). Results showed that P-gp and BCRP inhibition by elacridar disrupted the BBB integrity as measured by increased IgG extravasation and reduced expression of tight junction proteins, increased amyloid deposition due to P-gp, and BCRP downregulation and receptor for advanced glycation end products (RAGE) upregulation, increased CAA and astrogliosis. Further studies revealed the effect was mediated by activation of NF-κB pathway. In conclusion, results suggest that BBB disruption by inhibiting P-gp and BCRP exacerbates AD pathology in a mouse model of AD, and indicate that therapeutic drugs that inhibit P-gp and BCRP could increase the risk for AD.

Keywords: Alzheimer’s disease; CAA; P-glycoprotein; amyloid-β; blood-brain barrier; breast cancer resistance protein.


Conflict of interest statement

The authors declare no conflict of interest.

Figures

Figure 1
Figure 1
Effects of elacridar on the barrier function of bEnd3 cells. (A) Exposing bEnd3 cells monolayers to elacridar resulted in the reduction of TEER measurements. TEER unit is in Ω * cm2. (B) Elacridar significantly increased the permeability (Pc, cm/sec) of LY, a permeation marker, in a concentration and time-dependent manner. (C) Representative Western blot and densitometry analysis of P-gp and claudin-5 in bEnd3 cells, presented as fold change by elacridar compared to vehicle treatment, showed elacridar significantly reduced both proteins expression when compared to vehicle treated group. Statistical analysis was determined by one-way ANOVA test for (A,B) and Student’s t-test for (C). Data are presented as mean ± SD of at least three independent experiments. * p ≤ 0.05, ** p ≤ 0.01, and *** p ≤ 0.001. kDa indicates the molecular weight of analyzed proteins.
Figure 2
Figure 2
Treatment with elacridar (5 µM) significantly activated the NF-κB pathway in cultured bEnd3 cells in vitro. (A) Representative Western blot and densitometry analysis of the cytosolic fraction of IκB-α, p-IκB-α, and NF-κB, presented as fold change by elacridar compared to vehicle treatment, at 4 and 24 h post-treatment. (B) Representative Western blot and densitometry analysis of the nuclear fraction of p-NF-κB, presented as fold change by elacridar compared to vehicle treatment, at 4 and 24 h post-treatment. Statistical analysis was determined by Student’s t-test. Data are presented as mean ± SD of 3 independent experiments. * p < 0.05, ** p < 0.01, *** p < 0.001 compared to control. kDa indicates the molecular weight of analyzed proteins.
Figure 3
Figure 3
Treatment with elacridar (10 mg/kg) i.p. for 28 days disrupted BBB integrity in TgSwDI mice. (A) Representative Western blot and densitometry analysis of ZO-1 and claudin-5 in vivo from microvessels isolated from mouse brains. Elacridar treatment significantly decreased the expression of ZO1 in isolated microvessels from mouse brains when compared to the vehicle-treated group. kDa indicates the molecular weight of analyzed proteins. (B) Representative brain sections stained with anti-mouse IgG antibody to detect IgG extravasation (green) and anti-collagen antibody (red), with their optical density quantification in mouse brain hippocampus and cortex. White arrows indicate BBB leakage as demonstrated by IgG extravasation (green). Elacridar increased IgG extravasation in mouse hippocampus and cortex compared to vehicle-treated mice. Scale bar = 100 µm. Statistical analysis was determined by Student’s t-test. Data represented as mean ± SEM of n = 5 mice per group. ns = not significant; * p < 0.05, *** p < 0.001 compared to vehicle.
Figure 4
Figure 4
Treatment with elacridar (10 mg/kg) i.p. for 28 days altered the expression Aβ transport proteins in isolated microvessels from TgSwDI mouse brains. Representative Western blot and densitometry analysis of P-gp, BCRP, LRP1, and RAGE, presented as fold change by elacridar on each protein compared to vehicle treatment, demonstrated that elacridar reduced the expression of P-gp and BCRP, while increased RAGE. Statistical analysis was determined by Student’s t-test. Data represented as mean ± SEM of n = 5 mice per group, ns = not significant; * p < 0.05 compared to vehicle-treated mice. kDa indicates the molecular weight of analyzed proteins.
Figure 5
Figure 5
Elacridar treatment increased brain Aβ burden in the brains of TgSwDI mice. (A) Representative brain sections from mice cortex and hippocampus regions stained with 6E10 (green) antibody against Aβ to detect total Aβ load and anti-collagen IV (red) to stain microvessels. Semi-quantification analysis of both regions showed a significant increase in parenchymal Aβ burden and cerebrovascular Aβ deposit. (B) Representative brain sections stained with ThioS (green) and anti-collagen IV (red) to stain microvessels in cortex and hippocampus regions, with the corresponding quantification of the area covered with Aβ plaques (ThioS). The top white square is a magnification of the small square showing increased Aβ deposit on the microvessels caused by elacridar. The semi-quantification analysis is presented as fold change caused by elacridar when compared to vehicle treatment. Scale bar = 100 μm. Statistical analysis was determined by Student’s t-test. Data are presented as mean ± SEM of n = 5 mice per group, * p < 0.05, ** p < 0.01, *** p < 0.001 compared to vehicle-treated group.
Figure 6
Figure 6
Elacridar treatment (10 mg/kg/day i.p. for 28 days) significantly increased astrogliosis marker GFAP in TgSwDI mouse brains. (A) Representative brain sections from mouse hippocampus stained with GFAP antibody (red) to stain activated astrocytes and with 6E10 (green) antibody to detect total Aβ, with the corresponding quantification of GFAP. Scale bar, 50 μm. The semi-quantification analysis is presented as fold change caused by elacridar when compared to vehicle treatment. (B) Representative Western blot and densitometry analysis of GFAP expressions in mouse brain homogenates. (C) Representative Western blot and densitometry analysis of PSD-95 and SNAP-25 expressions in mouse brain homogenates. Data from Western blot is presented as fold change by elacridar on each protein compared to vehicle treatment. Statistical analysis was determined by Student’s t-test. Data are presented as mean ± SEM for n = 5 mice per group. ns = not significant, * p < 0.05, ** p < 0.01, compared to vehicle-treated group. kDa indicates the molecular weight of analyzed proteins.
Figure 7
Figure 7
Treatment with elacridar (10 mg/kg) i.p. for 28 days significantly activated the NF-κB pathway in TgSwDI mouse brains. Representative Western blot and densitometry analysis, presented as fold change by elacridar on each protein compared to vehicle treatment, demonstrated that elacridar significantly increased expression of IKK-α, p-IKK-α, p-NF-κB, and p-IκB-α. Statistical analysis was determined by Student’s t-test. Data represented as mean ± SEM of n = 5 mice per group, ns = not significant, * p < 0.05, ** p < 0.01, *** p < 0.001 compared to vehicle-treated group. kDa indicates the molecular weight of analyzed proteins.
Figure 8
Figure 8
Correlation analysis between optical density changes in GFAP and total Aβ levels revealed a positive correlation between GFAP and total Aβ, as demonstrated by the coefficient of determination (R2). n  =  5 mice/treatment group were used. Optical density is presented in arbitrary units.

References

    1. Citron M. Alzheimer’s disease: Strategies for disease modification. Nat. Rev. Drug Discov. 2010;9:387–398. doi: 10.1038/nrd2896. - DOI - PubMed
    1. Wilson R.S., Segawa E., Boyle P.A., Anagnos S.E., Hizel L.P., Bennett D.A. The natural history of cognitive decline in Alzheimer’s disease. Psychol. Aging. 2012;27:1008–1017. doi: 10.1037/a0029857. - DOI - PMC - PubMed
    1. Selkoe D.J. Alzheimer’s disease: Genes, proteins, and therapy. Physiol. Rev. 2001;81:741–766. doi: 10.1152/physrev.2001.81.2.741. - DOI - PubMed
    1. Selkoe D.J., Schenk D. Alzheimer’s disease: Molecular understanding predicts amyloid-based therapeutics. Annu. Rev. Pharmacol. Toxicol. 2003;43:545–584. doi: 10.1146/annurev.pharmtox.43.100901.140248. - DOI - PubMed
    1. Jellinger K.A. Alzheimer disease and cerebrovascular pathology: An update. J. Neural Transm. 2002;109:813–836. doi: 10.1007/s007020200068. - DOI - PubMed

MeSH terms

LinkOut - more resources