. 2021 Jan 21;21(1):5.
doi: 10.1186/s12862-020-01732-2.

Horizontal gene transfer and recombination analysis of SARS-CoV-2 genes helps discover its close relatives and shed light on its origin

Affiliations

Horizontal gene transfer and recombination analysis of SARS-CoV-2 genes helps discover its close relatives and shed light on its origin

Vladimir Makarenkov et al. BMC Ecol Evol. .

Abstract

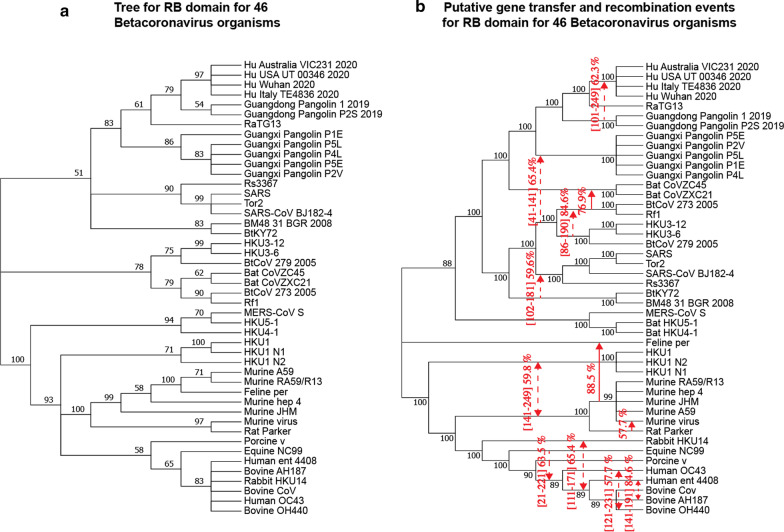
Background: The SARS-CoV-2 pandemic is one of the greatest global medical and social challenges that have emerged in recent history. Human coronavirus strains discovered during previous SARS outbreaks have been hypothesized to pass from bats to humans using intermediate hosts, e.g. civets for SARS-CoV and camels for MERS-CoV. The discovery of an intermediate host of SARS-CoV-2 and the identification of specific mechanism of its emergence in humans are topics of primary evolutionary importance. In this study we investigate the evolutionary patterns of 11 main genes of SARS-CoV-2. Previous studies suggested that the genome of SARS-CoV-2 is highly similar to the horseshoe bat coronavirus RaTG13 for most of the genes and to some Malayan pangolin coronavirus (CoV) strains for the receptor binding (RB) domain of the spike protein.

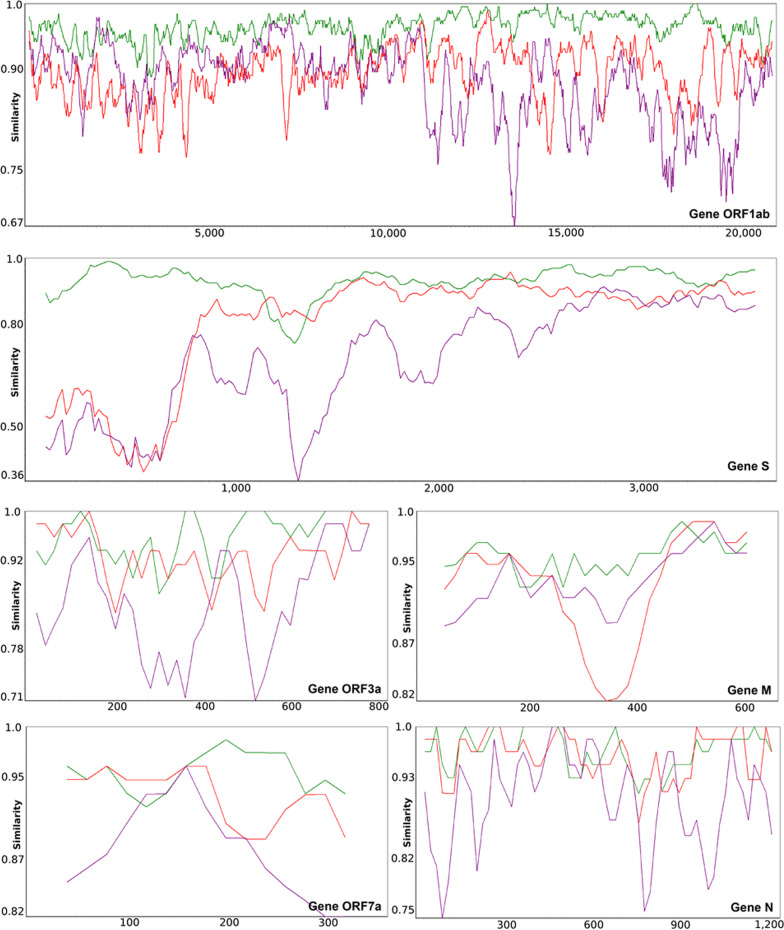
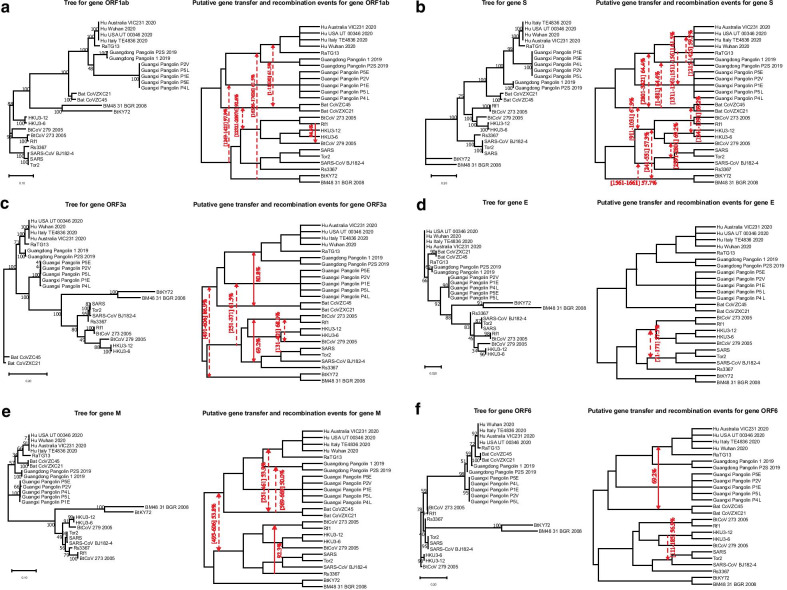
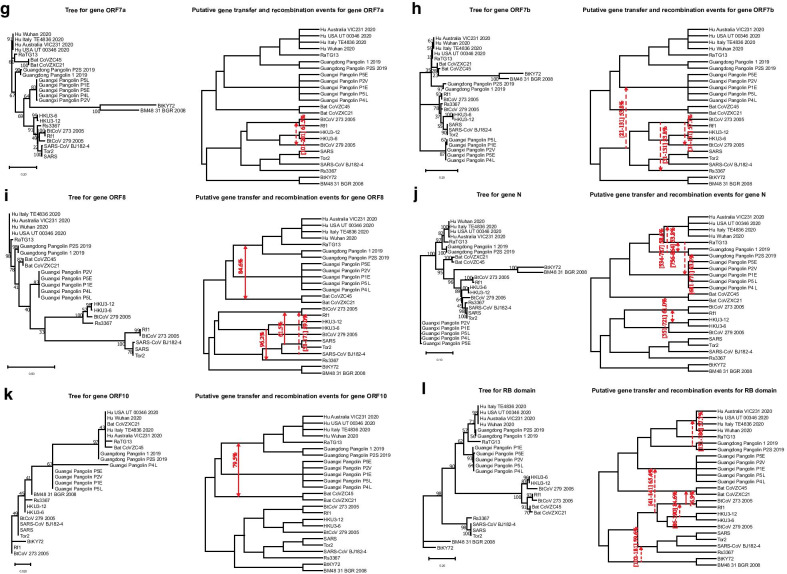
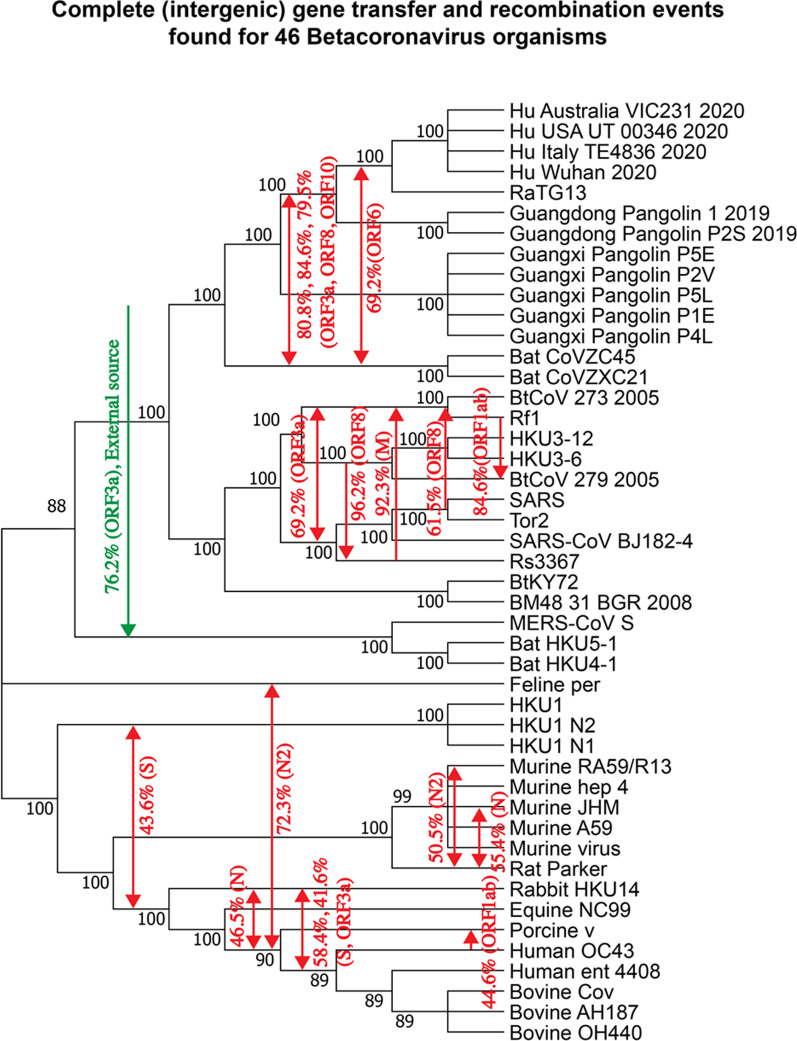
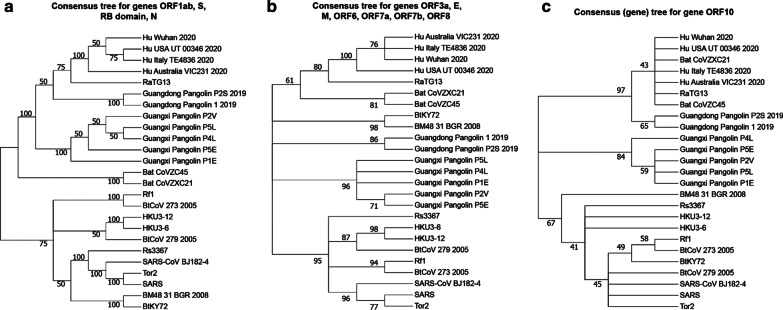
Results: We provide a detailed list of statistically significant horizontal gene transfer and recombination events (both intergenic and intragenic) inferred for each of 11 main genes of the SARS-CoV-2 genome. Our analysis reveals that two continuous regions of genes S and N of SARS-CoV-2 may result from intragenic recombination between RaTG13 and Guangdong (GD) Pangolin CoVs. Statistically significant gene transfer-recombination events between RaTG13 and GD Pangolin CoV have been identified in region [1215-1425] of gene S and region [534-727] of gene N. Moreover, some statistically significant recombination events between the ancestors of SARS-CoV-2, RaTG13, GD Pangolin CoV and bat CoV ZC45-ZXC21 coronaviruses have been identified in genes ORF1ab, S, ORF3a, ORF7a, ORF8 and N. Furthermore, topology-based clustering of gene trees inferred for 25 CoV organisms revealed a three-way evolution of coronavirus genes, with gene phylogenies of ORF1ab, S and N forming the first cluster, gene phylogenies of ORF3a, E, M, ORF6, ORF7a, ORF7b and ORF8 forming the second cluster, and phylogeny of gene ORF10 forming the third cluster.

Conclusions: The results of our horizontal gene transfer and recombination analysis suggest that SARS-CoV-2 could not only be a chimera virus resulting from recombination of the bat RaTG13 and Guangdong pangolin coronaviruses but also a close relative of the bat CoV ZC45 and ZXC21 strains. They also indicate that a GD pangolin may be an intermediate host of this dangerous virus.

Keywords: Consensus tree; Evolution of SARS-CoV-2; Gene evolution; Horizontal gene transfer; Phylogenetic network; Recombination.


Conflict of interest statement

The authors declare that they have no competing interests.

Figures

Fig. 1
Fig. 1
Genome similarity and phylogenetic analysis of SARS-CoV-2 and related viruses: a SimPlot sliding window analysis of changing patterns of sequence similarity between: the Wuhan SARS-CoV-2 2020 reference genome with the RatTG13 CoV genome (green) and the consensus genomes of the GD Pangolin CoV (red), GX Pangolin CoV (orange), Bat CoVZ (violet) and Bat SL-VoC (gray) groups. Gene limits for genes ORF1ab, S, ORF3a, E, M, ORF6, ORF7a, ORF7b, ORF8, N and ORF10, as well as for the RB domain, are shown at the top of the figure. Different groups of sequences merged in SimPlot analysis are represented by different colors corresponding to species clusters in the whole genome phylogeny shown in panel (b) of the figure; b Whole genome phylogeny of 25 SARS-CoV and SARS-CoV-2-related organisms. Species clusters are indicated on the right. Bootstrap scores are indicated on the internal branches of the tree. Branches with bootstrap score lower than 60% were collapsed. The tree was inferred using the RAxML method with the most suitable for these data, the HKY-gamma evolutionary model, and 100 replicates in bootstrapping
Fig. 2
Fig. 2
Gene-by-gene SimPlot similarity analysis performed to compare gene sequences of the Wuhan SARS-CoV-2 2020 reference genome with those of the RatTG13 genome (green), GD Pangolin CoV consensus genome (red) and Bat CoVZ consensus genome (violet). Similarity plots are presented for genes ORF1ab, S, ORF3a, M, ORF7a and N that encompass the most important overlaps between the RaTG13, GD Pangolin CoV and Bat CoVZ similarity curves
Fig. 3
Fig. 3
Putative horizontal gene transfer events found for 11 main genes and the RB domain of 25 SARS-CoV and SARS-CoV-2-related viruses. Left part of each portion of the figure shows the gene tree and its right part shows the species tree (i.e. whole genome tree) into which statistically significant horizontal gene transfers are mapped. Full lines represent complete gene transfers (i.e. when a complete copy of the donor’s gene is incorporated into the recipient genome; this accounts for intergenic recombination) and dashed lines represent partial gene transfers (i.e. when a mosaic gene is formed by recombination of two homologous gene sequences; this accounts for intragenic recombination). Numbers on the internal branches represent their bootstrap scores. Transfer directions are represented by arrows (when the direction is not certain, the arrow is bidirectional). Gene fragments transferred from the donor organism are indicated between brackets and followed by the transfer bootstrap score calculated by the Partial HGT-Detection program [7]
Fig. 3
Fig. 3
Putative horizontal gene transfer events found for 11 main genes and the RB domain of 25 SARS-CoV and SARS-CoV-2-related viruses. Left part of each portion of the figure shows the gene tree and its right part shows the species tree (i.e. whole genome tree) into which statistically significant horizontal gene transfers are mapped. Full lines represent complete gene transfers (i.e. when a complete copy of the donor’s gene is incorporated into the recipient genome; this accounts for intergenic recombination) and dashed lines represent partial gene transfers (i.e. when a mosaic gene is formed by recombination of two homologous gene sequences; this accounts for intragenic recombination). Numbers on the internal branches represent their bootstrap scores. Transfer directions are represented by arrows (when the direction is not certain, the arrow is bidirectional). Gene fragments transferred from the donor organism are indicated between brackets and followed by the transfer bootstrap score calculated by the Partial HGT-Detection program [7]
Fig. 4
Fig. 4
Putative horizontal gene transfer events found for the RB domain (amino acid sequences) of 46 betacoronavirus organisms (extended version of Fig. 3i). Left part of the figure presents the gene tree of the RB domain. Right part of the figure presents the species tree (i.e. whole genome tree) with putative horizontal gene transfers mapped into it. The explanations of the caption of Fig. 3 also apply for this figure
Fig. 5
Fig. 5
Putative complete horizontal gene transfer events (accounting for intergenic recombination) found for 11 main genes of 46 betacoronavirus organisms from Fig. 4. The detected complete horizontal gene transfers are mapped into the species tree (i.e. whole genome tree). Numbers on the internal tree branches represent their bootstrap scores. Transfer directions are represented by arrows (when the direction is not certain, the arrow is bidirectional). Transfer bootstrap scores calculated by the HGT-Detection program [6] and the associated gene names are indicated on arrows
Fig. 6
Fig. 6
Three consensus trees showing the three ways of evolution of the SARS-CoV and SARS-CoV-2-related genes. Tree clustering was carried out using the k-means-based tree partitioning algorithm adapted for clustering trees with different numbers of leaves. The first tree is the extended majority-rule consensus tree inferred for the phylogenies of genes ORF1ab, S, RB domain of S and N, forming Cluster 1. This consensus tree was obtained using the Consense program from the Phylip package. The second tree is the best heuristic search (hs) CLANN supertree inferred for the phylogenies of genes ORF3a, E, M, ORF6, ORF7a, ORF7b and ORF8 (these gene phylogenies had different numbers of leaves), forming Cluster 2. The consensus tree of gene ORF10 is its RAxML tree, which was unique in Cluster 3. Bootstrap scores are indicated on the internal tree branches. Branches with bootstrap support lower than 40% were collapsed

References

    1. Andersen KG, Rambaut A, Lipkin WI, Holmes EC, Garry RF. The proximal origin of SARS-CoV-2. Nat Med. 2020;26:450–452. doi: 10.1038/s41591-020-0820-9. - DOI - PMC - PubMed
    1. Arenas M. The importance and application of the ancestral recombination graph. Front Genet. 2013;4:206. - PMC - PubMed
    1. Bapteste E, van Iersel L, Janke A, Kelchner S, Kelk S, McInernery JO, Morrison DA, Nakhleh L, Steel M, Stougie L, Whitfield J. Networks: expanding evolutionary thinking. Trends Genet. 2013;29:439–441. doi: 10.1016/j.tig.2013.05.007. - DOI - PubMed
    1. Benson DA, Karsch-Mizrachi I, Lipman DJ, Ostell J, Wheeler DL. GenBank. Nucleic Acids Res. 2007;36:D25–D30. doi: 10.1093/nar/gkm929. - DOI - PMC - PubMed
    1. Becq J, Churlaud C, Deschavanne P. A benchmark of parametric methods for horizontal transfers detection. PLoS ONE. 2010;5:e9989. doi: 10.1371/journal.pone.0009989. - DOI - PMC - PubMed

Publication types