. 2021 Jan 29;7(5):eabd9749.
doi: 10.1126/sciadv.abd9749. Print 2021 Jan.

A 3D disease and regeneration model of peripheral nervous system-on-a-chip

Affiliations

A 3D disease and regeneration model of peripheral nervous system-on-a-chip

Sujin Hyung et al. Sci Adv. .

Abstract

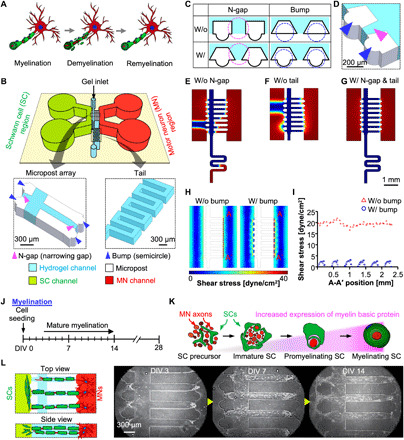
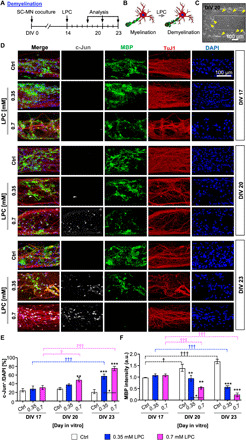
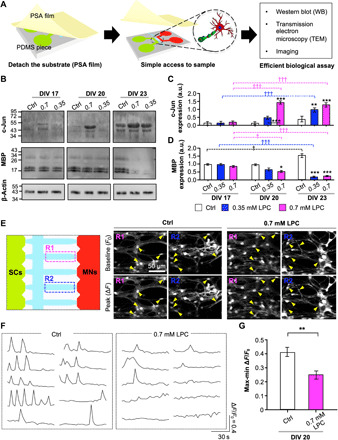
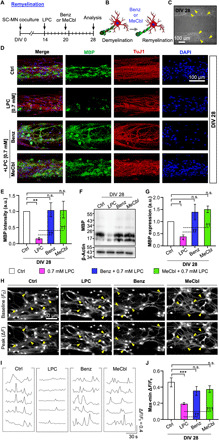
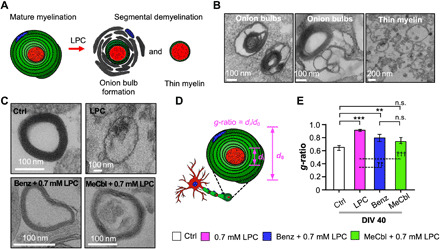
Demyelinating diseases involve loss of myelin sheaths and eventually lead to neurological problems. Unfortunately, the precise mechanisms remain unknown, and there are no effective therapies. To overcome these limitations, a reliable and physiologically relevant in vitro model is required. Here, we present a three-dimensional peripheral nervous system (PNS) microfluidic platform that recapitulates the full spectrum of myelination, demyelination, and remyelination using primary Schwann cells (SCs) and motor neurons (MNs). The platform enables reproducible hydrogel patterning and long-term stable coculture of MNs and SCs over 40 days in vitro based on three distinct design factors. Furthermore, the on-demand detachable substrate allows in-depth biological analysis. We demonstrated the possibility of mimicking segmental demyelination by lysophosphatidylcholine, and recovery of myelin structure by application of two drugs: benzatropine or methylcobalamin. This 3D PNS disease-on-a-chip may serve as a potential platform for understanding the pathophysiology of demyelination and screening drugs for remyelination.


Figures

Fig. 1
Fig. 1. Design of 3D PNS disease platform.
(A) Schematic illustrations displaying the full process of myelination, demyelination, and remyelination. (B) Schematics of the design of the platform: SC channel (green), MN channel (red), micropost array (white), and hydrogel channel (sky blue). (C) Enlarged 2D view of the microstructure of the chip with or without an N-gap (a pink circle) and bump structure (a blue circle). (D) (bottom of B) Enlarged 3D view of the microstructure of the chip with the micropost array consisting of the N-gap (magenta arrowhead) and bump (blue arrowheads) and tail. COMSOL finite-element simulation results for liquid patterning in the platform without an N-gap (E) or without a tail (F) and with an N-gap and a tail (G). The volume fractions of air (red) and liquid (blue) were simulated. (H) Simulation results of fluidic shear stress depending on the bump structure and (I) distribution of shear stress on hydrogel surface to which cells were attached (A-A′). Schematic diagram (J) and illustration (K) showing the time course of mature myelination in the SC-MN coculture model. (L) In the hydrogel channel, migrated SCs interacted with axons of MNs, leading to the wrapping process. Representative microscopic images showing the process of mature myelination at DIV 3, 7, and 14.
Fig. 2
Fig. 2. Reconstruction of 3D demyelination in SC-MN coculture by LPC treatment.
(A) Schematic diagram displaying the time course of LPC introduction and demyelination analysis in the SC-MN myelination model. To induce demyelination, cocultures were treated with 0.35 or 0.7 mM LPC, and the demyelination of SC-MN cocultures was measured by immunocytochemistry at DIV 17, 20, and 23. Fixed samples were immunostained with antibodies against c-Jun (gray), myelin basic protein (MBP; green), tubulin beta III (TuJ1; red), and 4′,6-diamidino-2-phenylindole (DAPI) (blue). (B) Schematic illustrations displaying the SC-MN coculture from myelination to demyelination. (C) Representative bright-field image for establishment of a demyelinating coculture system. Demyelination was rapidly induced by LPC treatment, and uneven nerve fiber (yellow arrowheads) was observed in the gel channel at DIV 20. (D) Representative confocal images of cocultures and quantification of c-Jun+ cells (E) and MBP intensity (F) with or without 0.35 or 0.7 mM LPC treatment, respectively. The graph shows mean ± SEM values from at least three independent experiments using different mice. *P < 0.05, **P < 0.01, and ***P < 0.001 compared with the control. P < 0.05 and †††P < 0.001 compared with each value at DIV 17 [one-way analysis of variance (ANOVA), Tukey’s multiple comparison tests]. a.u., arbitrary units.
Fig. 3
Fig. 3. Confirmation of 3D demyelination with effective biochemical analysis on a 3D PNS disease platform.
(A) Schematic descriptions of our easy-to-use platform with the PSA-coated PC film for efficient biological analysis [Western blot (WB), TEM, and imaging]. (B) Representative immunoblots and quantification of c-Jun (C) and MBP (D). *P < 0.05, **P < 0.01, and ***P < 0.001 compared with the control. P < 0.05 and †††P < 0.001 are compared with each value at DIV 17 (one-way ANOVA, Tukey’s multiple comparison tests). Intracellular Ca2+ levels of coculture with or without LPC were analyzed at DIV 20 using the Oregon Green 488 BAPTA-1 AM staining kit. (E) Representative inverted confocal images of BAPTA-1 AM signals in two random gel channel regions—R1 and R2 (left)—showing the time points of the baseline (F0) and peak (∆F) levels (middle and right), (F) cell recording, and (G) quantification of the relative change of intracellular Ca2+ on coculture with or without LPC. Arrowheads indicate cocultured cells at the F0 and ∆F levels. The graph shows mean ± SEM values from three [in (B)] and at least seven independent experiments [in (G)] using different mice. In (G), an average of 14 cells per independent experiment was calculated. **P < 0.01 compared with control (unpaired, two-tailed t test with Welch’s correction).
Fig. 4
Fig. 4. Reconstruction of 3D remyelination by either Benz or MeCbl treatment on demyelinated SC-MN coculture.
(A) To verify remyelination, cocultures were cotreated with Benz (1.5 μM) or MeCbl (10 μM) in the presence of LPC at DIV 20 and analyzed at DIV 28. (B) Schematic illustrations displaying the coculture from demyelination to remyelination. (C) Representative bright-field image for establishment of a remyelinating coculture system. (D) Representative confocal images of cocultures with MBP (green), TuJ1 (red), and DAPI (blue); (E) quantification of MBP intensity and (F) immunoblots; and (G) quantification of MBP on cocultures with Benz or MeCbl in the presence and absence of LPC are shown. (H) Representative inverted confocal images of BAPTA-1 AM signals showing the time points of the baseline (F0) and peak (∆F) levels, (I) cell recording, and (J) quantification of the relative changes in intracellular Ca2+ in cocultures with LPC only and with LPC plus Benz or MeCbl treatment. In (F) and (J), the graph shows mean ± SEM values from three independent experiments using different mice. In (J), an average of 13 cells per independent experiment was calculated. *P < 0.05, **P < 0.01, and ***P < 0.001 compared with the control; ††P < 0.01 and †††P < 0.001 compared with the LPC treatment (one-way ANOVA, Tukey’s multiple comparison tests). n.s., no statistically significant difference.
Fig. 5
Fig. 5. Confirmation of 3D remyelination based on myelin thickness of demyelinated SC-MN cocultures.
The extent of myelin sheath formation of LPC-induced SC-MN demyelination by Benz or MeCbl was analyzed by TEM at DIV 40. (A) Schematic diagram of structural alterations of mature myelin sheaths by LPC. (B) Representative TEM images of nerve cross sections of SC-MN cocultures with LPC, demonstrating segmental demyelination, including onion bulb formation (left and middle) and thin myelinated axons (right). (C) Representative TEM images of transected nerve fibers in the control, Benz, or MeCbl conditions in the presence and absence of LPC. (D) Schematic illustration of the g-ratio, defined as the ratio of the axonal diameter to the total nerve fiber diameter. A g-ratio close to 0.6 indicated a more mature myelinated axon. (E) Quantification of g-ratios of transected nerve fibers in the control, Benz, or MeCbl samples in the presence and absence of LPC. The graph shows mean ± SEM values from at least seven independent experiments using different mice. **P < 0.01 and ***P < 0.001 compared with the control; ††P < 0.01 and †††P < 0.001 compared with LPC (one-way ANOVA, Tukey’s multiple comparison tests).

Similar articles

Cited by

References

    1. Mirsky R., Jessen K. R., Schwann cell development, differentiation and myelination. Curr. Opin. Neurobiol. 6, 89–96 (1996). - PubMed
    1. Jessen K. R., Mirsky R., The repair Schwann cell and its function in regenerating nerves. J. Physiol. 594, 3521–3531 (2016). - PMC - PubMed
    1. Kamil K., Yazid M. D., Idrus R. B. H., Das S., Kumar J., Peripheral demyelinating diseases: From biology to translational medicine. Front. Neurol. 10, 87 (2019). - PMC - PubMed
    1. Martin R., Mcfarland H. F., Mcfarlin D. E., Immunological aspects of demyelinating diseases. Annu. Rev. Immunol. 10, 153–187 (1992). - PubMed
    1. Pardo I. D., Rao D. B., Butt M. T., Jortner B. S., Valentine W. M., Arezzo J., Sharma A. K., Bolon B., Toxicologic pathology of the peripheral nervous system (PNS): Overview, challenges, and current practices. Toxicol. Pathol. 46, 1028–1036 (2018). - PubMed

Publication types