. 2021 Mar 25;95(8):e02415-20.
doi: 10.1128/JVI.02415-20. Epub 2021 Jan 29.

SARS-CoV-2 triggers an MDA-5-dependent interferon response which is unable to control replication in lung epithelial cells

Affiliations

SARS-CoV-2 triggers an MDA-5-dependent interferon response which is unable to control replication in lung epithelial cells

Antoine Rebendenne et al. J Virol. .

Abstract

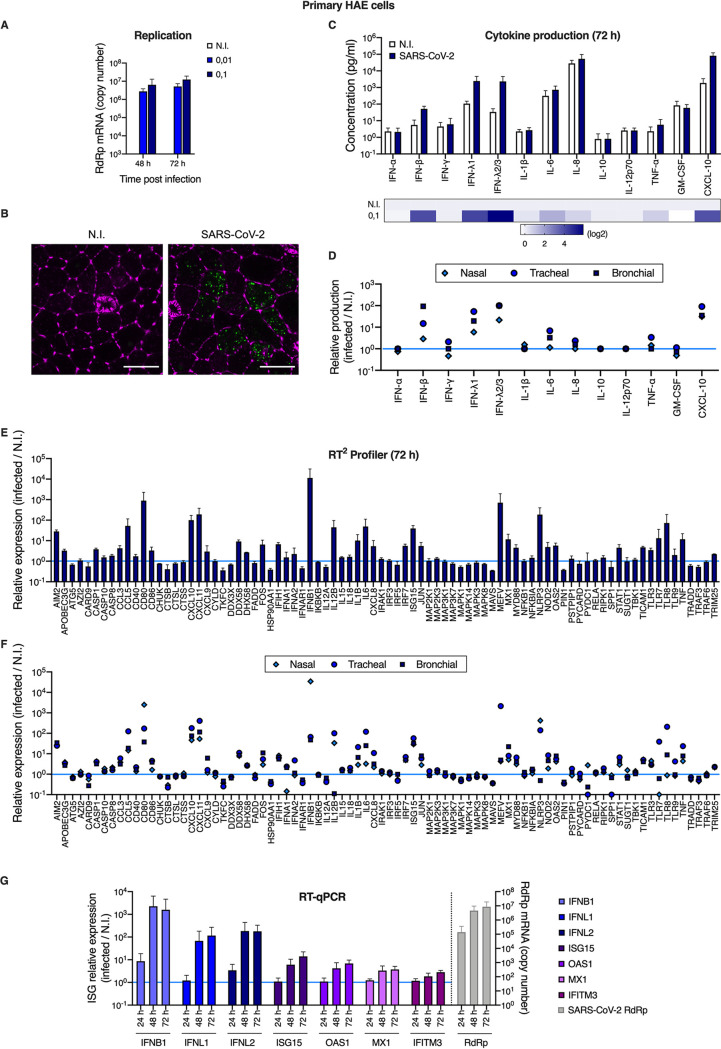
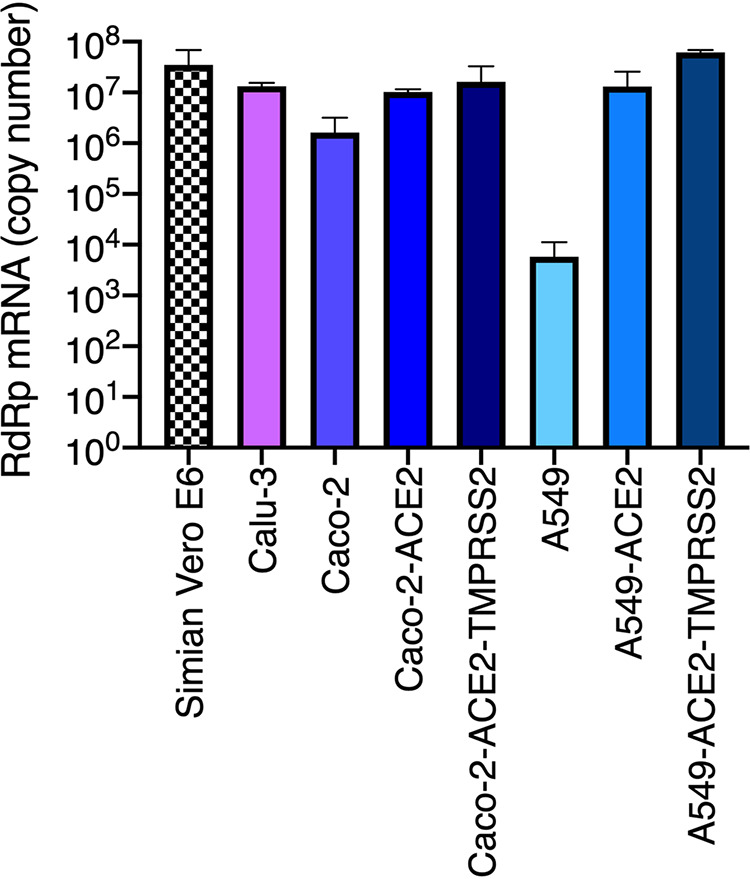
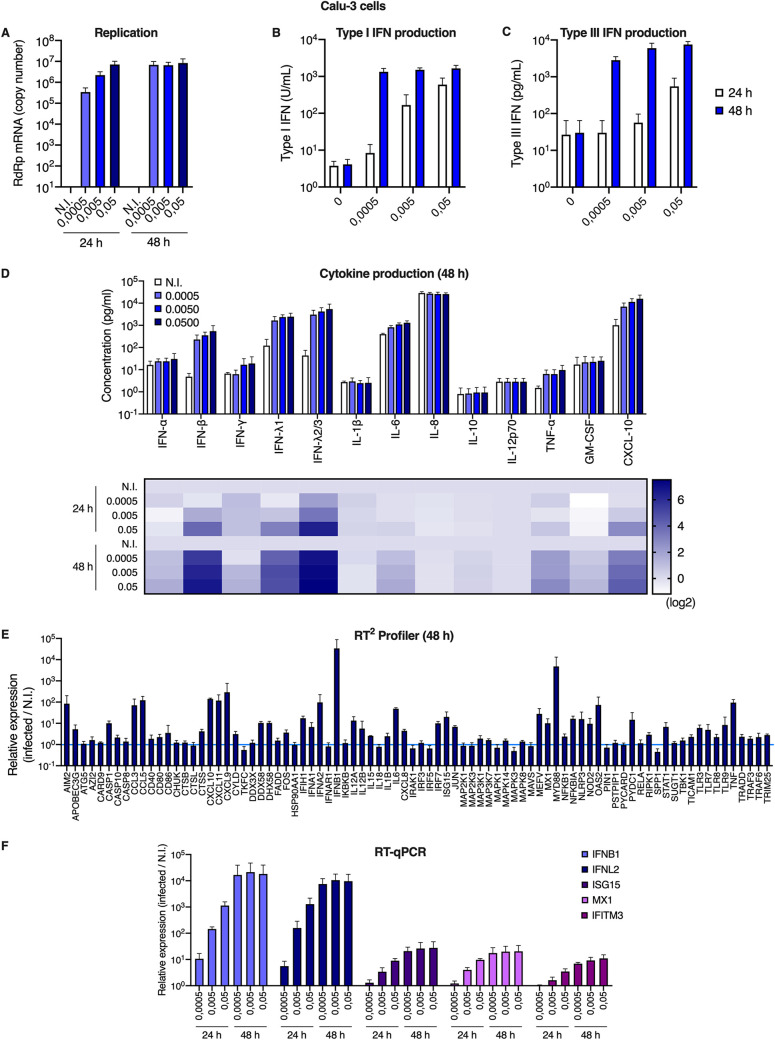
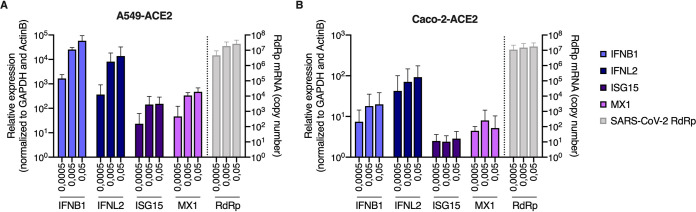
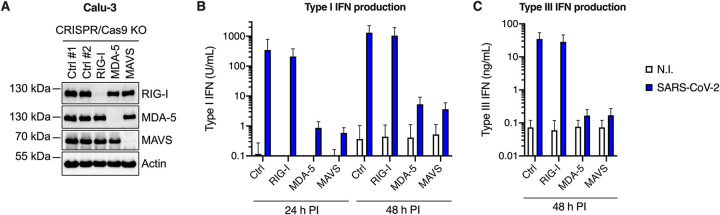
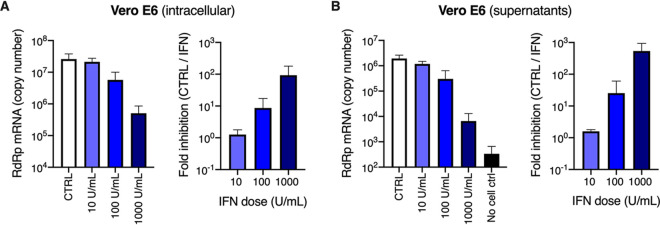
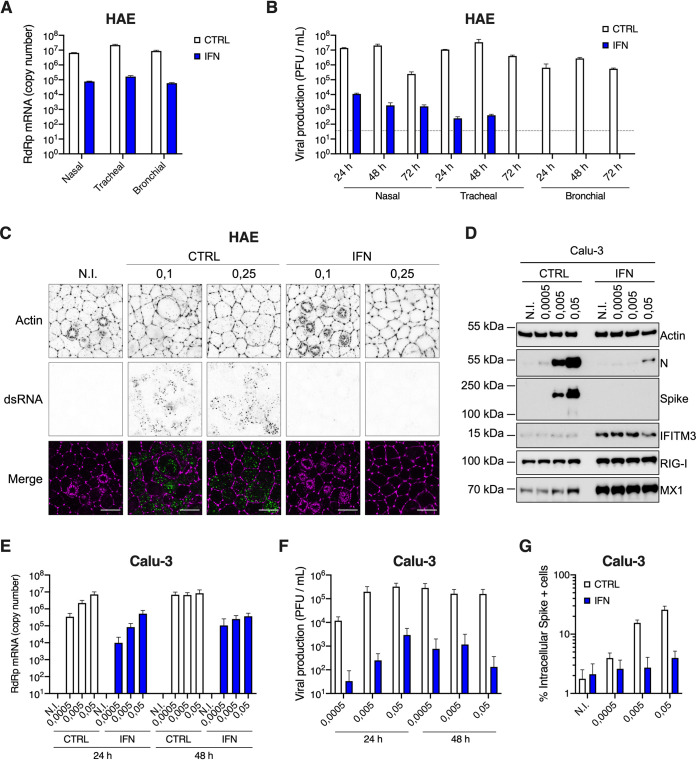
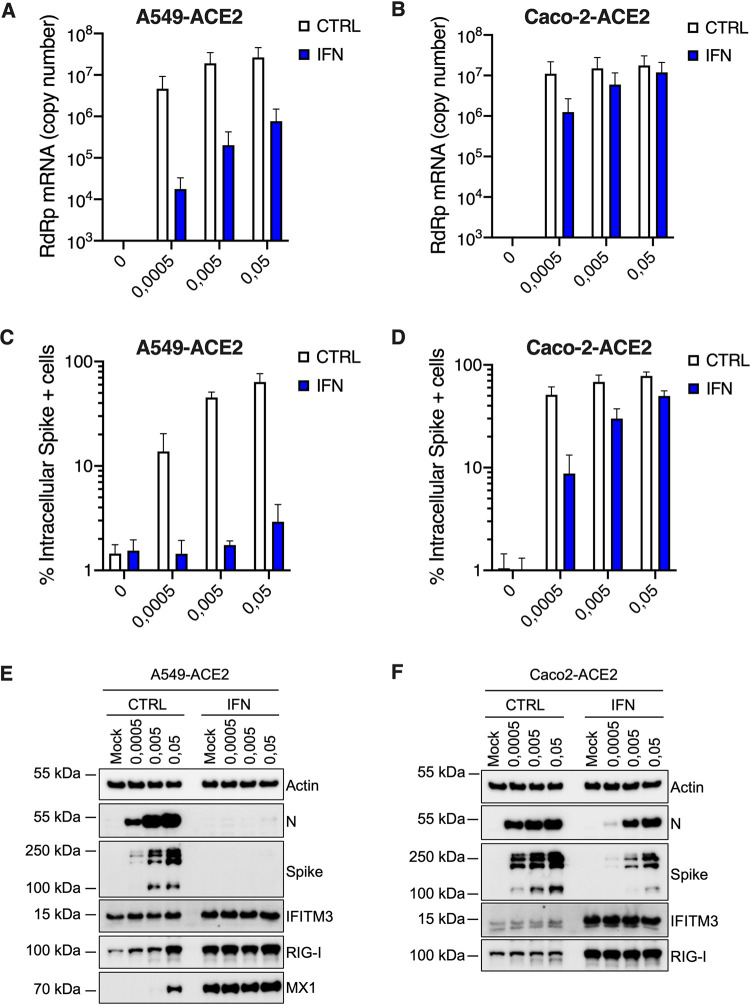
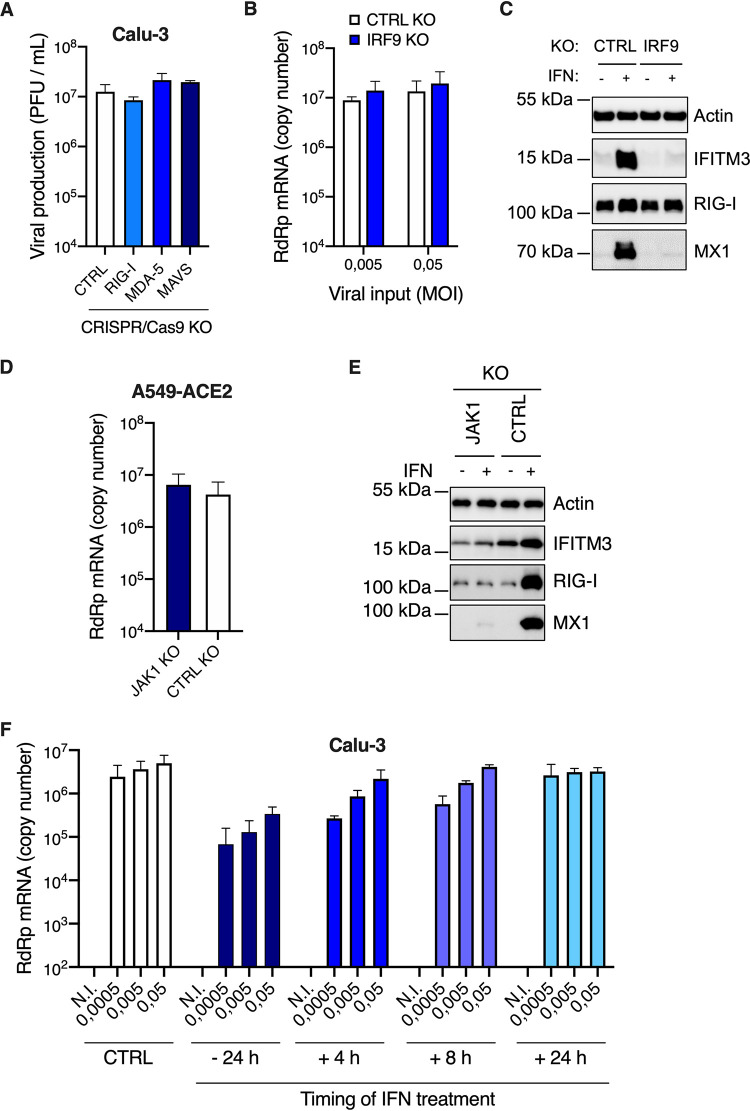
Severe acute respiratory syndrome coronavirus 2 (SARS-CoV-2) is the etiologic agent of coronavirus disease 19 (COVID-19), which ranges from mild respiratory symptoms to acute respiratory distress syndrome, and death in the most severe cases. Immune dysregulation with altered innate cytokine responses is thought to contribute to disease severity. Here, we characterized in depth host cell responses against SARS-CoV-2 in primary human airway epithelia (HAE) and immortalized cell lines. Our results demonstrate that primary HAE and model cells elicit a robust induction of type I and III interferons (IFNs). Importantly, we show for the first time that melanoma differentiation associated gene (MDA)-5 is the main sensor of SARS-CoV-2 in lung cells. IFN exposure strongly inhibited viral replication and de novo production of infectious virions. However, despite high levels of IFNs produced in response to SARS-CoV-2 infection, the IFN response was unable to control viral replication in lung cells, contrary to what was previously reported in intestinal epithelial cells. Altogether, these results highlight the complex and ambiguous interplay between viral replication and the timing of IFN responses.IMPORTANCE Mammalian cells express sensors able to detect specific features of pathogens and induce the interferon response, which is one of the first line of defenses against viruses and help controlling viral replication. The mechanisms and impact of SARS-CoV-2 sensing in lung epithelial cells remained to be deciphered. In this study, we report that despite a high production of type I and III interferons specifically induced by MDA-5-mediated sensing of SARS-CoV-2, primary and immortalized lung epithelial cells are unable to control viral replication. However, exogenous interferons potently inhibited replication, if provided early upon viral exposure. A better understanding of the ambiguous interplay between the interferon response and SARS-CoV-2 replication is essential to guide future therapeutical interventions.


Figures

FIG 1
FIG 1
Primary human airway epithelial host cell responses to SARS-CoV-2 infection. (A) Human HAE cells (MucilAir, Epithelix) were noninfected (N.I.) or incubated with SARS-CoV-2 on the apical side at MOIs of 0.01 and 0.1 for 2 h. Cells were harvested and lysed for RNA extraction and RT-qPCR analysis using RdRp primers and probe at 48 h and 72 h postinfection. (B) Human HAE cells were N.I. or incubated with SARS-CoV-2 on the apical side at MOI 0.1 for 2 h. After 48 h, cells were stained for actin with phalloidin (magenta) and an anti-double-stranded RNA antibody (green). Representative images, acquired with an LSM880 Airyscan microscope, are shown; scale bar 10 μm. (C) Human HAE cells were N.I. or incubated with SARS-CoV-2 (MOI 0.1), as in (A). Cytokine concentrations in the basal medium were measured using the human antivirus response panel LEGENDplex at 72 h after infection (top), and the heat map (bottom) represents the fold difference in cytokine concentrations (log2 scale) in basal media from infected compared to N.I. cells. (D) Data from human antivirus response panel LEGENDplex as performed in (C), with supernatants from cells of nasal, tracheal, and bronchial origins. (E) An antiviral response RT2 profiler PCR array analysis was performed using the RNAs from (A) extracted at 72 h (N.I. and MOI 0.1). Relative expression is shown for the indicated genes. (F) Data from antiviral response RT2 profiler PCR array analysis as in (D) obtained with RNAs from HAE cells of nasal, tracheal, and bronchial origins. (G) Human HAE cells were mock infected (N.I.) or incubated with SARS-CoV-2 on the apical side at MOI 0.01 for 2 h, harvested at the indicated time points, and lysed for RNA extraction and RT-qPCR. Differential ISG expression was measured using the indicated taqmans, and data were normalized to both ActinB and GAPDH (left y axis), while viral replication was analyzed using RdRp primers and probe (right y axis). The light blue line (sets at 1) indicates no change in cytokine production or in gene expression (D, E, F, and G). The means of four (A), three (C to F), or six (G; apart from the 24-h time point, for which n = 3) independent experiments are shown, with error bars representing the standard deviation (SD).
FIG 2
FIG 2
Replication of SARS-CoV-2 in genetically modified human cell lines. Caco-2 and A549 cells were transduced or not with lentiviral vectors to stably overexpress either ACE2 or ACE2 together with TMPRSS2. The indicated (unmodified and modified) cell lines were infected with SARS-CoV-2 at MOI 0.05 and lysed 48 h later for RNA extraction and RdRp RT-qPCR analysis. A representative experiment (with technical triplicates) is shown.
FIG 3
FIG 3
Calu-3 model cell line responses to SARS-CoV-2 infection. (A) Human Calu-3 cells were N.I. or incubated with SARS-CoV-2 at the indicated MOIs. Cells were harvested and lysed for RNA extraction and RdRp RT-qPCR analysis. (B and C) Cell supernatants from (A) were harvested at the indicated time points and type I (B) or type III (C) IFN concentrations were measured using HEK-Blue IFN-α/β and IFN-λ reporter cells, respectively. (D) Cell supernatants from (A) were harvested and cytokine concentrations were measured using the human antivirus response panel LEGENDplex at 24 h and 48 h. Concentrations are shown (top), and the fold difference in cytokine concentration in supernatants from infected compared to N.I. cells is represented as a heat map (bottom; log2 scale). (E) An antiviral response RT2 profiler PCR array analysis was performed using the RNAs from (A) extracted at 48 h (MOI 0.005). (F) Relative expression levels of the indicated IFN genes and ISGs were analyzed by RT-qPCR analysis at the indicated time points using both ActinB and GAPDH for normalization. The means of four (A and F) or three (B to E) independent experiments are shown, with error bars representing the SD from the mean.
FIG 4
FIG 4
A549-ACE2 and Caco-2-ACE2 model cell line responses to SARS-CoV-2 infection. (A and B) Human A549-ACE2 (A) and Caco-2-ACE2 (B) cells were noninfected or incubated with SARS-CoV-2 at the indicated MOIs. Cells were harvested and then lysed for RNA extraction. Relative expression levels of the indicated IFN genes and ISGs were analyzed by RT-qPCR using both ActinB and GAPDH for normalization (left y axis), while viral replication was analyzed using RdRp primers and probe (right y axis). The means of three independent experiments are shown, with error bars representing the SD from the mean.
FIG 5
FIG 5
MDA-5 is the main sensor of SARS-CoV-2 in Calu-3 model cells. Calu-3-Cas9 cells were transduced with lentiviral vectors expressing CRISPR nontargeting single-guide RNAs (sgRNAs) (Ctrl #1 and Ctrl #2) or sgRNAs targeting RIG-I, MDA-5, or MAVS, and selected for 2 weeks. (A) Expression levels of RIG-I, MDA-5, and MAVS were assessed in the different populations by immunoblotting, where actin served as a loading control (a representative immunoblot is shown). (B and C) Cells were challenged with SARS-CoV-2 at MOI 0.05 and their supernatants harvested at 24 h and 48 h postinfection. Concentrations of type I (B) and type III (C) IFNs produced in the supernatants were analyzed using HEK-Blue IFN-α/β and IFN-λ reporter cells, respectively. The means of three independent experiments are shown, with error bars representing the SD from the mean.
FIG 6
FIG 6
Inhibition of SARS-CoV-2 replication by type I IFN in Vero E6 cells. (A and B) Vero E6 cells were pretreated or not with increasing concentrations of type I IFN, as indicated, for 16 h prior to SARS-CoV-2 infection at MOI 0.0005. After 72 h, the cells were lysed and the supernatants collected, then the RNAs were extracted and viral replication was monitored in cells (A, left panel) and viral production in the supernatants (B, left panel) by RdRp RT-qPCR. The fold inhibition by IFN is shown (A and B, right panels). The means of three independent experiments are shown, with error bars representing the SD from the mean.
FIG 7
FIG 7
Inhibition of SARS-CoV-2 replication by type I IFN pretreatment in primary HAE cells and immortalized Calu-3 cells. (A) Human HAE cells (nasal, tracheal, or bronchial, as indicated) were pretreated or not with type I IFN for 20 h, and N.I. or incubated with SARS-CoV-2 on the apical side at MOI 0.1 for 1 to 2 h. Cells were harvested at 72 h postinfection, then lysed for RNA extraction and RdRp RT-qPCR analysis. (B) Plaque assays were performed on washes of the apical side of the HAE cells from (A) at 24 h, 48 h, and 72 h to determine the number of PFU per ml of supernatant (gray dotted line = detection threshold). (C) Human HAE cells were pretreated or not with IFN for 20 h, and N.I. or incubated with SARS-CoV-2 on the apical side at MOI 0.1 and 0.25 for 2 h. After 48 h, cells were stained for actin with phalloidin (magenta) and an anti-double-stranded RNA antibody (green). Representative images, acquired with an LSM880 Airyscan microscope, are shown; scale bar 10 μm. D. Calu-3 cells were pretreated or not with IFN for 16 to 20 h, the cells were N.I. or incubated with SARS-CoV-2 at the indicated MOIs, and lysed 24 h postinfection for immunoblot analysis of SARS-CoV-2 nucleoprotein (N) and spike, and IFITM3, RIG-I, MX1, and actin expression levels. A representative immunoblot is shown. (E) Human Calu-3 cells were pretreated or not with IFN, and infected as in (D). Cells were harvested and lysed for RNA extraction and RdRp RT-qPCR analysis. (F) Production of infectious viruses in supernatants from (E) was determined by plaque assays. (G) Calu-3 cells were pretreated or not with IFN and infected as in (D), and cells were stained with an anti-spike antibody. The percentage of spike positive (+) cells was scored by flow cytometry. The means of three (A and B) or four (E to G) independent experiments are shown, with error bars representing the SD from the mean.
FIG 8
FIG 8
Inhibition of SARS-CoV-2 replication by type I IFN in A549-ACE2 and Caco-2-ACE2 cells. Human A549-ACE2 (A, C, and E) and Caco-2-ACE2 (B, D, and F) cells, as indicated, were pretreated or not with IFN for 16 to 20 h, then the medium was replaced and cells were mock infected (N.I.) or incubated with SARS-CoV-2 at the indicated MOIs. (A and B) Cells were harvested and lysed for RNA extraction and RT-qPCR analysis using RdRp primers and probe. (C and D) Cells were fixed with PFA, permeabilized, and stained with an anti-spike antibody conjugated to an Alexa fluorochrome. The percentage of spike(+) cells was scored by flow cytometry. (E and F) Cells were lysed for immunoblot analysis of SARS-CoV-2 nucleoprotein (N) and spike, IFITM3, RIG-I, and MX1 ISG expression levels. Actin serves as a loading control. Representative immunoblots are shown. Of note, MX1 was not detected in Caco-2-ACE2 cell lysates. The means of three independent experiments are shown (A to D), with error bars representing one standard deviation (SD) from the mean.
FIG 9
FIG 9
IFN production upon SARS-CoV-2 replication does not protect Calu-3 and A549-ACE2 cells against infection. (A) CTRL, RIG-I, MDA-5, and MAVS Calu-3 knockout (KO) cells were infected with SARS-CoV-2 at MOI 0.05 (as in Fig. 5B and C) and viral production was measured 48 h later by plaque assays on Vero E6 cells. (B) CTRL and IRF9 Calu-3 KO cells were generated and selected. Cells were infected with SARS-CoV-2 at the indicated MOIs and viral replication was evaluated 48 h later by RdRp RT-qPCR. (C) CTRL and IRF9 KO cells were pretreated or not with IFN for 48 h, lysed, and the expression levels of IFITM3, RIG-I, MX1, and actin were analyzed by immunoblotting. (D) CTRL and JAK1 A549-ACE2 knockout cells were generated and selected. Cells were infected with SARS-CoV-2 at MOI 0.0005 and viral replication was measured 48 h later using RdRp RT-qPCR. (E) CTRL and JAK1 A549-ACE2 knockout cells were pretreated or not with IFN for 48 h, lysed, and the expression levels of IFITM3, RIG-I, and MX1 were analyzed by immunoblotting, with actin serving as a loading control. (F) Calu-3 cells were infected with SARS-CoV-2 at the indicated MOIs after a 24-h pretreatment with IFN or not, or were subsequently treated with IFN at 4 h, 8 h, or 24 h postinfection. Viral replication was measured at 48 h postinfection using RdRp RT-qPCR. The means of two (A and D) or three (B and F) independent experiments are shown, with error bars representing the SD. Representative immunoblots (C and E) are shown.

References

    1. Zhou P, Yang X-L, Wang X-G, Hu B, Zhang L, Zhang W, Si H-R, Zhu Y, Li B, Huang C-L, Chen H-D, Chen J, Luo Y, Guo H, Jiang R-D, Liu M-Q, Chen Y, Shen X-R, Wang X, Zheng X-S, Zhao K, Chen Q-J, Deng F, Liu L-L, Yan B, Zhan F-X, Wang Y-Y, Xiao G-F, Shi Z-L. 2020. A pneumonia outbreak associated with a new coronavirus of probable bat origin. Nature 579:270–273. doi:10.1038/s41586-020-2012-7. - DOI - PMC - PubMed
    1. Zhu N, Zhang D, Wang W, Li X, Yang B, Song J, Zhao X, Huang B, Shi W, Lu R, Niu P, Zhan F, Ma X, Wang D, Xu W, Wu G, Gao GF, Tan W, China Novel Coronavirus Investigating and Research Team. 2020. A novel coronavirus from patients with pneumonia in China, 2019. N Engl J Med 382:727–733. doi:10.1056/NEJMoa2001017. - DOI - PMC - PubMed
    1. Zhong N, Zheng B, Li Y, Poon L, Xie Z, Chan K, Li P, Tan S, Chang Q, Xie J, Liu X, Xu J, Li D, Yuen K, Peiris J, Guan Y. 2003. Epidemiology and cause of severe acute respiratory syndrome (SARS) in Guangdong, People’s Republic of China, in February, 2003. Lancet 362:1353–1358. doi:10.1016/S0140-6736(03)14630-2. - DOI - PMC - PubMed
    1. Drosten C, Günther S, Preiser W, van der Werf S, Brodt H-R, Becker S, Rabenau H, Panning M, Kolesnikova L, Fouchier RAM, Berger A, Burguière A-M, Cinatl J, Eickmann M, Escriou N, Grywna K, Kramme S, Manuguerra J-C, Müller S, Rickerts V, Stürmer M, Vieth S, Klenk H-D, Osterhaus ADME, Schmitz H, Doerr HW. 2003. Identification of a novel coronavirus in patients with severe acute respiratory syndrome. N Engl J Med 348:1967–1976. doi:10.1056/NEJMoa030747. - DOI - PubMed
    1. Peiris J, Lai S, Poon L, Guan Y, Yam L, Lim W, Nicholls J, Yee W, Yan W, Cheung M, Cheng V, Chan K, Tsang D, Yung R, Ng T, Yuen K. 2003. Coronavirus as a possible cause of severe acute respiratory syndrome. Lancet 361:1319–1325. doi:10.1016/S0140-6736(03)13077-2. - DOI - PMC - PubMed

LinkOut - more resources