. 2021 Jan 29;12(1):674.
doi: 10.1038/s41467-020-20632-z.

PDX1LOW MAFALOW β-cells contribute to islet function and insulin release

Affiliations

PDX1LOW MAFALOW β-cells contribute to islet function and insulin release

Daniela Nasteska et al. Nat Commun. .

Erratum in

Abstract

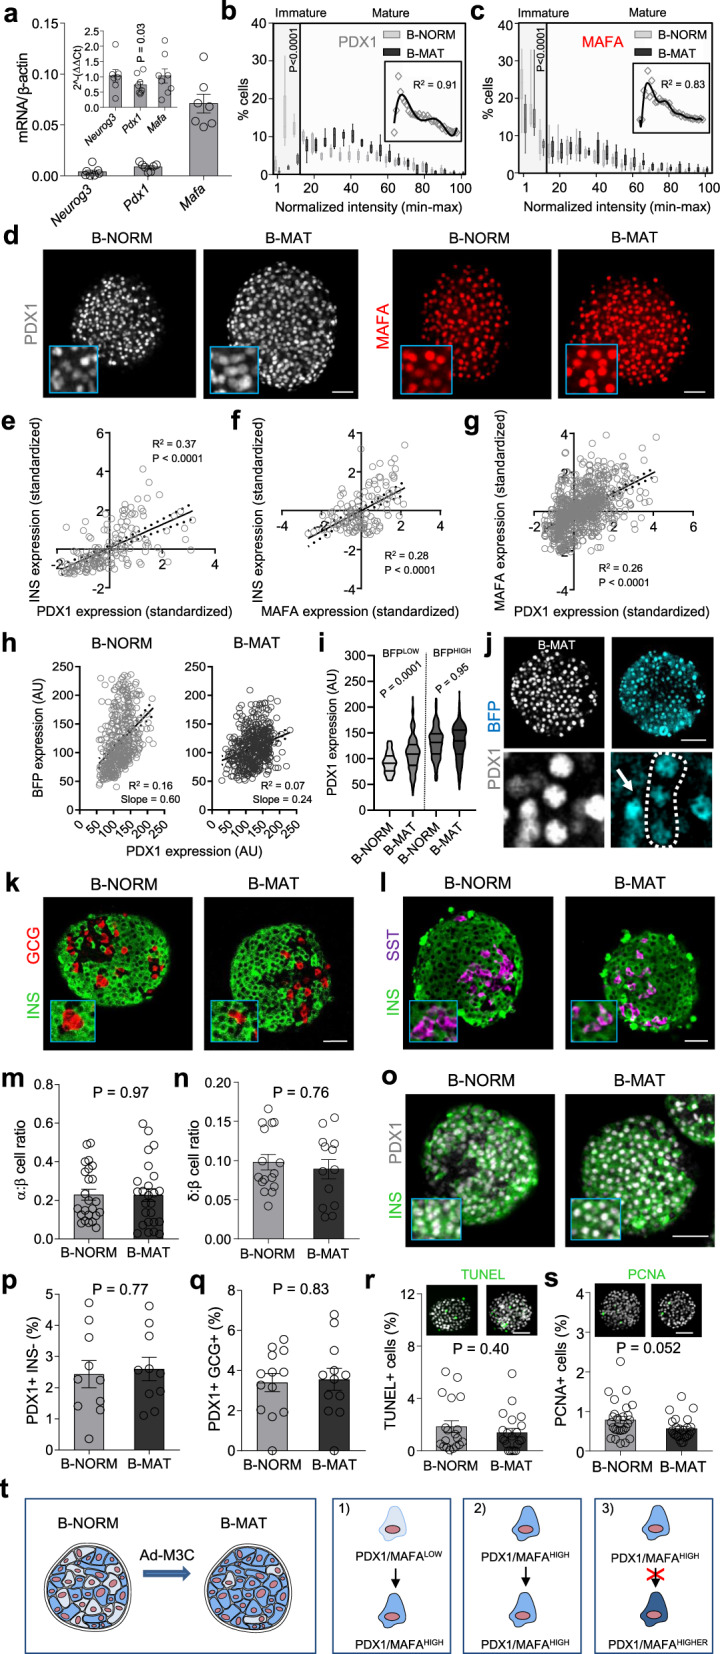
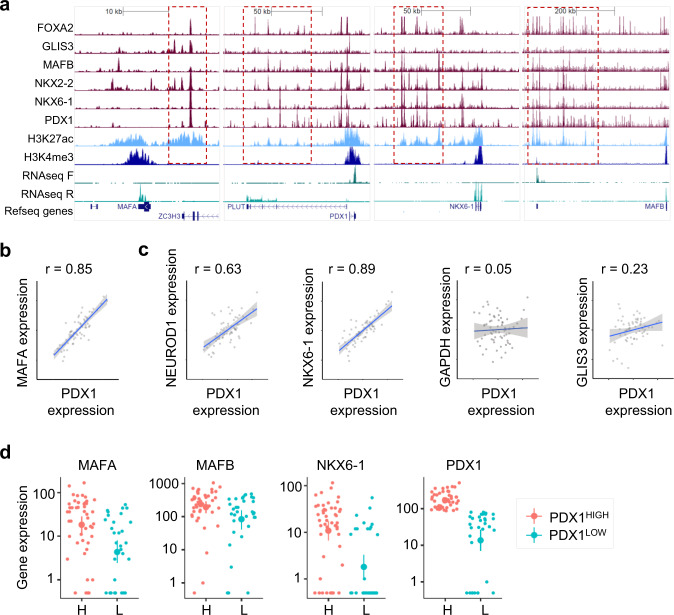
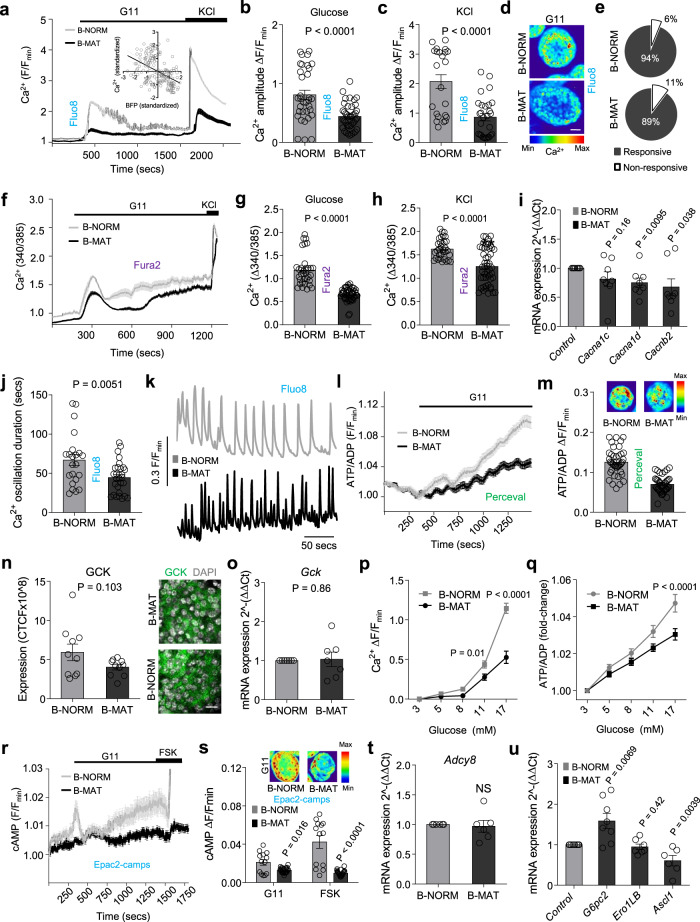
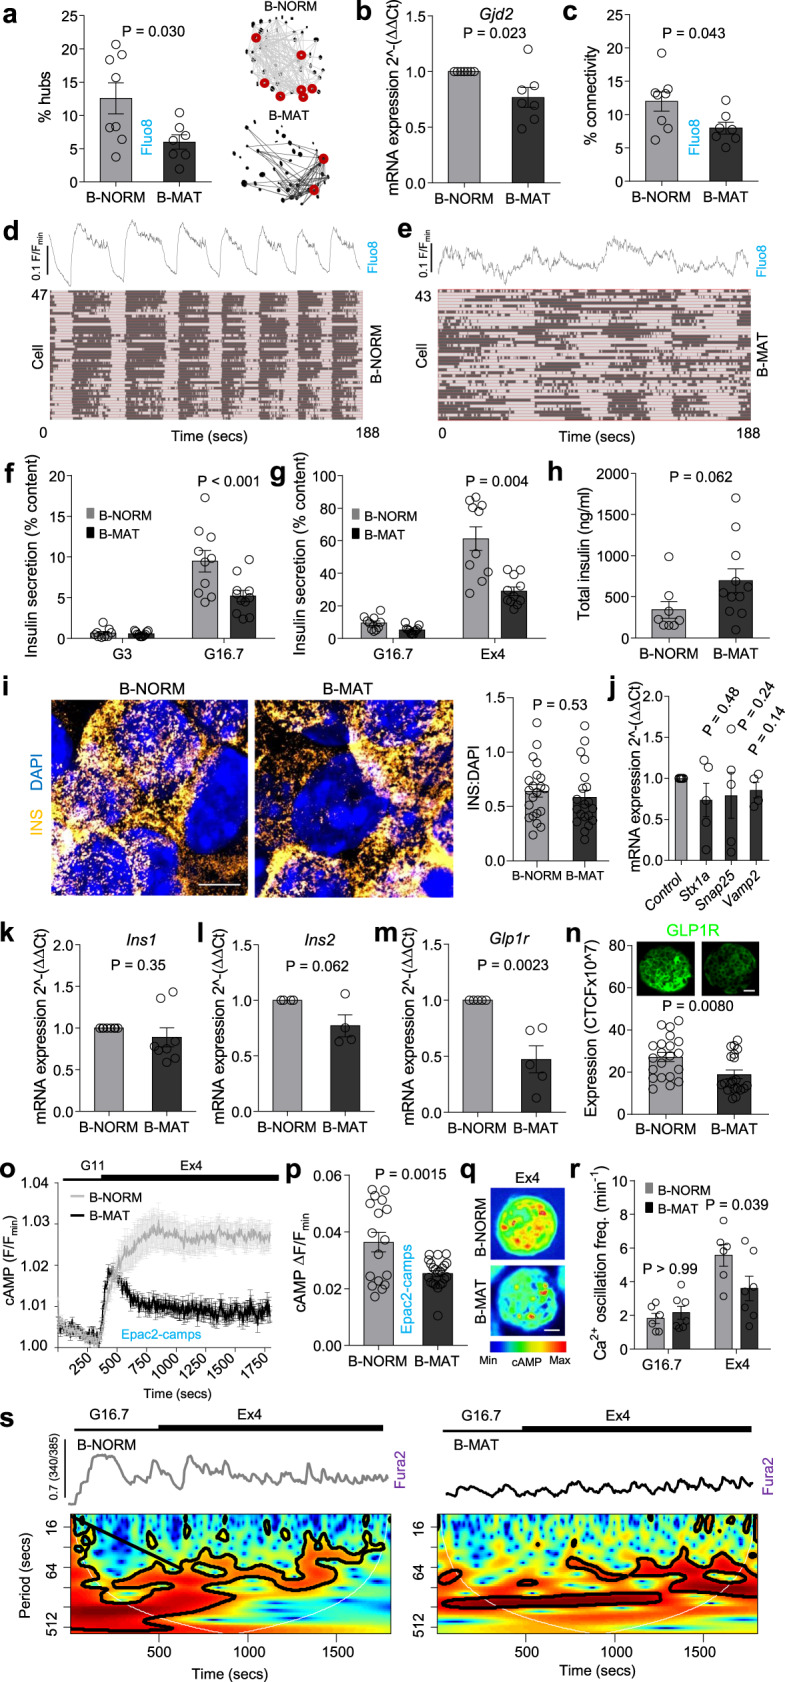
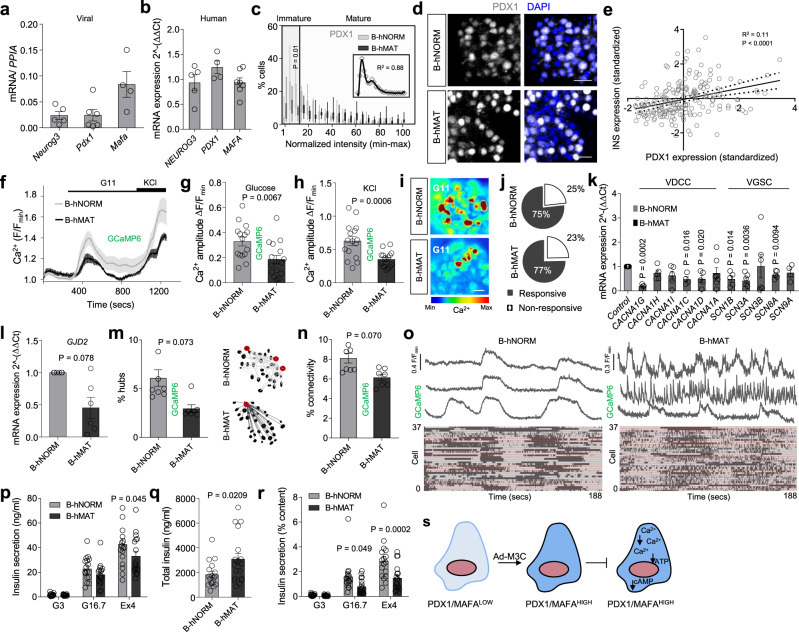
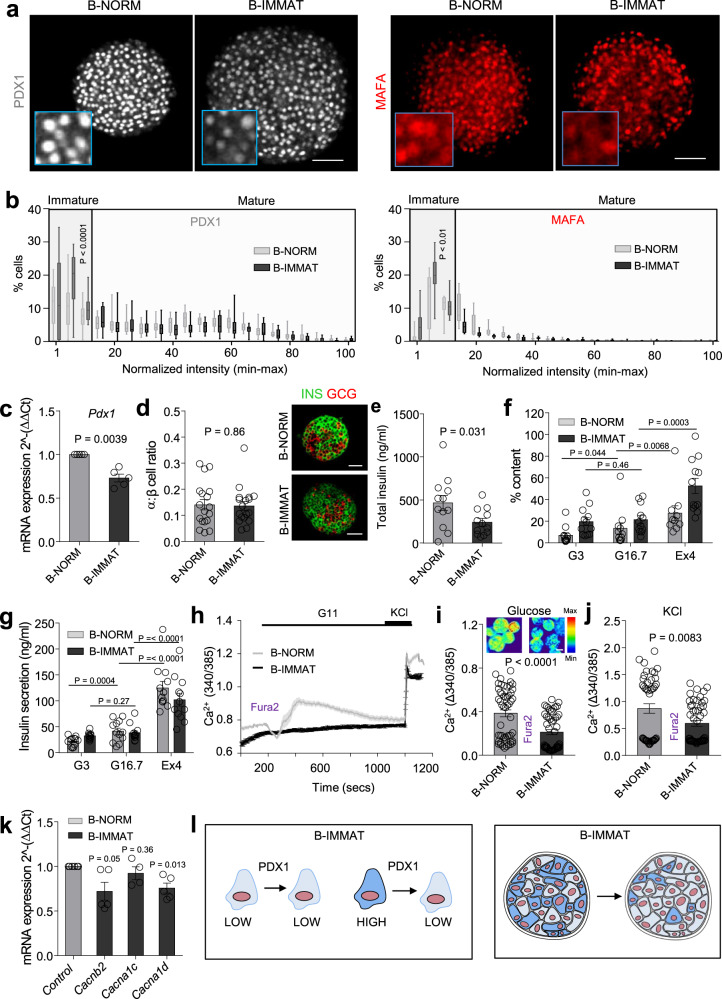
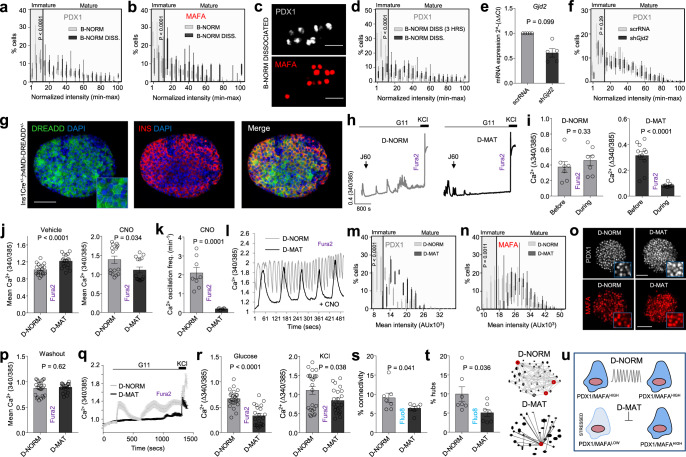
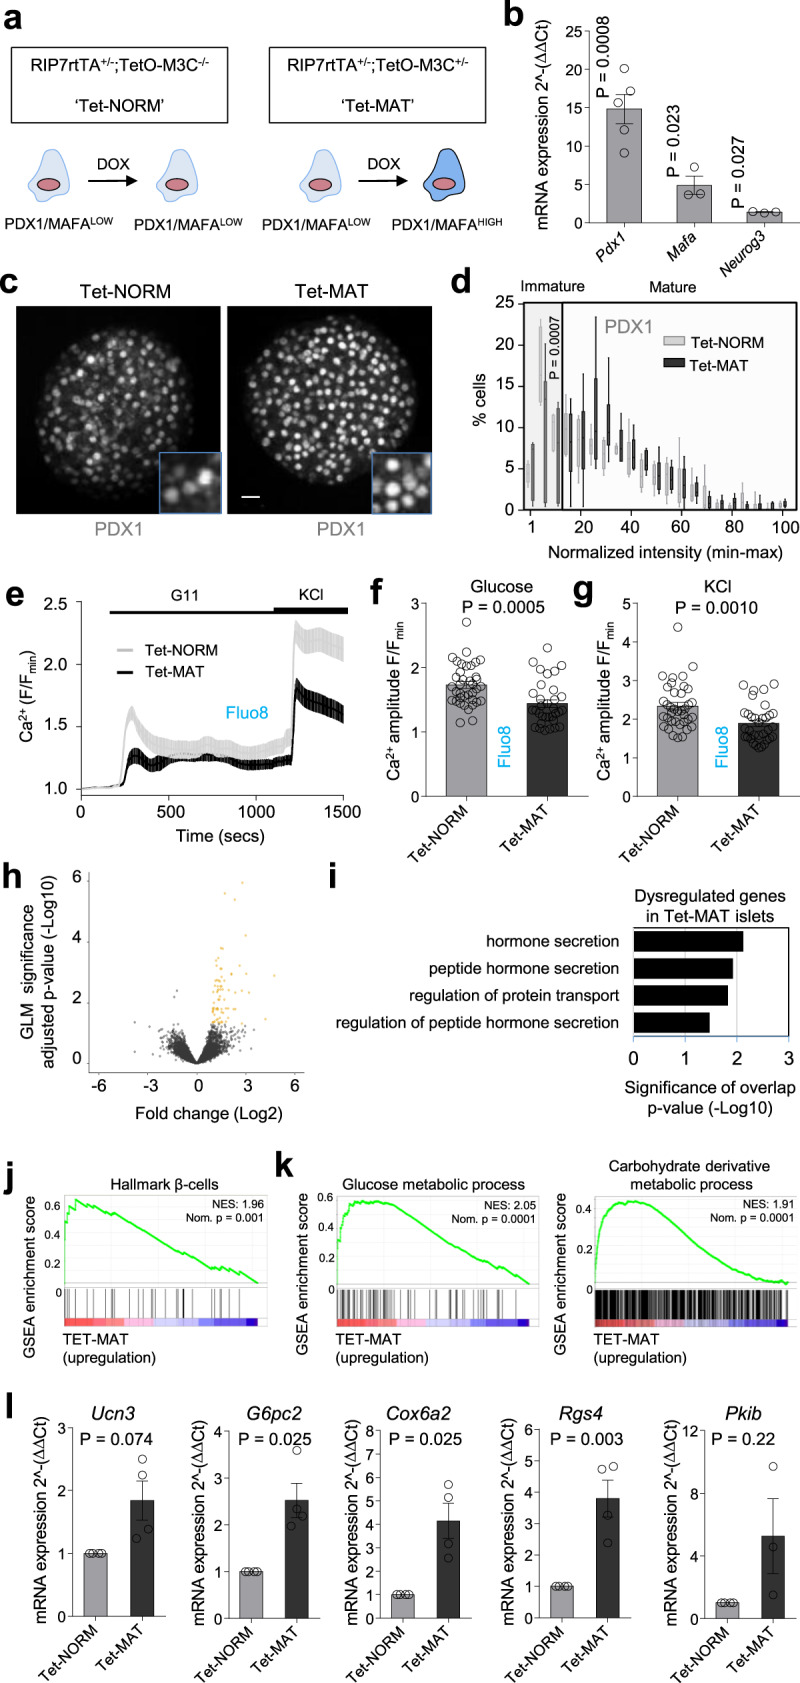
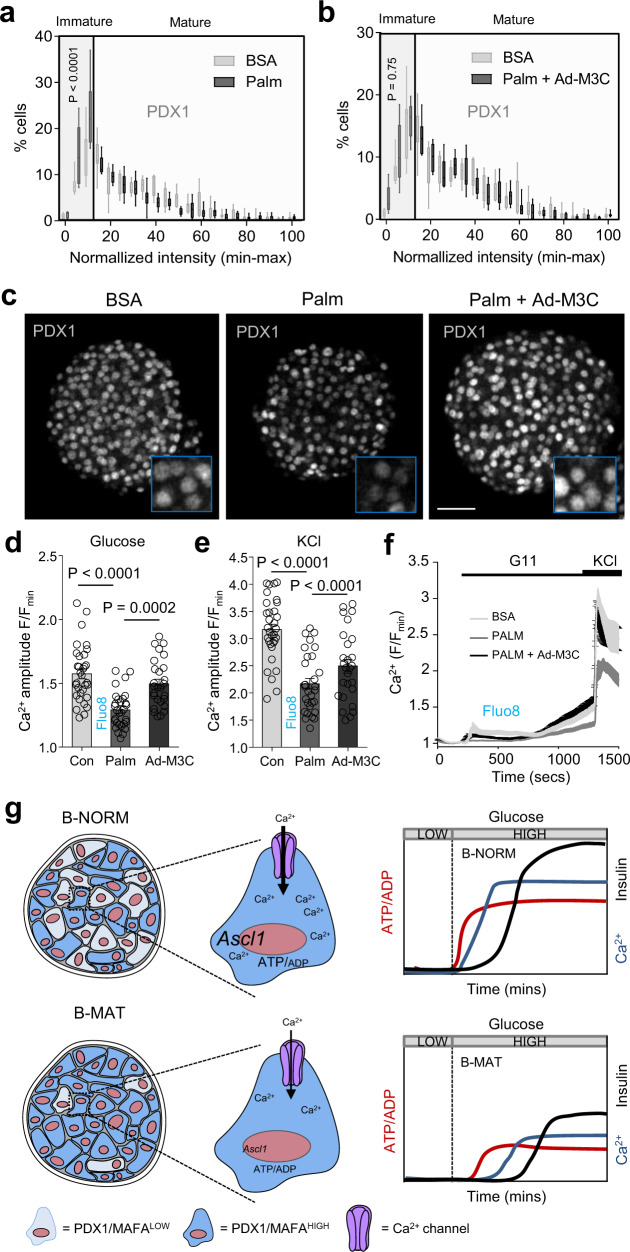
Transcriptionally mature and immature β-cells co-exist within the adult islet. How such diversity contributes to insulin release remains poorly understood. Here we show that subtle differences in β-cell maturity, defined using PDX1 and MAFA expression, contribute to islet operation. Functional mapping of rodent and human islets containing proportionally more PDX1HIGH and MAFAHIGH β-cells reveals defects in metabolism, ionic fluxes and insulin secretion. At the transcriptomic level, the presence of increased numbers of PDX1HIGH and MAFAHIGH β-cells leads to dysregulation of gene pathways involved in metabolic processes. Using a chemogenetic disruption strategy, differences in PDX1 and MAFA expression are shown to depend on islet Ca2+ signaling patterns. During metabolic stress, islet function can be restored by redressing the balance between PDX1 and MAFA levels across the β-cell population. Thus, preserving heterogeneity in PDX1 and MAFA expression, and more widely in β-cell maturity, might be important for the maintenance of islet function.


Conflict of interest statement

G.A.R. has received grant funding from Servier and is a consultant for Sun Pharma. The remaining authors declare no competing interests.

Figures

Fig. 1
Fig. 1. Generating islets with proportionally more PDX1HIGH/MAFAHIGH β-cells.
a Adenoviral Neurog3, Pdx1 and Mafa in islets (inset, endogenous gene expression) (n = 5 animals; paired t-test). b Islets transduced with Ad-M3C (β-cell mature; B-MAT) lose β-cells occupying the bottom 15 percentile for PDX1 compared to controls (β-cell normal; B-NORM) (inset, non-normalized polynomial-fitted B-NORM distribution) (n = 6 islets/3 animals; two-way ANOVA, Bonferonni’s multiple comparison) (F = 18.75, DF = 20). c As for b, but showing the frequency distribution for MAFA (n = 8 islets/3 animals; two-way ANOVA, Bonferonni’s multiple comparison) (F = 3.03, DF = 20). d Images showing more homogenous PDX1/MAFA fluorescence in B-MAT islets (scale bar = 60 µm). eg INS-PDX1 (e), INS-MAFA (f) and MAFA-PDX1 (g) are positively correlated (n = 137 cells, linear regression). h The linear correlation between PDX1 and BFP in Pdx1-BFP islets is lost following Ad-M3C transduction (B-MAT) (n = 465 cells/3 animals). i BFPLOW cells (prior immature) become PDX1HIGH in B-MAT islets, while BFPHIGH cells (prior mature) remain PDX1HIGH (n = 93 cells/3 animals; one-way ANOVA with Sidak’s multiple comparison) (F = 52.12, DF = 3). j Images from Pdx1-BFP islets showing cells that underwent PDX1LOW - > PDX1HIGH conversion (arrow shows a cell that remained PDX1HIGH) (scale bar = 50 µm) (n = 5 islets/3 animals; two-way ANOVA, Bonferroni’s multiple comparison) (F = 2.80, DF = 18). kq No differences are detected in the ratios of α- to β-cells (n = 23 islets/3 animals) and δ- to β-cells (n = 18 islets/3 animals) (kn), or the proportion of PDX1 + /INS− or PDX1 + /GLU + cells (n = 10 islets/4 animals) (oq) in B-MAT islets (unpaired t-test) (scale bar = 40 µm). r No difference in TUNEL+ cell numbers is detected in B-MAT islets (n = 18 islets/4 animals; unpaired t-test) (scale bar = 42.5 µm). s Cell proliferation is similar in B-NORM and B-MAT islets, as shown by PCNA staining (n = 24 islets/4 animals; unpaired t-test) (scale bar = 42.5 µm). t Transition to high PDX1/MAFA content occurs in PDX1LOW/MAFALOW cells (1), whereas PDX1HIGH/MAFAHIGH cells remain unaffected (2), with PDX1/MAFA levels never surpassing those in B-NORM islets (3). Bar graphs show the mean ± SEM. Violin plot shows median and interquartile range. Box-and-whiskers plot shows median and min-max. All tests are two-sided where relevant. BFP-blue fluorescent protein; INS-insulin; GLU-glucagon; SST-somatostatin; TUNEL-terminal deoxynucleotidyl transferase dUTP nick-end labeling; PCNA-proliferating cell nuclear antigen.
Fig. 2
Fig. 2. PDX1LOW/MAFALOW cells are transcriptionally immature.
a Binding of multiple transcription factors to enhancer clusters (boxed in red) regulates expression of key β-cell transcription factors in human islets. For reference, RNA-seq, H3K27ac (enhancer mark) and H3K4me3 (promoter mark) are also shown. All scales are set to 20 RPKM for ChIP-seq and 20 or 60 RPKM for RNA-seq (TF strand to 60, other to 20). b Expression of MAFA and PDX1 correlate over 64 human islet samples. The axes represent normalized expression values (−3 to 3) for each gene used for the co-expression network analysis. c Correlation of expression of mRNA for PDX1 and NEUROD1, NKX6-1, GAPDH and GLIS3 across 64 human islet samples. The axes represent normalized expression values (−3 to 3) for each gene used for the co-expression network analysis. d Single cell gene expression levels for MAFA, MAFB, NKX6-1 and PDX1 in cells with high and low mRNA levels for PDX1. Analysis was performed using Monocle, the y-axis representing gene expression levels in log10 scale. Datasets were obtained from,.
Fig. 3
Fig. 3. Differences in PDX1 and MAFA levels contribute to islet signaling.
ac Ca2+ fluxes (a) in response to glucose (b) or glucose + KCl (c) are impaired in B-MAT islets, also shown by representative images (d) (n = 34 islets/4 animals; unpaired t-test) (scale bar = 40 µm). Inset in (a) shows an inverse correlation between glucose-stimulated Ca2+ amplitude and BFP expression in individual β-cells (Pdx1-BFP; n = 6 islets/3 animals; R2 = 0.21, P < 0.0001) (G11, 11 mM glucose; KCl, 10 mM). e No diffeences in the % glucose-responsive β-cells are detected in B-MAT islets (n = 34 islets/4 animals; unpaired t-test). fh As for (ac), but using Fura2 (n = 33 islets/4 animals; unpaired t-test). i Expression of genes encoding CACNA1D and CACNB2 Ca2+ channel subunits is reduced in B-MAT islets (n = 8 animals; paired t-test). j, k Ca2+ pulse duration is reduced in B-MAT islets, as shown by summary bar graph (j) and traces (k) (n = 8 islets/4 animals; unpaired t-test). l, m ATP/ADP ratios are reduced in B-MAT islets, as shown by mean traces (l) and summary bar graph (m) (n = 40 islets/4 animals; unpaired t-test). n, o GCK expression (n) tends to be reduced in B-MAT islets (n = 10 islets/2 animals; paired t-test), although Gck levels are normal (o) (n = 7 animals; paired t-test) (scale bar = 15 µm). p, q Ca2+ (p) and ATP/ADP (q) responses to increasing glucose concentration are decreased in B-MAT islets (Ca2+: n = 11 islets/5 animals; two-way ANOVA F = 20.36, DF = 4) (ATP/ADP: n = 37 islets/5 animals, two-way ANOVA; F = 6.10, DF = 4) (Bonferroni’s multiple comparison). r, s Mean traces (r) and bar graph (s) showing reduced cAMP levels in response to glucose and forskolin (FSK, 100 μM) in B-MAT islets (n = 13 islets; unpaired t-test). t Adcy8 expression remains unchanged in B-MAT islets (n = 6 animals; paired t-test). u G6pc2 and Ascl1 are up- and down-regulated, respectively, in B-MAT islets (n = 6 animals; paired t-test). Color scale shows Ca2+ as min (0%) to max (100%) value. Bar graphs and traces show the mean ± SEM. All tests are two-sided where relevant. CTCF-corrected total cell fluorescence.
Fig. 4
Fig. 4. Both PDX1LOW/MAFALOW and PDX1HIGH/MAFAHIGH β-cells are required for islet dynamics and insulin secretion.
ac Hub cell proportion (red circles) (a) (n = 7 islets/3 animals; unpaired t-test), mRNA for Gjd2 (b) (n = 7 animals; paired t-test) and coordinated β-cell activity (connectivity) (c) (n = 7 islets/3 animals; unpaired t-test) are all decreased in B-MAT islets. d, e Raster plots showing β-cell activity profiles in B-NORM (d) and B-MAT islets (e). fh Loss of PDXLOW/MAFALOW β-cells leads to reductions in glucose (f)- and Exendin-4 (g)-stimulated insulin secretion (n = 10 replicates/4 animals; two-way ANOVA, Bonferroni’s multiple comparison) (G16.7: F = 7.89, DF = 1) (Ex4: F = 13.40, DF = 1), despite an increase in insulin content (h) (n = 8 replicates/4 animals; Mann–Whitney U-test). Samples were run together, but due to the relative magnitude of the Exendin-4 response, results are displayed separately (G3, 3 mM glucose; G16.7, 16.7 mM glucose; Ex4, 20 nM Exendin-4). i Images and summary bar graph showing insulin granule density at the membrane in B-NORM and B-MAT islets (scale bar = 6 µm) (n = 12 islets/6 animals; unpaired t-test). j No differences in Stx1a, Snap25 and Vamp2 expression are detected in B-MAT islets (n = 5 animals; paired t-test). k, l Ins1 (k) and Ins2 (l) levels are unchanged in B-MAT islets (n = 4 animals; paired t-test). m, n GLP1R mRNA (m) (n = 5 animals, paired t-test) and protein (n) (n = 20 islets/4 animals, unpaired t-test) expression are reduced in B-MAT islets (scale bar = 25 µm). oq Maximal Exendin-4-stimulated cAMP rises are blunted in B-MAT islets, shown by mean traces (o) and summary bar graph (p), as well as representative images (scale bar = 25 µm) (q) (n = 17 islets/2 animals; unpaired t-test) (G11, 11 mM glucose; Ex4, 20 nM Exendin-4). r, s Exendin-4-stimulated Ca2+-spiking is blunted in B-MAT islets (r), confirmed using wavelet analysis (s) (mean wave shown) (n = 6 islets/3 animals; two-way ANOVA, Bonferroni’s multiple comparison) (F = 4.40, DF = 1) (G16.7, 16.7 mM glucose; Ex4, 20 nM Exendin-4). Bar graphs and traces show the mean ± SEM. All tests are two-sided where relevant.
Fig. 5
Fig. 5. Both PDX1LOW and PDX1HIGH β-cells contribute to human islet function.
a, b Ad-M3C increases Neurog3, Pdx1 and MafA expression (a), while no differences are detected in native NEUROG3, PDX1 and MAFA expression (b) (n = 4–8 donors). c Ad-M3C increases the proportion of cells expressing high PDX1 levels (B-hMAT) (inset is the non-normalized B-hNORM distribution fitted with a polynomial) (n = 13 islets/4 donors; two-way ANOVA, Bonferroni’s multiple comparison) (F = 4.14, DF = 20). d Representative images showing loss of PDX1LOW cells in B-hMAT islets (detected using a PDX1 antibody with reactivity against mouse and human protein) (scale bar = 42.5 µm). e PDX1 and INS1 are positively correlated in individual cells from B-hNORM islets (n = 220 cells). fh Ca2+ traces (f) showing decreased responsiveness to glucose (g) and KCl (h) in B-hMAT islets (n = 16 islets/3 donors; unpaired t-test). i, j as for (fh), but representative images (scale bar = 25 µm) showing loss of glucose-stimulated Ca2+ rises in B-hMAT but not B-hNORM islets (i), despite no differences in the proportion of responsive cells (j) (n = 16 islets/3 donors; unpaired t-test). k The VDCC and Na+ channel subunits CACNA1G, CACNA1C, CACNA1D, SCN1B, SCN3A and SCN8A are all downregulated in B-hMAT islets (n = 4–6 donors; paired t-test). lo GJD2 expression (l) is decreased in B-hMAT islets (n = 6 donors; paired t-test), which is associated with a decrease in the number of hubs (circled in red) (m) and coordinated β-cell-β-cell activity (connectivity) (n and o) (representative traces are from ‘connected’ cells; raster plots show intensity over time) (n = 7–8 islets/3 donors; unpaired t-test). pr Non-normalized Insulin secretion is similar in B-hMAT and B-hNORM islets (p), although B-hMAT islets only release a fraction of their total insulin (q and r) (% insulin content = secreted insulin / total insulin) (n = 17–18 replicates/5 donors; unpaired t-test and two-way ANOVA, Bonferroni’s multiple comparison). s Schematic showing proposed changes occurring in β-cells in B-hMAT islets. Bar graphs and traces show the mean ± SEM. Box-and-whiskers plot shows median and min-max. All tests are two-sided where relevant. Color scale shows Ca2+ as min (0%) to max (100%) value. GCaMP6-genetically-encoded Ca2+ indicator; VDCC-voltage-dependent Ca2+ channels; VGSC-voltage-gated Na+ channels; GJD2-Gap junction delta-2 protein encoding Connexin-36.
Fig. 6
Fig. 6. A proportional increase in PDX1LOW/MAFALOW β-cells impairs islet function.
a shPdx1 increases the proportion of β-cells in the islet with low levels of PDX1 and MAFA (β-cell immature; B-IMMAT) (scale bar = 60 µm). b Quantification of PDX1 and MAFA expression intensity shows an increase in β-cells occupying the bottom 15 percentile in B-IMMAT islets (n = 13–14 islets/3 animals; two-way ANOVA, Bonferroni’s multiple comparison) (PDX1: F = 2.38, DF = 20) (MAFA: F = 3.20, DF = 20). c RT-qPCR showing a decrease in Pdx1 expression levels in B-IMMAT islets (n = 5; paired t-test). d Induction of homogenous β-cell immaturity does not alter the α- to β-cell ratio (scale bar = 42.5 µm) (n = 18 islets/ 2–3 animals; unpaired t-test). eg B-IMMAT islets display decreased insulin content (e), increased basal insulin release and absence of significant glucose-stimulated insulin secretion (f and g) (n = 10–12 replicates/4 animals; paired t-test and one-way ANOVA, Sidak’s multiple comparison) (G3, 3 mM glucose; G16.7, 16.7 mM glucose; Ex4, 20 nM Exendin-4). hj Ca2+ traces (h) and bar graphs (i and j) showing impaired responses to glucose and glucose + KCl in B-IMMAT islets (n = 49–51 islets/4–5 animals; unpaired t-test) (representative images shown above bar graph, scale bar = 75 µm). k mRNA for the L-type VDCC subunits Cacnb2 and Cacna1d are significantly downregulated in B-IMMAT islets (n = 5–6; paired t-test). l Schematic showing the proposed changes in B-IMMAT islets. Color scale shows Ca2+ as min (0%) to max (100%) value. Bar graphs and traces show the mean ± SEM. Box-and-whiskers plot shows median and min-max. All tests are two-sided where relevant. shPdx1- short hairpin RNA against Pdx1; VDCC-voltage-dependent Ca2+ channels.
Fig. 7
Fig. 7. Differences in PDX1 and MAFA levels are encoded by islet signaling patterns.
a–c Islet dissociation (B-NORM DISS.) leads to loss of β-cells in the bottom 15 percentile for PDX1 (a) and MAFA (b), also shown by representative images (c) (B-NORM data are superimposed for comparison) (n = 6 islets/4 animals; two-way ANOVA, Bonferroni’s multiple comparison) (PDX1: F = 7.23, DF = 19) (MAFA: F = 4.69, DF = 20) (scale bar = 42.5 µm). d PDX1LOW β-cells are present 3 h following islet dissociation (n = 80 islets/10 coverslips; two-way ANOVA; Bonferonni’s multiple comparison test) (PDX1: F = 9.54, DF = 40) (MAFA: F = 5.22, DF = 20). ef shGjd2 decreases Gjd2 expression (e) (n = 5 animals; paired t-test), but this does not alter the proportion of PDX1LOW β-cells (f) (n = 8 islets/2 animals; two-way ANOVA, Bonferroni’s multiple comparison) (F = 12.85, DF = 20). gi h4MDi is expressed at the β-cell membrane (g) (n = 3 islets) (scale bar = 85 µm), allowing silencing of Ca2+ activity in D-MAT but not D-NORM (control) islets (h, i) (n = 7 islets/3 animals; paired t-test). j 3 h CNO incubation decreases Ca2+ levels in D-MAT islets (vehicle, DMSO) (n = 16 islets/5 animals; Mann-Whitney U-test). k, l CNO decreases Ca2+ oscillation frequency (k) in D-MAT islets, also shown by traces (l) (n = 6 islets/2 animals; unpaired t-test). mo 48 h CNO incubation induces β-cell loss in the bottom 15 percentile for PDX1 (m) and MAFA (n) in D-MAT islets, also shown by representative images (o) (n = 8 islets/3 animals; two-way ANOVA, Bonferroni’s multiple comparison) (PDX1: F = 5.34, DF = 20) (MAFA: F = 4.63, DF = 20) (scale bar = 60 µm). p 2 h washout restores Ca2+ levels in CNO-treated islets (n = 21 islets/3 animals; unpaired t-test). q, r Ca2+ traces (q) showing blunted responses to 11 mM glucose (G11) and KCl (10 mM) (r) in D-MAT islets (following CNO washout) (n = 21 islets/3 animals; unpaired t-test). s, t D-MAT islets display decreases in β-cell–β-cell connectivity (s), associated with hub loss (red circles) (t) (n = 7 islets/4 animals; Mann Whitney U-test). u Schematic showing effects of altering Ca2+ signaling patterns. Bar graphs and traces show the mean ± SEM. Box-and-whiskers plot shows median and min-max. All tests are two-sided where relevant.
Fig. 8
Fig. 8. The balance of PDX1LOW:PDX1HIGH β-cells influences islet gene expression.
a Recombination of RIP7rtTA and TetO/M3C mice allows doxycycline-inducible changes in β-cell Neurog3, Pdx1 and Mafa expression in Tet-MAT but not Tet-NORM (control) islets. b Pdx1, Mafa and Neurog3 expression increases following incubation of Tet-MAT islets with 100 ng/ml doxycycline for 48 h (n = 3 animals; paired t-test). c, d A significant decrease in the number of PDX1LOW β-cells is seen in doxycycline-treated Tet-MAT islets, as shown by representative images (c), and shown also by the loss of cells in the lowest fluorescence intensity bins (d) (n = 6 islets/3 animals; two-way ANOVA, Bonferroni’s multiple comparison) (scale bar = 20 µm) (F = 41368, DF = 20). eg Mean traces (e) and bar graphs (f and g) showing impaired glucose- and KCl-stimulated Ca2+ rises in Tet-MAT but not Tet-NORM islets (n = 33 islets/4 animals; unpaired t-test). h Volcano plot of differential gene expression between Tet-NORM and Tet-MAT islets. Fold-change (Log2, x-axis) gene expression is plotted against adjusted p-value for differential gene expression (normalized by GLM, -Log10, y-axis). Colored dots represent Ensembl genes that are differentially regulated at an adjusted p-value < 0.05 (n = 5 animals). i Gene ontology analysis of differentially regulated genes in Tet-MAT islets. A set of 83 genes were functionally annotated using DAVID (adjusted p-value of < 0.05). j Gene set enrichment analysis (GSEA) suggests that genes belonging to the gene set “hallmark β-cells” are upregulated in Tet-MAT islets. Normalized enrichment score (NES) and nominal p-value is presented in the top right corner of the graph. k GSEA analysis shows enrichment of genes belonging to glucose and carbohydrate derivative metabolic processes amongst the upregulated genes in Tet-MAT islets. l RT-qPCR analyses confirming upregulation of Ucn3, G6pc2, Cox6a2 and Rgs4 but not Pkib in Tet-MAT islets (n = 3 animals; paired t-test). Bar graphs and traces show the mean ± SEM. Box-and-whiskers plot shows median and min-max. All tests are two-sided where relevant.
Fig. 9
Fig. 9. Maintaining PDX1LOW:PDX1HIGH β-cell balance protects against islet failure.
ac A significant decrease in the proportion of PDX1HIGH β-cells is detected in palmitate-treated islets (a), and this can be reversed using Ad-M3C (b), as shown by representative images (c) (n = 7 islets/4 animals; two-way ANOVA, Bonferroni’s multiple comparison) (Palm: F = 4.28, DF = 20) (Palm + Ad-M3C: F = 0.90, DF = 20) (BSA, bovine serum albumin; Palm, 0.5 mM palmitate for 48 h) (scale bar = 42.5 µm). Note that the same BSA-only (control) PDX1 fluorescence intensity distribution is shown in both graphs (a) and (b) to allow cross-comparison (the experiments were performed in parallel). d–f Ca2+ responses to glucose (d) and KCl (e) are blunted in palmitate-treated, but not palmitate + Ad-M3C-treated islets (n = 27 islets/4 animals; one-way ANOVA, Sidak’s multiple comparison) (G11: F = 18.80, DF = 2) (KCl: F = 23.13, DF = 2), as shown by mean traces (f). g Schematic showing that a decrease in the proportion of PDX1LOW/MAFALOW β-cells leads to altered islet Ca2+ fluxes, decreased expression of Ca2+-dependent genes such as Ascl1, and broader changes to β-cell function, including impaired ATP/ADP and insulin responses to glucose. Bar graphs and traces show the mean ± SEM. Box-and-whiskers plot shows median and min-max. All tests are two-sided where relevant.

References

    1. Rutter GA, Pullen TJ, Hodson DJ, Martinez-Sanchez A. Pancreatic beta-cell identity, glucose sensing and the control of insulin secretion. Biochem. J. 2015;466:203–218. - PubMed
    1. Benninger RK, Piston DW. Cellular communication and heterogeneity in pancreatic islet insulin secretion dynamics. Trends Endocrinol. Metab. 2014;25:399–406. - PMC - PubMed
    1. Frank JA, et al. Optical tools for understanding the complexity of β-cell signalling and insulin release. Nat. Rev. Endocrinol. 2018;14:721–737. - PubMed
    1. Dorrell C, et al. Human islets contain four distinct subtypes of β cells. Nat. Commun. 2016;7:11756. - PMC - PubMed
    1. Camunas-Soler J, et al. Patch-seq links single-cell transcriptomes to human islet dysfunction in diabetes. Cell Metab. 2020;31:1017–1031.e4. - PMC - PubMed

Publication types

MeSH terms

LinkOut - more resources