Comparative Study
. 2021 Jan 29;12(1):711.
doi: 10.1038/s41467-021-20910-4.

Artificial intelligence in sepsis early prediction and diagnosis using unstructured data in healthcare

Affiliations
Comparative Study

Artificial intelligence in sepsis early prediction and diagnosis using unstructured data in healthcare

Kim Huat Goh et al. Nat Commun. .

Abstract

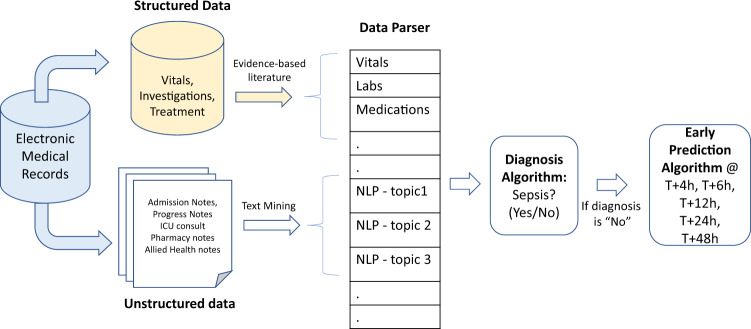
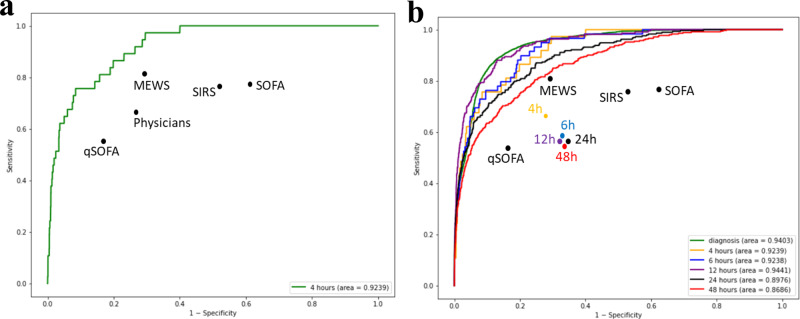
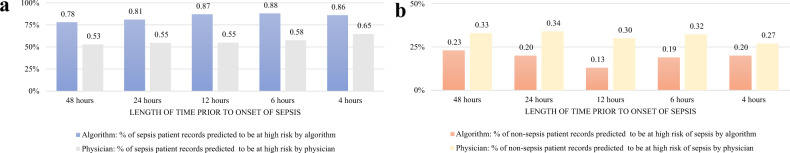
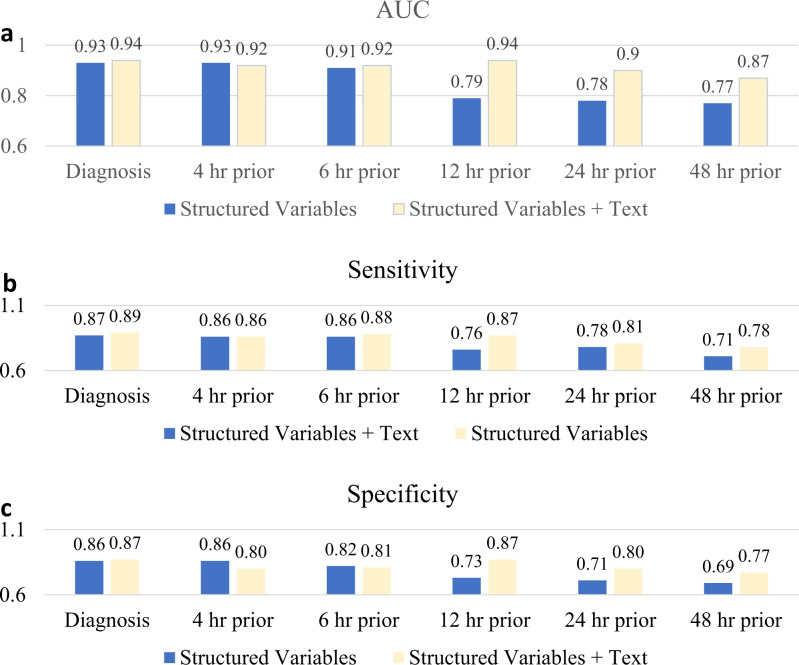
Sepsis is a leading cause of death in hospitals. Early prediction and diagnosis of sepsis, which is critical in reducing mortality, is challenging as many of its signs and symptoms are similar to other less critical conditions. We develop an artificial intelligence algorithm, SERA algorithm, which uses both structured data and unstructured clinical notes to predict and diagnose sepsis. We test this algorithm with independent, clinical notes and achieve high predictive accuracy 12 hours before the onset of sepsis (AUC 0.94, sensitivity 0.87 and specificity 0.87). We compare the SERA algorithm against physician predictions and show the algorithm's potential to increase the early detection of sepsis by up to 32% and reduce false positives by up to 17%. Mining unstructured clinical notes is shown to improve the algorithm's accuracy compared to using only clinical measures for early warning 12 to 48 hours before the onset of sepsis.


Conflict of interest statement

The authors declare no competing interests.

Figures

Fig. 1
Fig. 1. Setup of SERA algorithm.
The flow diagram shows the steps used to develop the SERA Algorithm. Both structured data (vitals, investigations, and treatment) and unstructured data (clinical notes) are used in the process of diagnosing and predicting sepsis.
Fig. 2
Fig. 2. ROC curves for 48, 24, 12, 6, and 4-h early prediction.
a, b The ROCs represent the performance of early prediction algorithm at 4, 6, 12, 24, and 48 h prior to the onset of sepsis using the independent, test sample. “qSOFA”, “MEWS”, “SIRS”, and “SOFA” represent the TPR and FPR from these methods employed by physicians in prior studies at 0–4 h prior to the onset of sepsis. “Physicians” represent TPR and FPR of patients in the independent, test sample set that were suspected by hospital’s physicians to have sepsis at 4 h prior to the onset of sepsis. b “4 h”, “6 h”, “12 h”, “24 h”, and “48 h” represent TPR and FPR of patients in the independent, test sample set that were suspected by hospital’s physicians to have sepsis at the respective time prior to the onset of sepsis.
Fig. 3
Fig. 3. Comparing the performance of the SERA algorithm vs. physician.
a The bars represent the percentage of sepsis patient records correctly flagged as having a high risk of sepsis (likely to have sepsis) by either the algorithm or physicians. The chart compares the true positive rate of the algorithm’s prediction at different lengths of time before the onset of sepsis against the true positive rate of physicians’ prediction in the hospital. b The bars represent the percentage of non-sepsis patient records erroneously flagged as having a high risk of sepsis (likely to have sepsis) by either the algorithm or physicians. The chart compares the false-positive rate of the algorithm’s prediction at different lengths of time before the onset of sepsis against the false-positive rate of physicians’ prediction in the hospital.
Fig. 4
Fig. 4. Comparing SERA algorithm performance with models without clinical text.
We measure the change in performance for each diagnosis and prediction model when clinical text is added as additional predictors. Structured variables represent the models that only include vitals, investigations, and treatment data as predictors. Structured variables + text represent the models have additional clinical notes as predictors. a Compares the AUC of models with and without clinical notes. b Compares the sensitivity of models with and without clinical notes. c Compares the specificity of models with and without clinical notes.
Fig. 5
Fig. 5. Workflow for the setup of SERA algorithm within the clinical environment.
a A proposed workflow for the SERA algorithm to operate in the background and provide alerts when key events (such as ward shift handovers) are triggered. b A proposed workflow for the SERA algorithm to run immediately after a physician updates a patient’s clinical notes in the EMR system.

References

    1. Komorowski M, Celi LA, Badawi O, Gordon AC, Faisal AA. The artificial intelligence clinician learns optimal treatment strategies for sepsis in intensive care. Nat. Med. 2018;24:1716–1720. doi: 10.1038/s41591-018-0213-5. - DOI - PubMed
    1. Sweeney TE, et al. A community approach to mortality prediction in sepsis via gene expression analysis. Nat. Commun. 2018;9:694. doi: 10.1038/s41467-018-03078-2. - DOI - PMC - PubMed
    1. van der Poll T, van de Veerdonk FL, Scicluna BP, Netea MG. The immunopathology of sepsis and potential therapeutic targets. Nat. Rev. Immunol. 2017;17:407–420. doi: 10.1038/nri.2017.36. - DOI - PubMed
    1. Rhodes A, et al. Surviving sepsis campaign: international guidelines for management of sepsis and septic shock: 2016. Intensive Care Med. 2017;43:304–377. doi: 10.1007/s00134-017-4683-6. - DOI - PubMed
    1. Ferrer R, et al. Empiric antibiotic treatment reduces mortality in severe sepsis and septic shock from the first hour: results from a guideline-based performance improvement program. Crit. Care Med. 2014;42:1749–1755. doi: 10.1097/CCM.0000000000000330. - DOI - PubMed

Publication types