. 2021 Jan 29;12(1):719.
doi: 10.1038/s41467-021-20940-y.

H3K27me3-rich genomic regions can function as silencers to repress gene expression via chromatin interactions

Affiliations

H3K27me3-rich genomic regions can function as silencers to repress gene expression via chromatin interactions

Yichao Cai et al. Nat Commun. .

Abstract

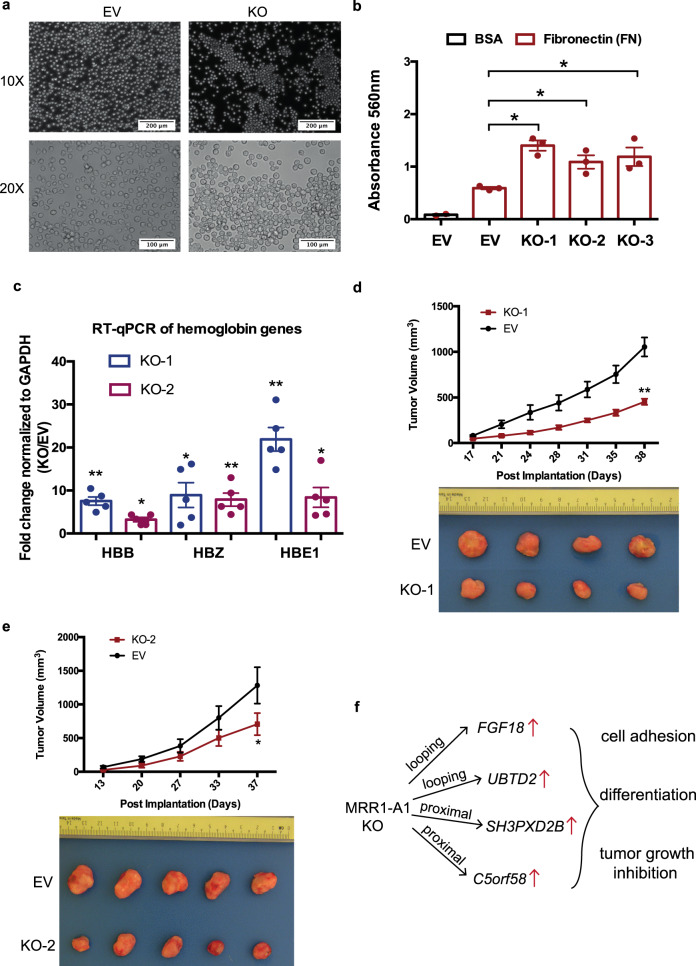
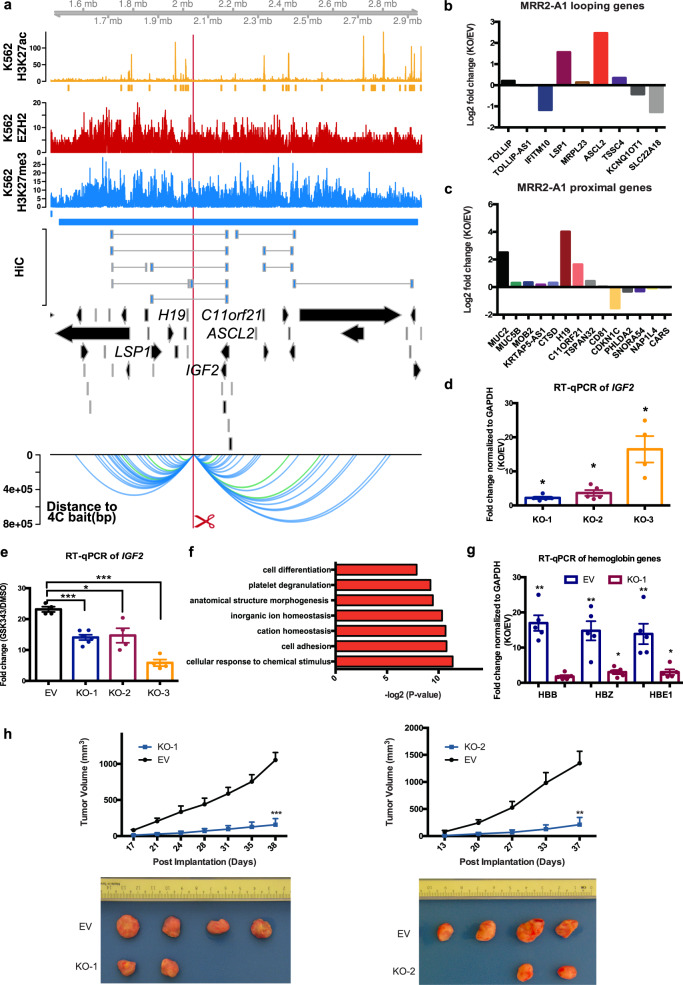
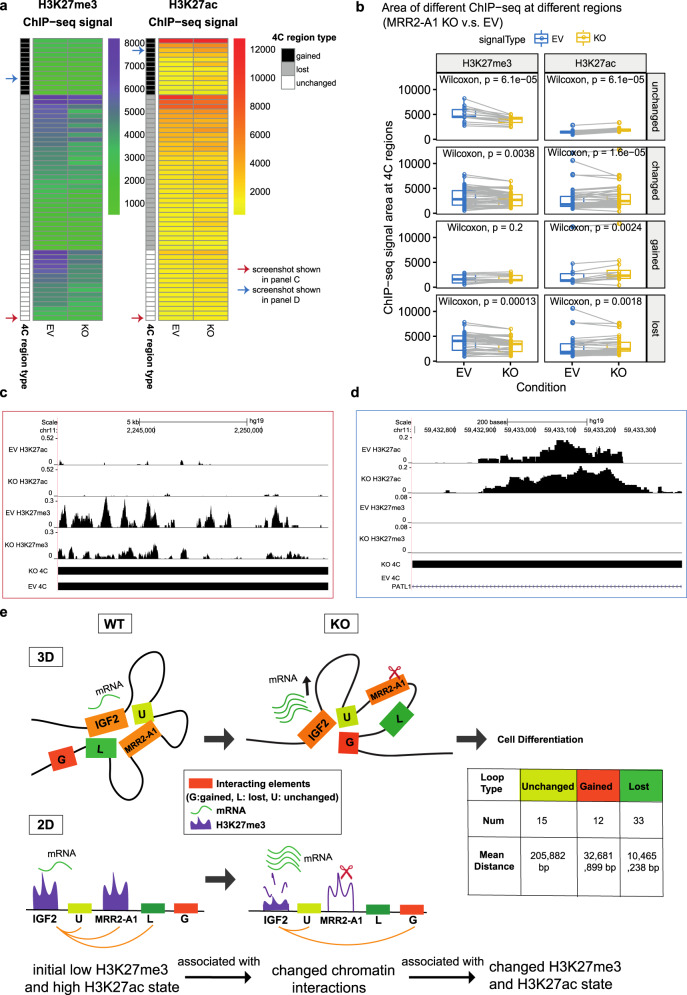
The mechanisms underlying gene repression and silencers are poorly understood. Here we investigate the hypothesis that H3K27me3-rich regions of the genome, defined from clusters of H3K27me3 peaks, may be used to identify silencers that can regulate gene expression via proximity or looping. We find that H3K27me3-rich regions are associated with chromatin interactions and interact preferentially with each other. H3K27me3-rich regions component removal at interaction anchors by CRISPR leads to upregulation of interacting target genes, altered H3K27me3 and H3K27ac levels at interacting regions, and altered chromatin interactions. Chromatin interactions did not change at regions with high H3K27me3, but regions with low H3K27me3 and high H3K27ac levels showed changes in chromatin interactions. Cells with H3K27me3-rich regions knockout also show changes in phenotype associated with cell identity, and altered xenograft tumor growth. Finally, we observe that H3K27me3-rich regions-associated genes and long-range chromatin interactions are susceptible to H3K27me3 depletion. Our results characterize H3K27me3-rich regions and their mechanisms of functioning via looping.


Conflict of interest statement

The authors declare no competing interests.

Figures

Fig. 1
Fig. 1. Definition of H3K27me3-rich regions (MRRs) and their characterization.
a Schematic figure of MRR calling. More details can be found in the Methods section. Constituent peaks, peaks that are stitched during the process of merging peak. b H3K27me3-rich regions (MRRs) and typical H3K27me3 peaks in K562 and their associated genes. A representative overlapping gene from each of the top 10 MRRs was shown. c Overlap of MRR and typical H3K27me3 with ReSE list. The Venn diagram shows the observed overlap between our MRR (H3K27me3-rich region)/typical H3K27me3 peaks and the ReSE list. Left barplot: The barplots show the percentage of elements in ReSE list that overlap with MRR/typical H3K27me3 peaks. Actual, observed overlap percentage (n = 1); expected, expected overlap percentage generated by random shuffling (n = 1000). Error bars indicate mean values ± SD. One-sided one sample t-test was used to test whether the expected are lower than the actual. Right barplot: The difference between actual and expected percentage. d ChIP-seq signal on typical H3K27me3, MRR, constituent peaks of typical H3K27me3 peaks, and constituent peaks of MRR regions in K562. Peaks are scaled to the same median length of peaks in typical H3K27me3 (1070 bp), MRR (92170 bp), constituent peaks of typical H3K27me3 (221 bp), or constituent peaks of MRRs (199 bp), and the plot expanded by 5 kb on both sides of the peak. e Expression changes associated with different peaks between different cells. K562 vs. GM12878/K562 vs. HAP1 cell lines used in the comparison. Two-tailed Wilcoxon test p values are as indicated. f Constituent peaks of MRRs have more Hi–C interactions compared to the constituent peaks of typical H3K27me3. The shuffled peaks are generated by expanding the midpoint of each constituent peaks to the median length of all the constituent peaks, and then followed by random genomic region shuffling. Two-tailed Wilcoxon test was used. Box and whiskers plot: whiskers were extended to the furthest value that is no more than 1.5 times the inter-quartile range. The boxes represent the 25th percentile, median, and 75th percentile. *p < = 0.05; **p < = 0.01; ***p < = 0.001; ****p < = 0.0001; ns, p > 0.05.
Fig. 2
Fig. 2. H3K27me3-rich regions (MRRs) preferentially associate with MRRs in the human genome via chromatin interactions.
a Schematic plot of how different categories of Hi–C interactions are defined. More details can be found in the Method section. b Observed/expected ratio of Hi–C interactions in different categories. Left: categories of chromatin pair states. Right: T (typical H3K27me3) or MRR peaks. The expected interactions are calculated from the marginal distributions of different anchors. c Different categories of MRR associated with genes. d H3K27me3-rich regions (MRRs) and typical H3K27me3 peaks in K562 and their associated genes through chromatin interactions. Peaks overlapping with Hi–C interactions are labeled with associated genes: for peaks labeled “proximal”, the gene TSS and peak occupy the same Hi-C anchor; “distal” peaks are connected to the gene via Hi–C interactions. e Expression of genes that are associated with MRR in proximal, distal, and internal category in K562 cells. The three categories are described in c. Two-tailed Wilcoxon test was used to compare proximal/distal/internal category with the control. Proximal (n = 50, p = 0.0084), distal (n = 41, p = 0.018), internal (n = 49, p = 0.0077), control (n = 46). Box and whiskers plot: whiskers were extended to the furthest value that is no more than 1.5 times the inter-quartile range. The boxes represent the 25th percentile, median, and 75th percentile. *p < = 0.05; **p < = 0.01; ***p < = 0.001; ****p < = 0.0001; ns, p > 0.05. f Example of 4C at the TMCO4 gene promoter bait showing extensive internal looping within an MRR in K562. The colors of 4C interactions are based on the distal interacting regions to the 4C bait. Blue: repressive; orange: active; green: both; gray: quiescent. The state of the 4C bait is labeled by text. Each ChIP-seq track contains ChIP signal and peaks. TE, typical enhancer; SE, super-enhancer; T, typical H3K27me3; MRR, H3K27me3-rich region. g Heatmap of transcription factors binding enrichment at interacting regions of MRRs. Each row representing an interacting region of MRRs. The number of overlapping transcription factor peaks at interacting regions are normalized to Z score per transcription factor. Red colors indicate more binding events.
Fig. 3
Fig. 3. CRISPR excision of MRR1-A1 leads to gene upregulation of multiple proximal and looping genes including FGF18.
a Screenshot showing EZH2 ChIP-seq, H3K27me3 ChIP-seq, H3K27ac ChIP-seq and chromatin interactions as identified from previously published Hi-C data, gene information, and 4C performed on the CRISPR-excised region in wild-type cells confirming chromatin interactions to FGF18, as well as showing chromatin interactions to UBTD2 and other genes. The regions highlighted in the red boxes are shown in more detail, with RNA-seq was shown as one CRISPR knockout clone over wild-type at FGF18 and UBTD2. The blue bar shows the predicted whole MRR. The red box with the red scissors indicates the region which was excised. b RNA-seq fold changes calculated from two replicates of RNA-seq data of MRR1-A1 looping genes in one MRR1-A1 knockout clone (KO) as compared with one vector control clone (“Empty Vector”; “EV”). c RNA-seq fold changes of MRR1-A1 proximal genes in KO as compared with EV. d RT-qPCR of FGF18, UBTD2 and FBXW11 in three different CRISPR-excised clones (“KO-1”, “KO-2”, “KO-3”) as compared with EV. N = 6 for each clone. e RT-qPCR of FGF18 expression upon GSK343 treatment in EV and three KO clones. Fold change was plotted compared to GAPDH for EV and KO cells in DMSO and GSK343 condition. N = 5 for each clone. f Gene Ontology (GO) was performed using significant differentially expressed (DE) genes in the RNA-seq data which was shown as ‒log2(p value). All data shown here indicates average + standard error. P value is calculated by two-tailed student’s t-test. P value less than 0.05 is shown as *. P value less than 0.01 is shown as **.
Fig. 4
Fig. 4. CRISPR excision of MRR1-A1 leads to altered adhesion, erythroid differentiation and tumor growth inhibition.
a Light microscopy photos of empty vector (EV) and CRISPR knockout clones (KO) showing increased cell adhesion and aggregates in the KO clones. ×10 and ×20 magnification were shown. The results were repeated independently five times. b A fibronectin adhesion assay showed increased adhesion of the three CRISPR knockout clones (KO) as compared with empty vector (EV). Bovine Serum Albumin (BSA) was used as a negative control. N = 3 for each clone. c. RT-qPCR of haemoglobin genes (HBB, HBZ and HBE1) in EV and two KO clones. N = 5 for each clone. d, e Tumor growth in SCID (Severe Combined Immunodeficiency) mice injected with MRR1-A1 knock out clones and empty vector cells (EV). The upper panel shows the tumor growth curve, and data shown as tumor volume with different post implantation days. The panel below was the representative tumor picture at the final day. N = 5 for each group. f Schematic model: MRR1-A1 excision leads to changes in gene expression levels of multiple genes which further leads to cell adhesion, differentiation and tumor growth inhibition. All data shown here indicates average + standard error. P value is calculated by two-tailed student’s t-test. P value less than 0.05 is shown as *. P value less than 0.01 is shown as **.
Fig. 5
Fig. 5. CRISPR excision of MRR2-A1 leads to multiple gene upregulation including IGF2 gene, erythroid differentiation and tumor growth inhibition.
a Screenshot showing EZH2 ChIP-seq, H3K27me3 ChIP-seq, H3K27ac ChIP-seq and chromatin interactions as identified from previously published Hi-C data, gene information, and 4C performed on the CRISPR-excised region in wild-type cells confirming chromatin interactions to IGF2 as well as other genes. The blue bar shows the predicted MRR. The red box with the red scissors indicates the region which was excised. b RNA-seq fold changes of MRR2-A1 looping genes in KO as compared with EV. c RNA-seq fold changes of MRR2-A1 proximal genes in KO as compared with EV. d RT-qPCR of IGF2 in three different CRISPR-excised clones (KO-1, KO-2, KO-3) as compared with vector control cells (“EV”). N = 5 for each clone. e RT-qPCR of IGF2 expression upon GSK343 treatment in EV and three KO clones. Fold change was plotted compared to GAPDH for EV and KO cells in DMSO and GSK343 condition. N = 5 for each clone. f Gene Ontology (GO) was performed using significant DE genes in the RNA-seq data shown as −log2(p value). g RT-qPCR of haemoglobin genes (HBB, HBZ and HBE1) in EV and two KO clones. N = 5 for each clone. h Tumor growth in SCID (Severe Combined Immunodeficiency) mice injected with MRR2-A1 knock out cells and empty vector cells (EV). The upper panel shows the tumor growth curve, and data shown as tumor volume with different post implantation days. The panel below was the representative tumor picture at the final day. N = 5 for each group. All data shown here indicates average + standard error. P value is calculated by two-tailed student’s t-test. P value less than 0.05 is shown as *. P value less than 0.01 is shown as **. P value less than 0.001 is shown as ***.
Fig. 6
Fig. 6. Initial histone states predict the changed loops upon MRR2-A1 removal.
a Representative chromatin interactions at IGF2 bait in KO and control clones which shown as loops. b The average distance of changed loops (gained loops and lost loops) is greater than unchanged loops upon MRR2-A1 KO when using IGF2 promoter as the bait. c ChIP-seq and ChIP-qPCR of H3K27me3 and H3K27ac for four regions (R1-R4) at IGF2 gene in EV and KO clones. N = 3 for each region. Data shown here are average + standard error. P value is calculated by two-tailed student’s t-test. P value less than 0.05 is shown as *. P value less than 0.01 is shown as **. d Heatmap about Integrative analysis of 4C, H3K27me3 and H3K27ac ChIP-seq in EV. Left panel: different 4C regions are classified according to their H3K27me3 signal intensity in EV. H3K27me3 signal level at these 4C regions are tertiled in three cohorts: high, medium, and low. 4C region type indicates different categories of 4C regions (Gained, lost and unchanged). The 4C interaction intensities are shown in log10 (RPM). Right panel: different 4C regions are classified according to their H3K27ac signal intensity in EV. Similar to the left panel, the H3K27ac signal level at these 4C regions are tertiled in three cohorts.
Fig. 7
Fig. 7. Unchanged loops and gained loops to IGF2 become increased H3K27ac and decreased H3K27me3 levels upon MRR2-A1 removal.
a Heatmap of ChIP-seq signal changes of H3K27me3 and H3K27ac at different types of 4C regions (gained, lost and unchanged) in empty vector (EV) and MRR2-A1 KO clones. Blue arrow: this region is shown as a screenshot in c. Red arrow: this region is shown as a screenshot in d. b Boxplots of ChIP-seq signal changes of H3K27me3 and H3K27ac at different types of 4C regions in EV and MRR2-A1 KO clones. The same 4C regions are connected by gray lines. Box and whiskers plot: whiskers were extended to the furthest value that is no more than 1.5 times the inter-quartile range. The boxes represent the 25th percentile, median, and 75th percentile. *p < = 0.05; **p < = 0.01; ***p < = 0.001; ****p < = 0.0001; ns, p > 0.05. c Zoomed screenshot about one of the unchanged 4C regions indicated in a which showed a decrease of H3K27me3. d Zoomed screenshot about one of the gained 4C regions in a which showed an increase of H3K27ac. e 3-dimensional and 2-dimensional cartoon schematics of our proposed model that initial histone states are associated with changed loops and MRR2-A1 removal leads to increase of H3K27ac levels on unchanged loops and gain of chromatin loops in regions with high H3K27ac levels.
Fig. 8
Fig. 8. MRR-associated gene expression and chromatin interactions changes after EZH2 perturbation.
a H3K27me3 ChIP-seq signal at peaks from DMSO-treated and 5 μM GSK343-treated K562 cells. Top panel: average H3K27me3 signal of H3K27me3 peaks in DMSO and GSK343 condition. Middle panel: H3K27me3 signal of DMSO H3K27me3 peaks in DMSO and GSK343 condition. Bottom panel: H3K27me3 signal of GSK343 H3K27me3 peaks in DMSO and GSK343 condition. b Expression changes of genes associated with different types of peaks in 5 μM GSK343-treated K562 cells. One-tailed wald test was used for testing significant upregulation. All the P values of genes in each category are aggregated using Lancaster aggregatin. *p < = 0.05; **p < = 0.01; ***p < = 0.001; ****p < = 0.0001; ns, p > 0.05. Box and whiskers plot: whiskers were extended to the furthest value that is no more than 1.5 times the inter-quartile range. The boxes represent the 25th percentile, median, and 75th percentile. c 4C results of FGF18 in DMSO and 5 μM GSK343-treated K562 cells. The colors of 4C interactions are based on the distal interacting regions. Blue: repressive; orange: active; green: both; gray: quiescent. The height of the 4C is shown in Reads Per Million (RPM). The ChIP-seq signal and peaks of H3K27ac, H3K27me3, and H3K4me3 are shown. d Zoomed-in view of 1000 kb region downstream of the 4C bait indicated in c. Top and bottom panel: 4C interactions in DMSO and 5 μM GSK343 conditions. Y-axis is scaled to the distance to the 4C bait. The color palette is the same as c. Middle panel: types of the 4C HindIII fragment. Gray, unchanged (present in both conditions); Red, gained (only present in 5 μM GSK343 condition); Green, lost (only present in DMSO condition). All the 4C regions are shown in two alternate rows to have a better visual separation. e Zoomed-in view of 50 kb region downstream of the 4C bait indicated in c. The details of each panel are the same as in d. f Density plot of different categories of 4C interactions on the same chromosome as the bait. All the 4C interactions that have p value < 0.05 on the same chromosome as the 4C bait are included.
Fig. 9
Fig. 9. Analysis of stable and changing chromatin interactions upon EZH2 inhibition.
a Proportions of unchanged 4C interactions in different distance categories (short, intermediate and long) in 5 μM GSK343-treated K562 cells. The bait name is used as the name of the 4C libraries. As the distance of 4C interactions increases, the proportion of unchanged 4C interactions drops, suggesting that long-range interactions are perturbed. b The average distance of changed loops (gained loops and lost loops) is greater than unchanged loops upon GSK343 treatment when using MRR2-A1 as the bait. c Venn diagram of 4C chromatin interactions using MRR2-A1 as the bait in DMSO and GSK343 condition. d Table of Reads Per Million (RPMs) of 4C chromatin interactions in two individual replicates. e 3C-PCR of IGF2-MRR2-A1 loop in DMSO and GSK343 condition by two independent 3C libraries. The data are shown as relative intensity. f RT-qPCR of TRPM5 gene (N = 4) and 3C-PCR of TRPM5-MRR2-A1 in DMSO and GSK343 condition by two independent 3C libraries. All data shown here are average + standard error. P value is calculated by two-tailed student’s t-test. P value less than 0.01 is shown as **.
Fig. 10
Fig. 10. Integrative analysis of H3K27me3, H3K27ac and chromatin interactions upon EZH2 inhibition.
a Heatmap of ChIP-seq signal changes of H3K27me3 and H3K27ac at different types of 4C regions (gained, lost and unchanged) in DMSO and GSK343 treated K562 cells. b Boxplots of ChIP-seq signal changes of H3K27me3 and H3K27ac at different types of 4C regions in DMSO and GSK343 treated K562 cells. The same 4C regions are connected by gray lines. Unchanged (n = 86), changed-gained (n = 26), changed-lost (n = 58), changed (gained plus lost, n = 84). Wilcoxon paired test p values are indicated. Box and whiskers plot: whiskers were extended to the furthest value that is no more than 1.5 times the inter-quartile range. The boxes represent the 25th percentile, median, and 75th percentile. c Screenshot of H3K27me3 and H3K27ac ChIP-seq at MRR2-A1, IGF2 gene and TRPM5 gene regions in DMSO and GSK343 as well as 4C-seq using MRR2-A1 as the bait. MRR2-A1 bait, IGF2 bait and TRPM5 bait were highlighted and zoomed in for ChIP-seq. d 3-dimensional and 2-dimensional cartoon schematics of our proposed model involving two mechanisms of how GSK343 leads to IGF2 gene and TRPM5 gene upregulation at stable and changing chromatin interactions respectively.

Similar articles

Cited by

References

    1. Schmitt AD, Hu M, Ren B. Genome-wide mapping and analysis of chromosome architecture. Nat. Rev. Mol. Cell Biol. 2016;17:743–755. doi: 10.1038/nrm.2016.104. - DOI - PMC - PubMed
    1. See YX, Wang BZ, Fullwood MJ. Chromatin interactions and regulatory elements in cancer: from bench to bedside. Trends Genet. 2019;35:145–158. doi: 10.1016/j.tig.2018.11.007. - DOI - PubMed
    1. Babu D, Fullwood MJ. 3D genome organization in health and disease: emerging opportunities in cancer translational medicine. Nucleus. 2015;6:382–393. doi: 10.1080/19491034.2015.1106676. - DOI - PMC - PubMed
    1. Bradner JE, Hnisz D, Young RA. Transcriptional addiction in cancer. Cell. 2017;168:629–643. doi: 10.1016/j.cell.2016.12.013. - DOI - PMC - PubMed
    1. Akincilar SC, et al. Long-range chromatin interactions drive mutant TERT promoter activation. Cancer Discov. 2016;6:1276–1291. doi: 10.1158/2159-8290.CD-16-0177. - DOI - PubMed

Publication types

MeSH terms