. 2021 Jan 29;12(1):681.
doi: 10.1038/s41467-021-20905-1.

Single cell sequencing reveals endothelial plasticity with transient mesenchymal activation after myocardial infarction

Affiliations

Single cell sequencing reveals endothelial plasticity with transient mesenchymal activation after myocardial infarction

Lukas S Tombor et al. Nat Commun. .

Abstract

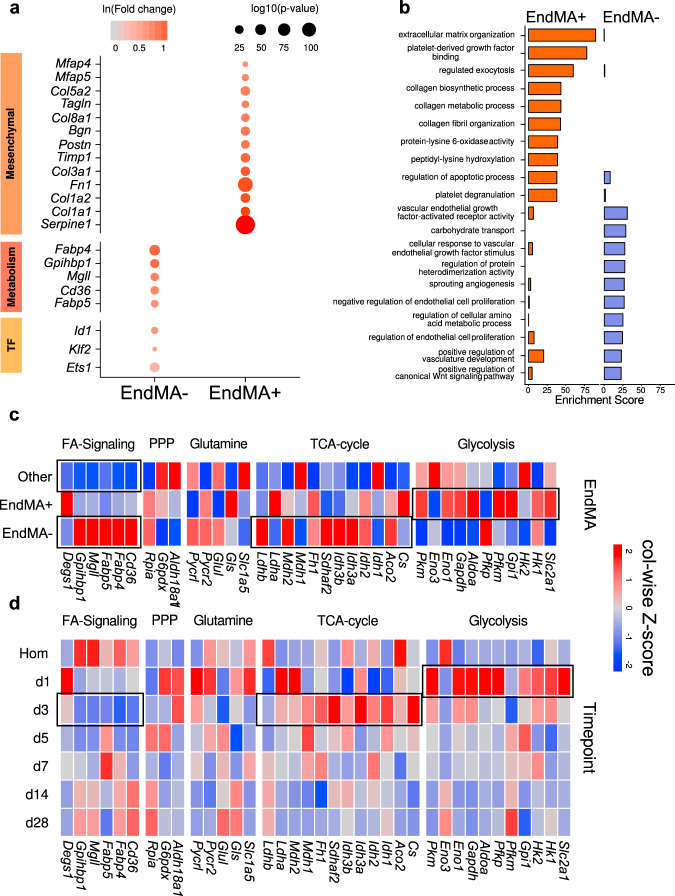
Endothelial cells play a critical role in the adaptation of tissues to injury. Tissue ischemia induced by infarction leads to profound changes in endothelial cell functions and can induce transition to a mesenchymal state. Here we explore the kinetics and individual cellular responses of endothelial cells after myocardial infarction by using single cell RNA sequencing. This study demonstrates a time dependent switch in endothelial cell proliferation and inflammation associated with transient changes in metabolic gene signatures. Trajectory analysis reveals that the majority of endothelial cells 3 to 7 days after myocardial infarction acquire a transient state, characterized by mesenchymal gene expression, which returns to baseline 14 days after injury. Lineage tracing, using the Cdh5-CreERT2;mT/mG mice followed by single cell RNA sequencing, confirms the transient mesenchymal transition and reveals additional hypoxic and inflammatory signatures of endothelial cells during early and late states after injury. These data suggest that endothelial cells undergo a transient mes-enchymal activation concomitant with a metabolic adaptation within the first days after myocardial infarction but do not acquire a long-term mesenchymal fate. This mesenchymal activation may facilitate endothelial cell migration and clonal expansion to regenerate the vascular network.


Conflict of interest statement

The authors declare no competing interests.

Figures

Fig. 1
Fig. 1. Myocardial infarction induces various changes in endothelial cells.
a tSNE plot from pooled single-cell RNA sequencing data of non-cardiomyocytes from hearts after myocardial infarction (MI). Homeostasis (Hom), day(d) d1, d3, d5, d7, d14, and d28 post MI cardiovascular cells (n = 35,312 cells; n = 1 mouse per time point). We found seven cell types: fibroblasts (Fb), monocytes (Mono), endothelial cells (Ec), B-cells, T-cells, smooth muscle cells (Smc), and unknown (U). b tSNE plot highlighting scaled and normalized UMI counts for endothelial genes Cdh5 (VE-cadherin) and Pecam1 (CD31). c Kinetic of proportion of endothelial cells, macrophages, and mesenchymal cells relative to total number of cells per timepoint. Cell types were annotated based on Seurat’s clustering in a and markers as described in (Supplementary Fig. 1a). Data represent n = 1 mouse per timepoint, n = 4219 endothelial cells, n = 10,347 macrophages, n = 17,459 mesenchymal cells. d GO-Term enrichment of genes significantly regulated (Bonferroni adjusted p < 0.05) over time course in endothelial cells (Pecam1+/Cdh5+). Color indicates combined enrichment score (based on Enrichr software). Size indicates number of significant regulated genes per total genes in GO-Term. e Relative number of endothelial cells expressing (UMI ≥ 1) apoptosis marker genes (Bcl2-associated protein X; Bax and p53; Trp53), hypoxia marker genes (Hypoxia inducible factor; Hif1a and lactate dehydrogenase A; Ldha) and inflammation marker (Interleukin 1b and 6; Il1b and Il6 and tumor necrosis factor alpha; Tnf). Data represent n = 1 mouse per timepoint, n = 2905 Pecam1+/Cdh5+ positive cells. f Assignment of endothelial cell phase by Seurat’s ‘CellCycleScoring’ function. Data is presented as percentage per timepoint. P-value was calculated using Chi-squared test of independence with Yates correction, p = 0.0004. Data represent n = 1 mouse per timepoint, n = 2905 Pecam1+/Cdh5+ positive cells. g Individual fold change to homeostasis of significant (Bonferroni adjusted p < 0.05) markers for S-phase and G2/M-phase in d3 endothelial cells. Data shown as mean ± SEM. Data represent n = 1 mouse per timepoint, n = 2905 Pecam1+/Cdh5+ positive cells.
Fig. 2
Fig. 2. Endothelial cells gain mesenchymal markers at day 1–7 after myocardial infarction.
a Pseudo-time trajectory analysis of endothelial cells (ECs), using significantly regulated genes between timepoints. Pie charts showing how many cells were assigned to each cluster relative to the total number of cells per timepoint. (n = 2905 cells, ECs were selected from data shown in Fig. 1b). b Dot plot showing fold-change (blue to red) of marker genes associated with fatty acid oxidation, mesenchymal identity, and cell cycle proliferation between trajectory states shown in a. Size indicates adjusted p-value for each gene in log10 scale. c Violin plot showing increased values of normalized UMI counts for mesenchymal markers (Col3a1 and Serpine1) and decreased values for endothelial marker (Cdh5) in trajectory state 4 (n = 694 cells), compared to other states (n = 2111 cells, p = 3.3 × 10−76 (Col3a1), p = 2.6 × 10−27 (Serpine1), p = 1.7 × 10−75 (Cdh5), bimodial likelihood-ratio test, Bonferroni adjusted p-values) d EndMT marker show significant upregulation between d1–d7 in ECs compared to baseline (homeostasis). Data is presented in average fold-change to homeostasis, mean ± standard deviation. e Bulk-RNA sequencing analysis of isolated endothelial cells comparing homeostasis (n = 4) and d3 after acute myocardial infarction (AMI; n = 3). Color indicates column-wise z-score (blue to red). f Heatmap of various endothelial marker, showing reduction of mean UMI levels at d1–d7 after infarction in ECs. Upper panel represents the mean z-score of all four endothelial markers per time point. Data is presented as mean ± SEM. g Comparison of Pecam1 (endothelial marker) and Fn1 (mesenchymal marker) levels. Every point indicates an individual cell. Boxes (quadrants, Q1 and Q3) show cells which are expressing the marker strongly (top 50% of all non-zero values). Percentage values are indicative of how many cells per timepoint are grouped in the respective box. Data represent n = 1 mouse per timepoint, Homeostasis n = 592 cells, d1 n = 71 cells, d3 n = 70 cells, d5 n = 181 cells, d7 n = 277 cells.
Fig. 3
Fig. 3. Activated endothelial cells show distinct transcriptional phenotypes.
a Dot plot showing significant change (Bonferroni adjusted p < 0.05) of various mesenchymal, metabolism, and transcription factor genes in Pecam1+/Cdh5+/Serpine1+/Fn1+ cells (EndMA+) compared to other endothelial cells (Pecam1+/Cdh5+/mesenchymal marker-; EndMA) cells. Color indicates log-fold change (red to gray), size depicts significance level (log10 p-value). b Top 10 enriched GO-terms ranked by Enrichr’s combined score for genes, significantly upregulated in EndMA+ and EndMA, respectively. c, d Heatmap showing gene regulation of genes associated with fatty acid (FA) signaling, pentose phosphate pathways (PPP), glutamine metabolism, tricarboxylic acid (TCA) cycle and glycolysis pathway comparing EndMA+, and EndMA and all other cells in the dataset (c) at the indicated time points in endothelial cells (d). Data is presented in row-wise z-score.
Fig. 4
Fig. 4. EndMA is a reversible activation of endothelial cells.
a tSNE plot showing all sequenced cells for all timepoints (Homeostasis, d1, d3, d7, d14, d28) in hearts of tamoxifen treated Cdh5-CreERT2;mT/mG animals (n = 15,365 cells, 1 mouse per time point). We found four mesenchymal clusters (0,1,3,9), three endothelial clusters (2,8,13), three macrophage/monocyte clusters (4,7,11), four clusters of smooth muscle cells/pericytes (10,14,15,16), two clusters of T-cells (6,12), and one cluster of B-cells (5). b tSNE plot showing GFP+ traced endothelial cells (n = 1393 cells). c tSNE plot highlighting expression levels of endothelial marker (Pecam1, Cdh5, Vwf) and mesenchymal marker (Col1a1, Pdgfra, Serpine1) as scaled normalized UMI. d Left panel (green) displays relative number of cells expressing (UMI ≥ 1) GFP, Cdh5, and the mesenchymal markers (Col1a1, Serpine1, or Col3a1) per timepoint. Right panel (blue) shows population of cells not expressing Cdh5 in this context. Data represents n = 1 mouse per timepoint. Homeostasis n = 592 cells, d1 n = 87 cells, d3 n = 44 cells, d7 n = 166 cells, d14 n = 304 cells, d28 n = 270 cells. e tSNE plot of reclustered GFP positive cells, showing 7 independent clusters. f Gene expression of different marker genes in different cluster shown in e. Color indicates the log-fold change (blue to red), size shows log p-value. g Relative number of cells assigned to the different clusters from (e) in homeostasis and d7. h, i Fold change of SM22 (TAGLN) (h) and Calponin (CNN1) (i) mRNA levels measured by qRTPCR (n = 3 independent experiments) in HUVECs treated with TGF-β2 supplemented medium (turquoise) and control medium (gray). Expression values were normalized to RPLP0. HUVECs cultured for 3 days in TGF-β2 and subsequent cultivation in control medium until 7 days are shown in green. P-value was calculated using Kruskal–Wallis test (p = 0.005 SM22, p = 0.006 CNN1). Data shown as mean ± SEM.

References

    1. Potente M, Makinen T. Vascular heterogeneity and specialization in development and disease. Nat. Rev. Mol. Cell Biol. 2017;18:477–494. doi: 10.1038/nrm.2017.36. - DOI - PubMed
    1. Augustin, H. G. & Koh, G. Y. Organotypic vasculature: from descriptive heterogeneity to functional pathophysiology. Science357, 2379 (2017). - PubMed
    1. Camenisch TD, Schroeder JA, Bradley J, Klewer SE, McDonald JA. Heart-valve mesenchyme formation is dependent on hyaluronan-augmented activation of ErbB2-ErbB3 receptors. Nat. Med. 2002;8:850–855. doi: 10.1038/nm742. - DOI - PubMed
    1. Dejana E, Hirschi KK, Simons M. The molecular basis of endothelial cell plasticity. Nat. Commun. 2017;8:14361. doi: 10.1038/ncomms14361. - DOI - PMC - PubMed
    1. MacGrogan D, et al. How to make a heart valve: from embryonic development to bioengineering of living valve substitutes. Cold Spring Harb. Perspect. Med. 2014;4:a013912. doi: 10.1101/cshperspect.a013912. - DOI - PMC - PubMed

Publication types

MeSH terms

Substances