. 2021 Jan 29;12(1):703.
doi: 10.1038/s41467-021-20924-y.

Bayesian data analysis reveals no preference for cardinal Tafel slopes in CO2 reduction electrocatalysis

Affiliations

Bayesian data analysis reveals no preference for cardinal Tafel slopes in CO2 reduction electrocatalysis

Aditya M Limaye et al. Nat Commun. .

Abstract

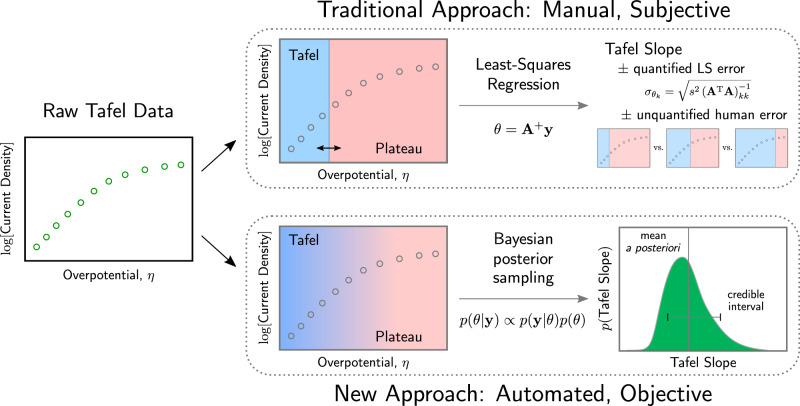
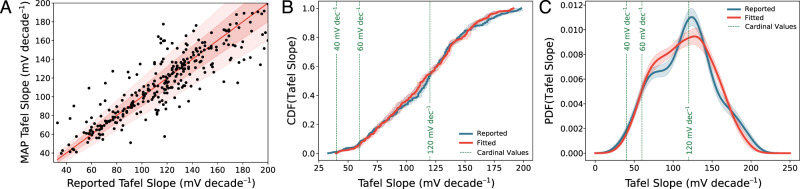
The Tafel slope is a key parameter often quoted to characterize the efficacy of an electrochemical catalyst. In this paper, we develop a Bayesian data analysis approach to estimate the Tafel slope from experimentally-measured current-voltage data. Our approach obviates the human intervention required by current literature practice for Tafel estimation, and provides robust, distributional uncertainty estimates. Using synthetic data, we illustrate how data insufficiency can unknowingly influence current fitting approaches, and how our approach allays these concerns. We apply our approach to conduct a comprehensive re-analysis of data from the CO2 reduction literature. This analysis reveals no systematic preference for Tafel slopes to cluster around certain "cardinal values" (e.g. 60 or 120 mV/decade). We hypothesize several plausible physical explanations for this observation, and discuss the implications of our finding for mechanistic analysis in electrochemical kinetic investigations.


Conflict of interest statement

The authors declare no competing interests.

Figures

Fig. 1
Fig. 1. Schematic comparison of the traditional approach to Tafel fitting and the new approach we describe in this paper.
Starting from raw current–voltage data on the left, the current literature approach begins with manual identification of a linear Tafel region on the plot. The rest of the data is discarded, and a linear fit to the Tafel region yields a Tafel slope, with an associated uncertainty corresponding to the standard error of the ordinary least-squares (OLS) estimator. In addition to this quantified uncertainty, an additional unquantified source of uncertainty arises from the manual selection of a Tafel region on the plot. The new approach described here considers all of the data in the context of a nonlinear model that smoothly interpolates between the traditional Tafel region and a plateaued region (e.g., due to mass transport limitations). Our approach uses a Monte Carlo method to sample from the Bayes posterior distribution over the parameters of the model, yielding a probabilistic distribution over Tafel slopes that are consistent with the measured data.
Fig. 2
Fig. 2. Bimodal posterior distributions signify Tafel slope ambiguity that cannot be clarified by the available data.
A (inset) Synthetic current–voltage data collected in hypothetical Experiment 1 appears linear over a 100 mV overpotential region, with a Tafel slope of 130 ± 10 mV/decade. A Synthetic current–voltage data over a broader range of overpotentials. The dashed lines show two models (I, II) with different Tafel slopes and plateau currents that could both reasonably fit the Experiment 1 data. Synthetic error bars represent one standard error of the mean of uncertainty in the synthetic data. Experiment 2A (blue triangles) and 2B (red squares) represent two possible outcomes of experiments that probe a broader range of overpotentials, which can clearly distinguish between Model I and Model II. B Bayes posterior distributions over the Tafel slope determined by our algorithm given various sets of observed data. If the algorithm is fed just the Experiment 1 data, the posterior distribution over the Tafel slope is broad and weakly bimodal, indicating that the Experiment 1 data is insufficient to discriminate between Model I and Model II. When fit to the Experiment 2A or 2B data in addition to the Experiment 1 data, this bimodality splits cleanly into two separate modes centered at the Model I and Model II Tafel slopes. Note that the Tafel slope extracted from a linear fit to just the Experiment 1 data is distinct from both the Model I and Model II Tafel slopes.
Fig. 3
Fig. 3. Unbiased refit of literature data using our Bayesian analysis approach reveals little preference for cardinal values of the Tafel slope for CO2 reduction catalysts.
A Correlation plot of reported Tafel slopes from the literature against MAP Tafel slopes fitted by our algorithm on identical data. The solid red line represents a perfect agreement, while the red filled intervals are lines representing 10% and 20% relative error. B Cumulative distribution function of the Tafel slopes reported in literature data (blue), and those refitted by our algorithm (red). Error intervals correspond to one standard deviation of bootstrapped resamples. C Kernel density estimates (KDEs) of the empirical probability distribution function of Tafel slopes reported in literature data (blue) and MAP Tafel slopes refitted by our algorithm (red). Error intervals correspond to one standard deviation of bootstrapped resamples. Green dashed lines in both (B, C) correspond to cardinal values of the Tafel slope predicted by Eq. (5).
Fig. 4
Fig. 4. Physical hypotheses for the lack of observed cardinality in literature Tafel slopes.
A Schematic of three selected physical nonidealities that can affect the measured Tafel slope. B (blue trace) Synthetic kernel density estimate of the probability distribution over Tafel slopes for a random CO2 reduction catalyst, peaked around the cardinal values predicted by Eq. (5). B (other traces) Several synthetic kernel density estimates of the probability distributions over the Tafel slope generated from including random values of different parameters governing physical nonidealities. C Schematic illustrating the possibility of measuring data across separate kinetic regimes in a Tafel analysis. Due to a switch in mechanism, different overpotential regimes exhibit different Tafel slopes, complicating interpretation of a single Tafel slope value fit straddling both regimes.

References

    1. Bard, A. J., Faulkner, L. R., Leddy, J. & Zoski, C. G. Electrochemical Methods: Fundamentals and Applications, Vol. 2 (Wiley, New York, 1980).
    1. Marshall AT. Using microkinetic models to understand electrocatalytic reactions. Curr. Opin. Electrochem. 2018;7:75–80. doi: 10.1016/j.coelec.2017.10.024. - DOI
    1. Shinagawa, T., Garcia-Esparza, A. T. & Takanabe, K. Insight on Tafel slopes from a microkinetic analysis of aqueous electrocatalysis for energy conversion. Sci. Rep. 5, 13801 (2015). - PMC - PubMed
    1. Fang Y-H, Liu Z-P. Tafel kinetics of electrocatalytic reactions: from experiment to first-principles. ACS Catal. 2014;4:4364–4376. doi: 10.1021/cs501312v. - DOI
    1. Dunwell M, Luc W, Yan Y, Jiao F, Xu B. Understanding surface-mediated electrochemical reactions: CO2 reduction and beyond. ACS Catal. 2018;8:8121–8129. doi: 10.1021/acscatal.8b02181. - DOI

Publication types

LinkOut - more resources