. 2021 Jan 29;12(1):682.
doi: 10.1038/s41467-021-20979-x.

Splicing-associated chromatin signatures: a combinatorial and position-dependent role for histone marks in splicing definition

Affiliations

Splicing-associated chromatin signatures: a combinatorial and position-dependent role for histone marks in splicing definition

E Agirre et al. Nat Commun. .

Abstract

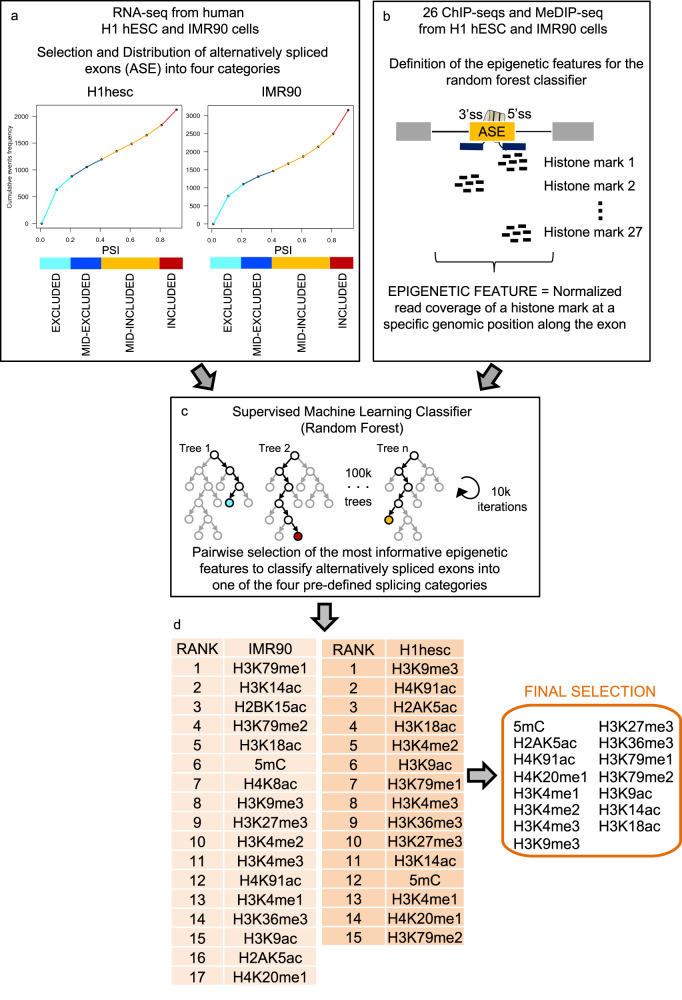
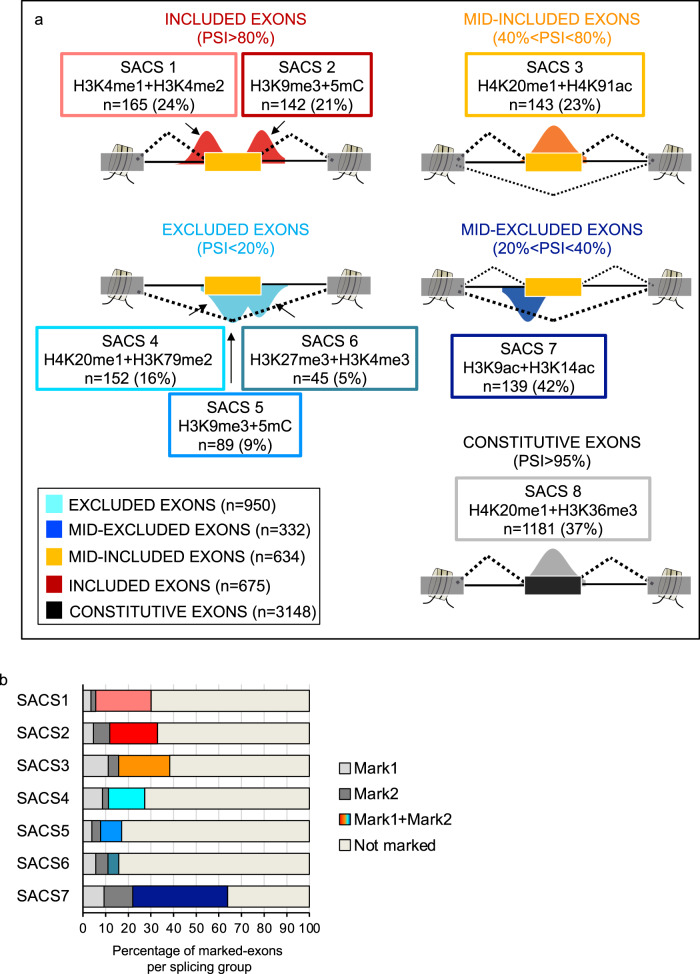
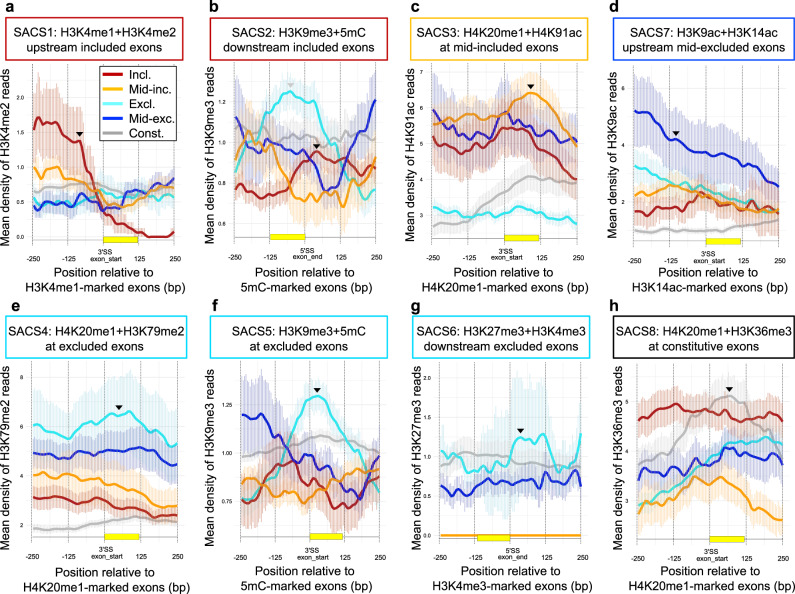
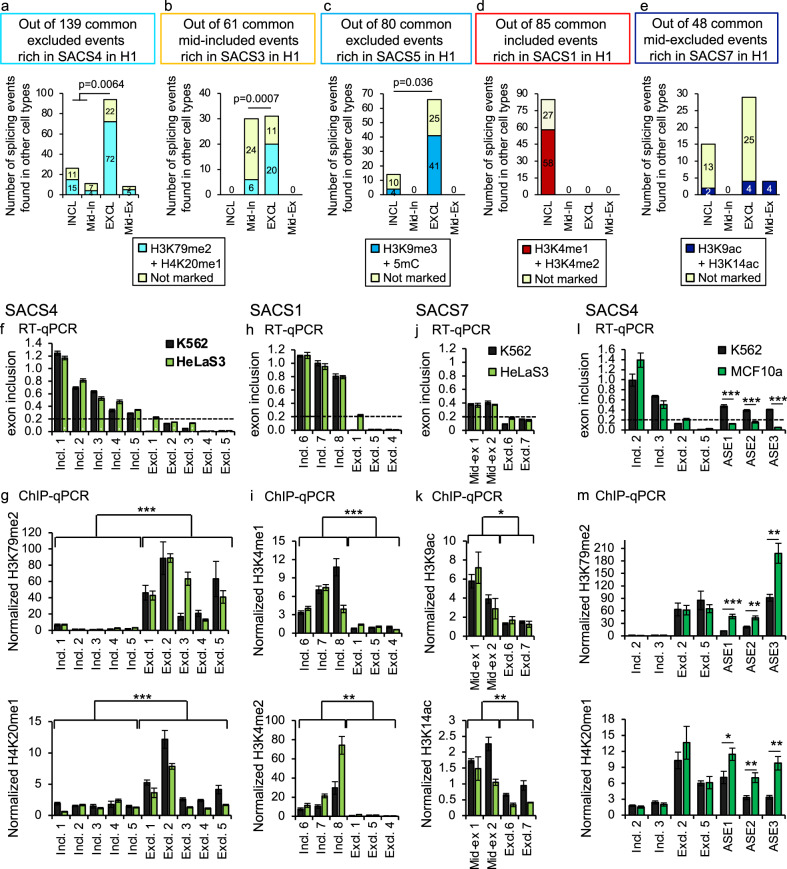
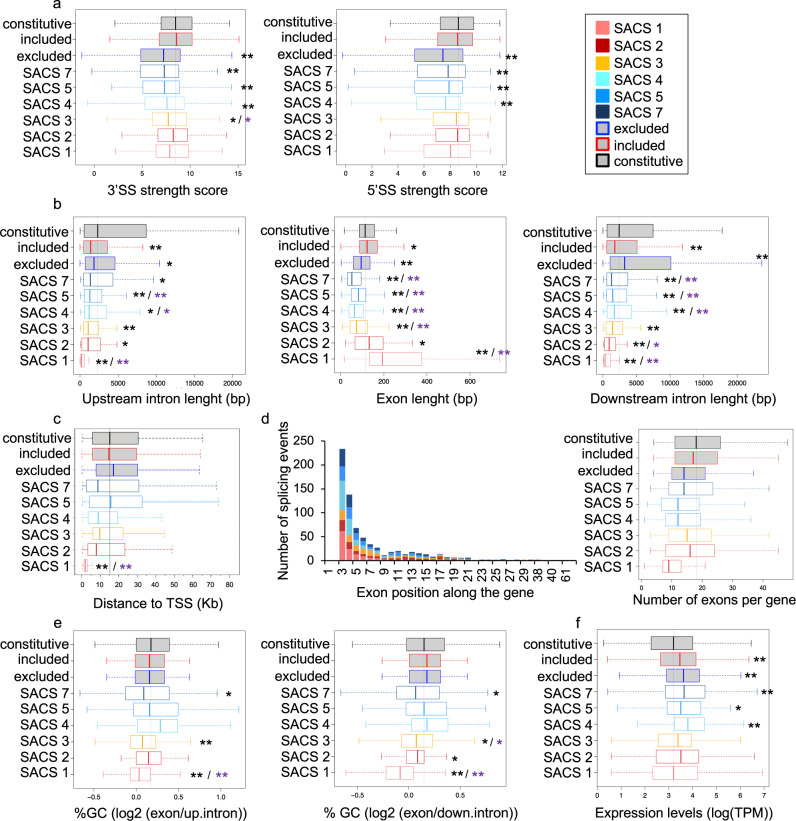
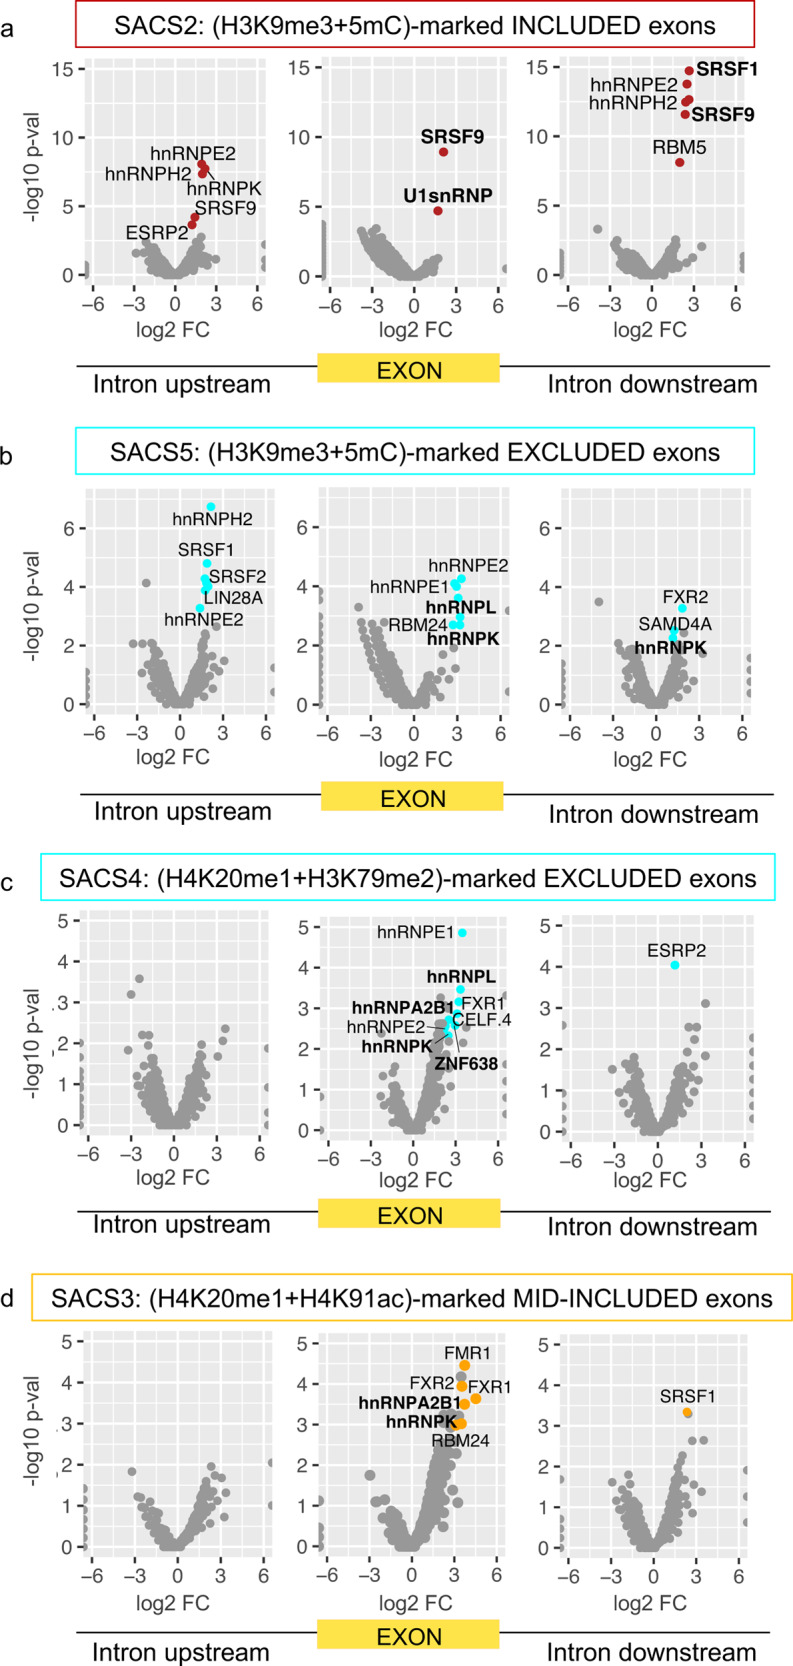
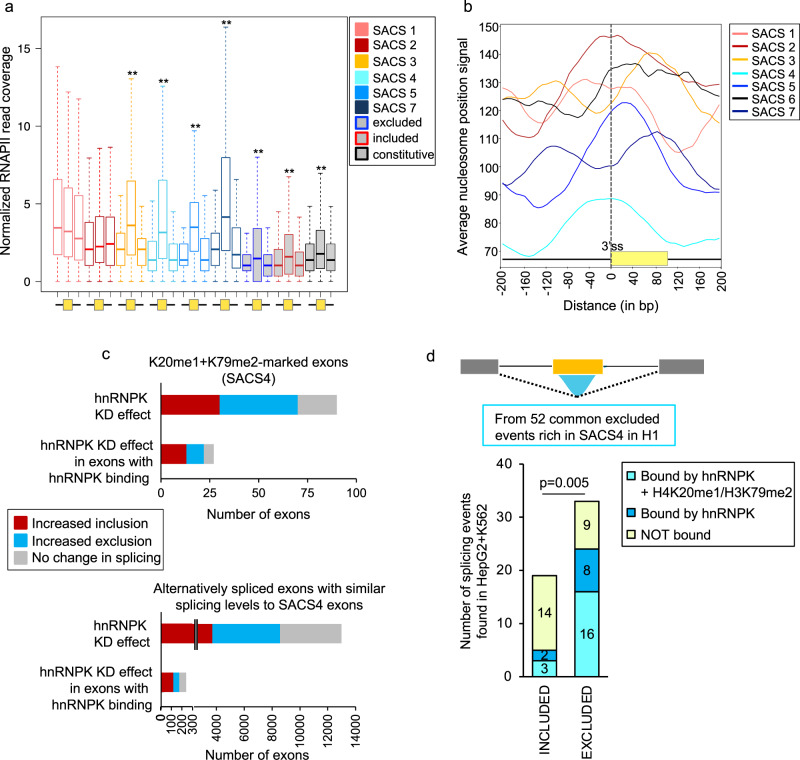
Alternative splicing relies on the combinatorial recruitment of splicing regulators to specific RNA binding sites. Chromatin has been shown to impact this recruitment. However, a limited number of histone marks have been studied at a global level. In this work, a machine learning approach, applied to extensive epigenomics datasets in human H1 embryonic stem cells and IMR90 foetal fibroblasts, has identified eleven chromatin modifications that differentially mark alternatively spliced exons depending on the level of exon inclusion. These marks act in a combinatorial and position-dependent way, creating characteristic splicing-associated chromatin signatures (SACS). In support of a functional role for SACS in coordinating splicing regulation, changes in the alternative splicing of SACS-marked exons between ten different cell lines correlate with changes in SACS enrichment levels and recruitment of the splicing regulators predicted by RNA motif search analysis. We propose the dynamic nature of chromatin modifications as a mechanism to rapidly fine-tune alternative splicing when necessary.


Conflict of interest statement

The authors declare no competing interests.

Figures

Fig. 1
Fig. 1. Schematic pipeline of the machine learning approach used to identify the chromatin modifications that can classify exons into four different splicing categories.
a Cumulative distribution of alternatively spliced exons in human H1 embryonic stem cells and IMR90 foetal fibroblasts using available RNA-seq datasets. Four arbitrary groups were created based on the percentage of exon inclusion (PSI). A colour code was given to each category, with light blue for well excluded (0 < PSI < 0.2), dark blue for mid-excluded (0.2 < PSI < 0.4), orange for mid-included (0.4 < PSI < 0.8) and red for well included (0.8 < PSI < 1) events. b The enrichment levels of 26 histone marks and DNA methylation levels around the 3′ and 5′ splice sites (ss) of alternatively spliced exons were calculated and defined as epigenetic features using available ChIP-seq and MeDIP-seq data from the ENCODE and Roadmap Epigenomics Projects. c A Random Forest classifier (with 100,000 trees and 10,000 iterations) was applied to all the binary comparisons between the four splicing categories to identify the epigenetic features that were most informative to classify the selected splicing events into the four pre-defined splicing categories in H1 and IMR90 cells. d The epigenetic features informative to classify splicing events into any of the four pre-defined splicing groups in H1 and IMR90 cells were ranked by importance. A final list of chromatin modifications found in common between the two cell lines is shown in the right. The same analyses using randomised splicing levels did not select any feature. More details of the random forest results are summarised in Supplementary Data 2.
Fig. 2
Fig. 2. Splicing-associated chromatin signatures (SACS) in H1 hESCs.
a Schematic representation of the seven combinations of chromatin modifications (SACS) that differentially mark alternatively spliced exons. As controls, we used exons with randomised splicing levels and constitutive exons, which are exons always included in the mRNA, from the same genes as the alternatively spliced exons analysed. For each SACS, we specify the splicing group it is related to, the two co-enriched histone marks, the position of enrichment along the exon (represented by a peak) and the total number (n) of exons marked by the chromatin signature (in brackets the percentage of chromatin-marked exons respect the total number of exons analysed per group). b Percentage of alternatively spliced exons marked by the two chromatin modifications defining a SACS, just one of the two marks or none.
Fig. 3
Fig. 3. Profiles of Splicing-associated Chromatin Signature (SACS).
a Density profiles of H3K4me2 reads around exons marked by H3K4me1 upstream the 3’ss exon start. b H3K9me3 reads around exons marked by 5mC downstream the 5’ss end of the exon. c H4K91ac reads around H4K20me1-marked exons. d H3K9ac reads around exons marked by H3K14ac upstream the exon start. e H3K79me2 reads around H4K20me1-marked exons. f H3K9me3 reads around 5mC-marked exons. g H3K27me3 reads around exons marked by H3K4me3 downstream the end of the exon. h H3K36me3 reads around H4K20me1-marked exons in excluded (excl., light blue), mid-excluded (mid-exc., dark blue), mid-included (mid-inc., yellow), included (incl., red) and constitutive (const., grey) exons using available ChIP-seq datasets from H1 hESCs. The average read count and ±SEM of histone marks’ reads is represented ±250 bp from either the 5′ or 3′ splice site (ss), depending on the SACS. For each mark, we highlight with a black arrow the splicing group that is the highest enriched at a specific position around the regulated exon, as defined by the SACS. Please notice that H3K9me3 + 5mC is enriched at both included (SACS2) and excluded (SACS5) exons but at different positions, this is why there are two arrows (in grey the enrichment that corresponds to the other SACS).
Fig. 4
Fig. 4. Experimental validation of SACS exons in different cell lines.
ae Number of exons marked in SACS4 (a), SACS3 (b), SACS5 (c), SACS1 (d) or SACS7 (e) in H1 that maintain or not the SACS enrichment when spliced in other cell lines in which the appropriate epigenomics data is available (details about the cell lines in Supplementary Data 1). Exons were grouped into included (Incl.), excluded (Excl.), mid-included (Mid-in.) or mid-excluded (Mid-ex.) depending on the pattern of splicing in the other cell lines analysed. Only alternatively spliced events co-expressed in H1 and any of the other cell lines are studied. p-value < 0.05 in Fisher’s exact test, two-sided. fk Experimental validation of the results obtained in silico. H3K79me2, H4K20me1, H3K4me1, H3K4me2, H3K9ac and H3K14ac enrichment levels at alternatively spliced exons that are included (Incl.), excluded (Excl.) or mid-excluded (Mid-ex) in K562 (black) and HeLa S3 (light green) cells. In f, h, j, exon inclusion levels are normalised by total expression levels of the corresponding gene. Below 0.2 (highlighted with a dotted line) the exon is considered excluded. Data is depicted as the Mean ± SEM of n = 4 independent experiments by quantitative RT-qPCR. In g, i, k the enrichment levels (% input) of the studied histone marks at the alternatively spliced exon are normalised to two control regions that remain unchanged between cell types. Data is depicted as the Mean ± SEM of at least n = 4 independent experiments by quantitative ChIP-qPCR. **p-value < 0.01, ***p-value < 10−5 (T-Test, two-sided). l, m Same as f, g, but this time three alternatively spliced events (AS) that switch exon inclusion levels between K562 (black) and MCF10a (green) are shown. Two included and two excluded events that do not change between cell types are shown as controls. *p-value < 0.05, **p-value < 0.01 and ***p-value < 0.001 (T-Test, two-sided).
Fig. 5
Fig. 5. The genetic features of chromatin-marked alternatively spliced exons (SACS).
a Box plots of the 3′ and 5′ splice site (ss) strength scores. b Box plots of exon and upstream and downstream intron lengths (in bp). c Box plot of the distance in Kb to the transcription start site (TSS). d Cumulative bar graph representing the number of splicing events at each exon position along the gene and box plot of the number of exons per gene. e Box plots of the log2 ratio of the percentage of GC content at the alternatively spliced exon respect the upstream or downstream flanking intron. f Box plot of the normalised gene expression levels, represented as log(TPM). Each chromatin-marked splicing group (SACS) has its own colour code as indicated in legend. Box plots are centred on the median with interquartile ranges of all the exons enriched in a particular SACS with SACS1 exons n = 165, SACS2 exons n = 142, SACS3 exons n = 143, SACS4 exons n = 152, SACS5 exons n = 89, SACS7 exons n = 139, non-marked excluded exons n = 600, non-marked included exons n = 600 and Constitutive exons n = 600. Constitutive exons (in grey+black) and non-marked excluded+mid-excluded (in grey+blue) and included+mid-included (in grey+red) exons are used as controls. *p-value < 0.01 and **p-value < 0.001 in Wilcoxon rank test, two-sided, compared to constitutive exons (in black) or the corresponding alternatively spliced control exons (in purple).
Fig. 6
Fig. 6. SACS are defined by specific RNA-binding protein (RBP) motifs.
ad Volcano plots of the scanned RBP motifs and 5mers in the upstream intron (left), chromatin-marked exon (middle) and downstream intron (right) for a included H3K9me3 + 5mC-marked exons (SACS2), b excluded H3K9me3 + 5mC-marked exons (SACS5), c excluded H4K20me1 + H3K79me2-marked exons (SACS4) and d mid-included H4K20me1 + H4K91ac-marked exons (SACS3). Coloured dots correspond to motifs with adjusted p-value < 0.01 and Benjamini and Hochberg false discovery rate FDR < 0.05. X axis represents the log2 fold enrichment (FC) of each motif compared to non-marked alternatively spliced events sequences. Y axis represents the −log10 adjusted p-value of the enrichment. FDR and associated adjusted p-value were calculated from n = 152 H4K20me1 + H3K79me2 excluded exons, n = 89 H3K9me3 + 5mC excluded, n = 143 H4K20me1 + H4K91ac mid-included exons, n = 142 H3K9me3 + 5mC included exons, n = 600 non chromatin-marked excluded exons and n = 600 non chromatin-marked included exons.
Fig. 7
Fig. 7. SACS can impact RNA polymerase II distribution and recruitment of splicing factors.
a Box plot centred on the median with interquartile ranges of the normalised RNA polymerase II (RNAPII) reads coverage over the upstream intron, exon and downstream intron for the chromatin-marked exons. Constitutive and non-marked excluded and included exons are used as controls (shaded in grey). RNA polymerase II is more enriched at exons than introns in all conditions except for H3K4me1 + H3K4me2 (SACS1) and H3K9me3 + 5mC (SACS2) included exons. **p-value < 0.01 at exons compared to flanking introns in Wilcoxon rank test, two-sided. SACS1 exons n = 165, SACS2 exons n = 142, SACS3 exons n = 143, SACS4 exons n = 152, SACS5 exons n = 89, SACS7 exons n = 139, non-marked excluded exons n = 600, non-marked included exons n = 600 and Constitutive exons n = 600. b Average nucleosome occupancy signal ±200 bp the exon start at the 3’ss for each SACS group. c Splicing effect on alternatively spliced exons upon hnRNPK knockdown, using available data from GM19238 cells. Only genes expressed both in H1 and GM19238 cells were studied. The number of hnRNPK-dependent events with hnRNPK binding evidence, using publicly available eCLIP data in K562 and HepG2 cells, is also shown. Exons that are more included upon hnRNPK knockdown are shown in red, more excluded are shown in blue and not affected are shown in grey. d hnRNPK binding and enrichment of H4K20me1 + H3K79me2 levels at alternatively spliced exons shifting splicing patterns in different cell lines. Using available eCLIP and ChIP-seq data in K562 and HepG2 cells, we found that from 52 excluded exons rich in H4K20me1 + H3K79me2 in H1 hESC, 33 remained excluded and 19 switched to included in K562 or HepG2. Excluded events were more co-enriched in H4K20me1 + H3K79me2 than included (Fisher’s exact test, two-sided, p-value < 0.05) and most of the (H4K20me1 + H3K79me2)-rich excluded events were bound by hnRNPK (Fisher’s exact test, two-sided, p-value < 0.05), supporting a model in which a specific chromatin signature can favour the recruitment of a splicing regulator to the pre-mRNA.

References

    1. Irimia M, Blencowe BJ. Alternative splicing: decoding an expansive regulatory layer. Curr. Opin. Cell Biol. 2012;24:323–332. doi: 10.1016/j.ceb.2012.03.005. - DOI - PubMed
    1. Wang ET, et al. Alternative isoform regulation in human tissue transcriptomes. Nature. 2008;456:470–476. doi: 10.1038/nature07509. - DOI - PMC - PubMed
    1. Wahl MC, Will CL, Luhrmann R. The spliceosome: design principles of a dynamic RNP machine. Cell. 2009;136:701–718. doi: 10.1016/j.cell.2009.02.009. - DOI - PubMed
    1. Fu XD, Ares M. Context-dependent control of alternative splicing by RNA-binding proteins. Nat. Rev. Genet. 2014;15:689–701. doi: 10.1038/nrg3778. - DOI - PMC - PubMed
    1. Busch A, Hertel KJ. Splicing predictions reliably classify different types of alternative splicing. RNA. 2015;21:813–823. doi: 10.1261/rna.048769.114. - DOI - PMC - PubMed

Publication types

LinkOut - more resources