. 2021 Jan 29;12(1):683.
doi: 10.1038/s41467-021-20982-2.

Stromal-driven and Amyloid β-dependent induction of neutrophil extracellular traps modulates tumor growth

Affiliations

Stromal-driven and Amyloid β-dependent induction of neutrophil extracellular traps modulates tumor growth

Hafsa Munir et al. Nat Commun. .

Abstract

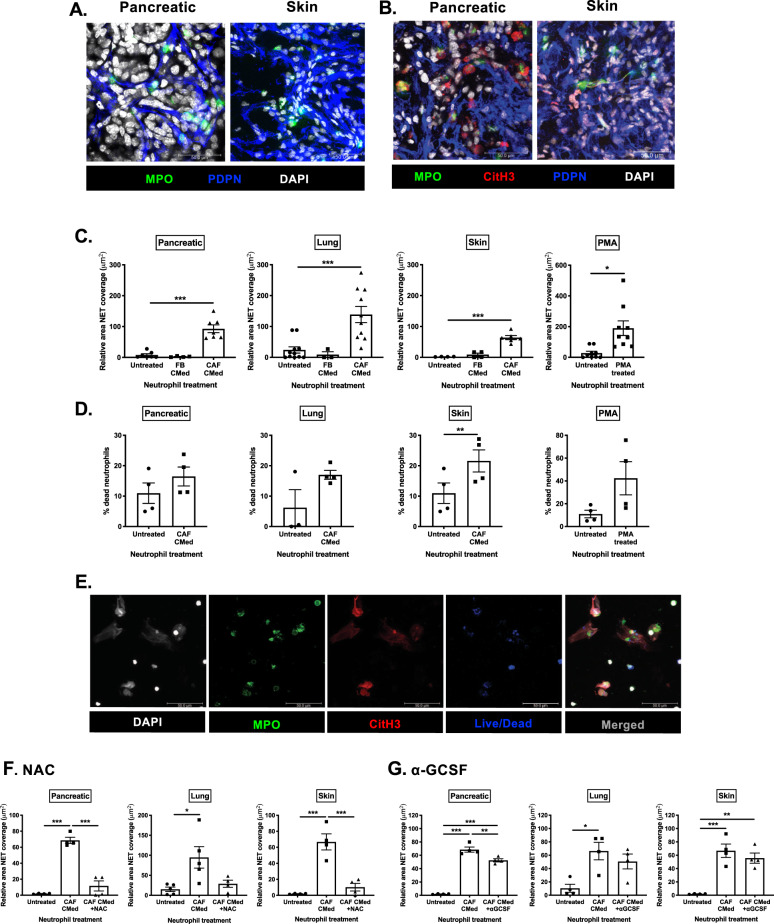
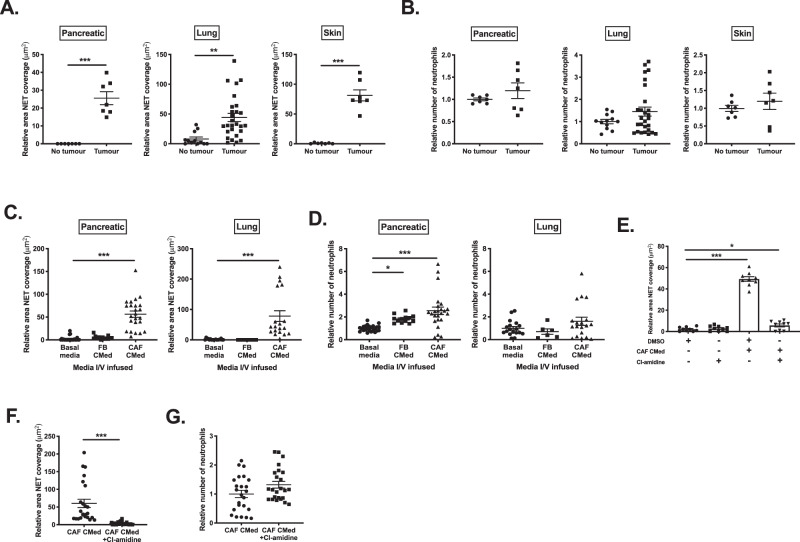
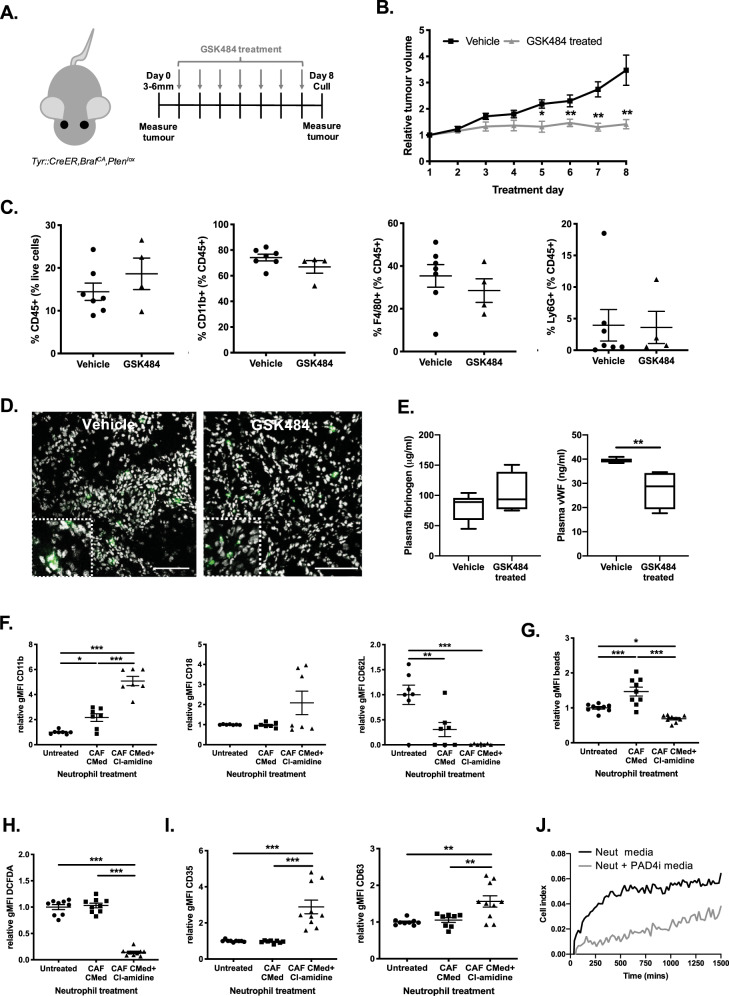
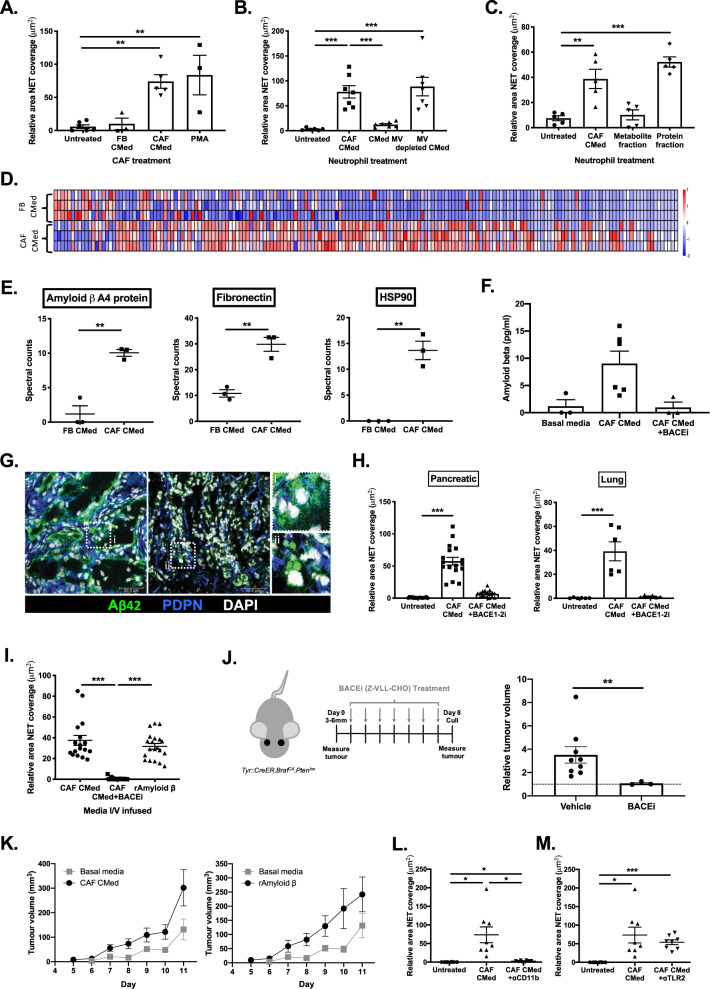
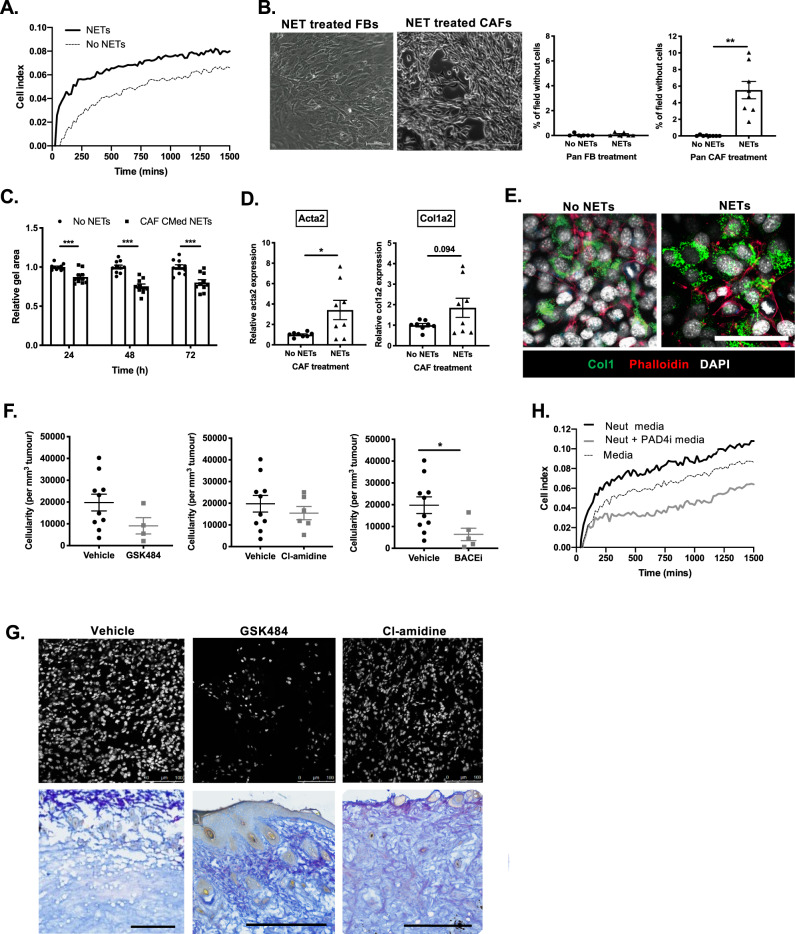
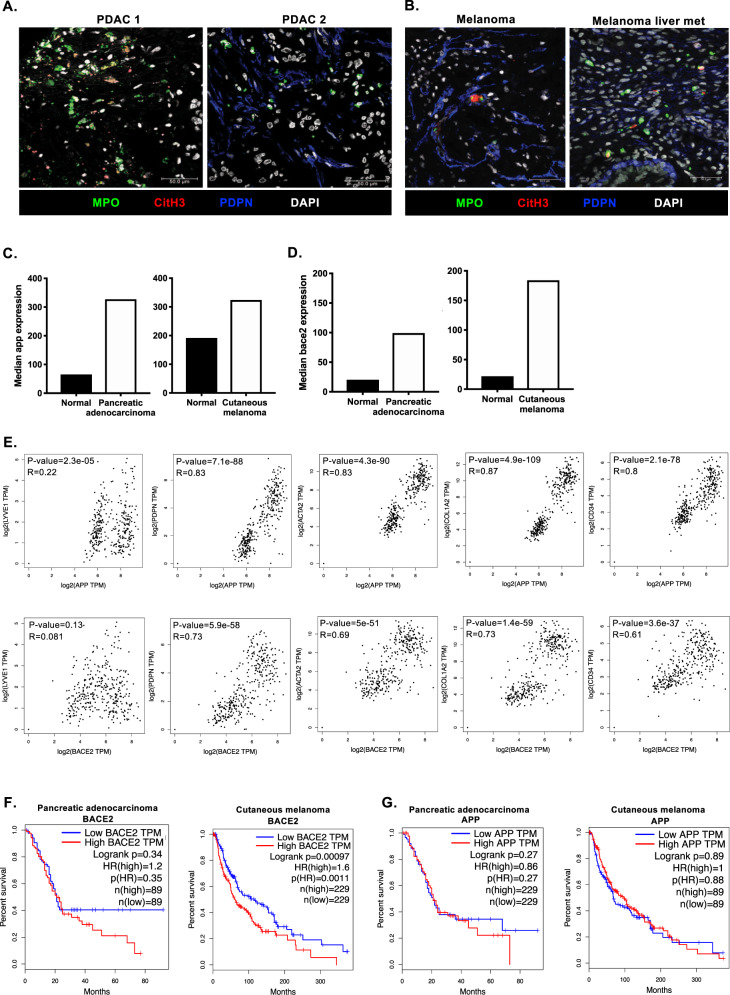
Tumors consist of cancer cells and a network of non-cancerous stroma. Cancer-associated fibroblasts (CAF) are known to support tumorigenesis, and are emerging as immune modulators. Neutrophils release histone-bound nuclear DNA and cytotoxic granules as extracellular traps (NET). Here we show that CAFs induce NET formation within the tumor and systemically in the blood and bone marrow. These tumor-induced NETs (t-NETs) are driven by a ROS-mediated pathway dependent on CAF-derived Amyloid β, a peptide implicated in both neurodegenerative and inflammatory disorders. Inhibition of NETosis in murine tumors skews neutrophils to an anti-tumor phenotype, preventing tumor growth; reciprocally, t-NETs enhance CAF activation. Mirroring observations in mice, CAFs are detected juxtaposed to NETs in human melanoma and pancreatic adenocarcinoma, and show elevated amyloid and β-Secretase expression which correlates with poor prognosis. In summary, we report that CAFs drive NETosis to support cancer progression, identifying Amyloid β as the protagonist and potential therapeutic target.


Conflict of interest statement

C.P.M. is an employee of AstraZeneca. The other authors declare no competing interests.

Figures

Fig. 1
Fig. 1. CAF-derived factors induce NETosis in vitro and in vivo.
A Confocal microscopy of myeloperoxidase (MPO) and podoplanin (PDPN) expressed on neutrophils and CAFs respectively in pancreatic, skin tumors. B Confocal microscopy of NETs in murine pancreatic, skin tumors showing expression of myeloperoxidase (MPO) and Citrullinated histone H3 (CitH3) by NETting neutrophils and podoplanin (PDPN) by CAFs. C Quantification of the area of the field covered by SYTOX green positive neutrophil-derived extracellular DNA relative to the number of neutrophils in each field after treatment with pancreatic, lung or skin FBs CMed, CAF CMed or PMA for 3 h. D The percentage of dead neutrophils after treatment with pancreatic, lung or skin CAF CMed or PMA based on the number of SYTOX green positive neutrophils. E Confocal microscopy of bone marrow neutrophils stained with MPO, CitH3 and live/dead cell viability dye after induction of NETosis by treatment with CAF CMed for 3 h. Quantification of the relative NET coverage of neutrophils treated with CAF CMed with or without pre-treatment with F N-acetyl-cysteine (NAC) or G anti-granulocyte colony-stimulating factor (α-GCSF). Data are mean ± SEM; *p < 0.05, **p < 0.01 and ***p < 0.001 using (C, F and G) one-way ANOVA with a Tukey post hoc test (with the exception of 1C, untreated vs PMA, which was performed with a paired t-test) and (D) paired t-test. Assays were performed on (AB) Representative images of n = 6 tumors, (C) n = 7, 4 and 7 (Pancreatic for unstimulated, FB CMed and CAF CMed treated, respectively), n = 11, 3 and 10 (Lung for unstimulated, FB CMed and CAF CMed treated, respectively), n = 4, 4 and 6 (Skin for unstimulated, FB CMed and CAF CMed treated, respectively) and n = 9 (PMA), (D) n = 4, (E) n = 2, F n = 4 (Pancreatic and Skin) n = 5 (Lung) and (G) n = 4 independent experiments. Scale bars are 50 µm.
Fig. 2
Fig. 2. CAF-derived factors drive NETosis systemically.
Quantification of A relative NET coverage and B relative number of bone marrow neutrophils taken from mice with pancreatic, lung or skin tumors. Quantification of the C relative NET coverage and D relative number of bone marrow neutrophils isolated from wild-type mice intravenously infused with pancreatic or lung FB or CAF CMed 24 h before analysing NETosis. E Quantification of relative NET coverage after stimulation with pancreatic CAF CMed with or without treatment with Cl-amidine in vitro. F Quantification of the relative NET coverage and G relative number of bone marrow neutrophils isolated from mice intravenously infused with lung CAF CMed with or without pre-treatment with Cl-amidine for 24 h. Data are mean ± SEM; *p < 0.05, **p < 0.01 and ***p < 0.001 using (A and F) paired t-test and CE one-way ANOVA with a Dunnett post hoc test. Assays were performed on AB n = 4 (in duplicate), n = 7 (in quadruplet) and n = 7 for pancreatic, lung and skin tumor-bearing mice respectively, CD n = 8, 4 and 8 (Pancreatic for basal media, FB CMed and CAF CMed treatment, respectively. All performed in triplicate) and n = 9, 6 and 9 (Lung for basal media, FB CMed and CAF CMed treated, respectively. Performed in duplicate for basal media and CAF CMed and only a single time for FB CMed treated), E n = 3 (in triplicate) and FG n = 8 (in triplicate) independent experiments.
Fig. 3
Fig. 3. Inhibiting t-NETosis stops tumor growth in vivo.
A Schematic of GSK484 treatment regime of skin tumor-bearing mice. B Relative volume of skin tumors on mice treated with vehicle or GSK484 over 8d. C Flow cytometric analysis of the percentage immune cells (CD45+), myeloid cells (CD11b+), macrophages (F4/80+) and neutrophils (Ly6G+) in the tumor. D Representative confocal images showing neutrophils (myeloperoxidase (MPO) in green) within the tumor in control or treated animals (zoomed inset). Nuclei counterstained with DAPI (white). E The levels of clotting factors (fibrinogen and von Willebrand factor; vWF) in the plasma of skin tumor-bearing mice treated with vehicle or GSK484. F Quantification of CD11b, CD18 and CD62L expression on wild-type bone marrow-derived neutrophils after 3-h treatment with pancreatic CAF CMed, with and without Cl-amidine, in vitro by flow cytometry. G The phagocytic capacity of wild-type bone marrow-derived neutrophils after 3-h pancreatic CAF CMed, with and without Cl-amidine, treatment based on uptake of fluorescent 1 µm beads in vitro assessed by flow cytometry. H Quantification of ROS production by wild-type bone marrow-derived neutrophils after 3-h treatment with pancreatic CAF CMed, with and without Cl-amidine, in vitro based on the levels of DCFDA by flow cytometry. I Quantification of neutrophil degranulation based on CD35 and CD63 expression by flow cytometry after 3-h pancreatic CAF CMed, with and without Cl-amidine for 3 h. J Representative plot illustrating tumor cell growth following treatment with neutrophil-derived media with and without PAD4i treatment. Bar graphs are mean ± SEM; *p < 0.05, **p < 0.01 and ***p < 0.001 using B a Mann–Whitney test comparing vehicle and GSK484 at each time point, E a Mann–Whitney test and FI a one-way ANOVA with a Tukey post hoc test. Box and whiskers graph-line: median, box: upper and lower quartiles, whiskers: maxima and minima. Assays were performed on male and female, 8–24-wk-old mice B n = 8 (Vehicle) and n = 7 (GSK484), C n = 7 (Vehicle) and n = 4 (GSK484), D Representative images of n-4 (Vehicle) and n = 6 (GSK484) tumors, E n = 6 (Vehicle) and n = 4 (GSK484) for Fibrinogen and n = 7 (Vehicle) and n = 4 for vWF, F n = 3 (in triplicate or single) G n = 3 (in triplicate) H n = 3 (in triplicate) I n = 3 (in triplicate) and J Representative of n = 2 (in duplicate) independent experiments. Scale bars are 100 µm.
Fig. 4
Fig. 4. Amyloid β is the driver of CAF-induced t-NETosis.
A Quantification of the relative NET coverage of neutrophils that were added to lung CAFs treated with or without FB CMed, CAF CMed or PMA for 3 h. B Quantification of the relative NET coverage of neutrophils treated with lung CAF CMed or CAF CMed-derived microvesicles (MV) or CMed depleted of MV. C Quantification of the relative NET coverage of neutrophils treated with lung CAF CMed or the metabolite or protein fractions of the CAF CMed. D Differentially secreted proteins in pancreatic FB and CAF CMed analyzed by mass spectrometry. The relative intensity of each protein is indicated by the colored bar under the heatmap. E Spectral counts for NET-related factors secreted by pancreatic FBs and CAFs. F Levels of Amyloid β in basal media and pancreatic CAF CMed generated in the presence or absence of an inhibitor of amyloid-beta secretion (BACEi). G Confocal microscopy of amyloid precursor protein (APP) and Podoplanin (PDPN) expressed by CAFs in pancreatic tumors. Insets depict diffuse vs. aggregated patterns of APP/Amyloid β distribution. H Quantification of the relative NET coverage of neutrophils treated with pancreatic and lung CAF CMed generated with or without 24-h pre-treatment of the CAFs with a β-secretase 1 and 2 (BACE1-2) inhibitor. I Quantification of the relative NET coverage of bone marrow neutrophils taken from wild-type mice intravenously infused with pancreatic CAF CMed taken from cells treated with or without BACE1-2 inhibitor for 24 h or recombinant Amyloid β. J Schematic of BACEi treatment regime of skin tumor-bearing mice and relative endpoint volume of skin tumors (calculated relative to the volume of each tumor at the start of treatment—indicated by dotted line on the graph) on mice after treatment with vehicle or BACEi (Z-VLL-CHO). K Growth of orthotopically implanted B16.F10 tumor cells with vehicle, CAF CMed or recombinant Amyloid β treatment. Quantification of the relative NET coverage after 3-h treatment with pancreatic CAF CMed with or without L CD11b or M TLR2 blocking antibodies. Data are mean ±  SEM; **p < 0.01 and ***p < 0.001 using (A and H) one-way ANOVA with a Dunnett post hoc test, BC, I and LM one-way ANOVA with a Tukey post hoc test and J a Mann–Whitney test. Assays were performed on A n = 6 (Untreated and CAF CMed treated) n = 3 (PMA and FB CMed treated), B n = 7, C n = 5, (E) n = 3, F n = 3–6, G Representative images of n = 3 tumors, H n = 6 (in triplicate), I n = 7 (in duplicate or triplicate), J n = 9 (Vehicle) and n = 3 (BACEi) male and female, 8–24-wk-old mice, K n = 6 8-wk-old female C57BL/6 mice and LM n = 3 (in triplicate) independent experiments. Scale bars are 50 µm.
Fig. 5
Fig. 5. t-NETs induce CAF activation.
A Representative plot illustrating growth of CAFs in the presence of vehicle or micrococcal nuclease detached NETs. B Phase contrast images and respective quantification of the percentage area of cell free space per field after treatment of pancreatic FBs or CAFs with NETs derived from CAF CMed treated neutrophils for 24 h. (C) Quantification of the size of collagen gels 24, 48, and 72 h after seeding pancreatic CAFs treated with or without NETs derived from CAF CMed treated neutrophils for 24 h. D Expression of Acta2 and Col1a2 at the gene level in pancreatic CAFs treated with or without NETs derived from CAF CMed treated neutrophils for 24 h. E Confocal microscopy of Collagen1 and phalloidin on pancreatic CAFs treated with or without NETs derived from unstimulated neutrophils or CAF CMed treated neutrophils for 24 h. F Cellularity of melanoma after treatment with GSK484, Cl-amidine, BACEi or vehicle expressed as cells per unit volume. G Representative confocal image of nuclei and collagen after treatment with GSK484, Cl-amidine, or vehicle. Tissues stained with Herovici stain to demark new collagen (blue) vs. mature collagen (pink). H Representative plot illustrating growth of CAFs following treatment with CAF CMed or CAF CMed and PAD4i-treated neutrophil-derived media. Bar graphs are mean ± SEM; *p < 0.05 and ***p < 0.001 using BD a paired t-test and F a Mann–Whitney test. Box and whiskers graph-line: median, box: upper and lower quartiles, whiskers: maxima and minima. Assays were performed on (A and H) Representative of n = 2 (in duplicate), B n = 3 (in triplicate), C n = 3 (in duplicate or quadruple), D n = 4 (in duplicate), E Representative images of n = 3 samples, F n = 5–10 male and female, 8–24-wk-old mice, and G Representative images of n = 5 (Vehicle) and n = 5 (GSK484 and Cl-amidine) independent experiments. Scale bars are 50 µm (B and E), 500 µm (G upper panel) and 100 µm (G upper panel).
Fig. 6
Fig. 6. Conservation of t-NETs in human disease.
A Representative confocal images of NETting neutrophils and CAFs in human pancreatic tumor biopsies (MPO, green; CitH3, red; podoplanin, blue; DAPI, white). B Representative confocal images of NETting neutrophils and CAFs in human melanoma primary tumor and metastasis samples (MPO, green; CitH3, red; podoplanin, blue; DAPI, white). C Median expression of app in human pancreatic adenocarcinoma and cutaneous melanoma compared to normal tissue from healthy donors and D Median expression of bace2 in human pancreatic adenocarcinoma and cutaneous melanoma compared to normal tissue from healthy donors (GTEx and TCGA datasets). E Correlation of app and bace2 with a lymphatic marker (lyve1) and CAF markers (pdpn, acta2, col1a2 and cd34). Kaplin–Meier curves showing overall survival of pancreatic adenocarcinoma and cutaneous melanoma patients correlated with high and low expression of (F) bace2 or (G) app. (A) Representative images of at least n = 3 tumors. Scale bars are 50 µm.

References

    1. Valkenburg KC, de Groot AE, Pienta KJ. Targeting the tumour stroma to improve cancer therapy. Nat. Rev. Clin. Oncol. 2018;15:366–381. doi: 10.1038/s41571-018-0007-1. - DOI - PMC - PubMed
    1. Feig C, et al. Targeting CXCL12 from FAP-expressing carcinoma- associated fibroblasts synergizes with anti – PD-L1 immunotherapy in pancreatic cancer. Proc. Natl Acad. Sci. USA. 2013;110:20212–20217. doi: 10.1073/pnas.1320318110. - DOI - PMC - PubMed
    1. Shields JD, Kourtis IC, Tomei AA, Roberts JM, Swartz MA. Induction of lymphoidlike stroma and express the chemokine CCL21. Science. 2010;328:749–753. doi: 10.1126/science.1185837. - DOI - PubMed
    1. Harper J, Sainson RCA. Regulation of the anti-tumour immune response by cancer-associated fibroblasts. Semin. Cancer Biol. 2014;25:69–77. doi: 10.1016/j.semcancer.2013.12.005. - DOI - PubMed
    1. Lakins, M. A., Ghorani, E., Munir, H., Martins, C. P. & Shields, J. D. Cancer-associated fibroblasts induce antigen-specific deletion of CD8+ T cells to protect tumour cells. Nat. Commun. 9, 948 (2018). - PMC - PubMed

Publication types

MeSH terms

Substances