. 2021 Jan 29;4(1):142.
doi: 10.1038/s42003-021-01663-8.

The level of oncogenic Ras determines the malignant transformation of Lkb1 mutant tissue in vivo

Affiliations

The level of oncogenic Ras determines the malignant transformation of Lkb1 mutant tissue in vivo

Briana Rackley et al. Commun Biol. .

Abstract

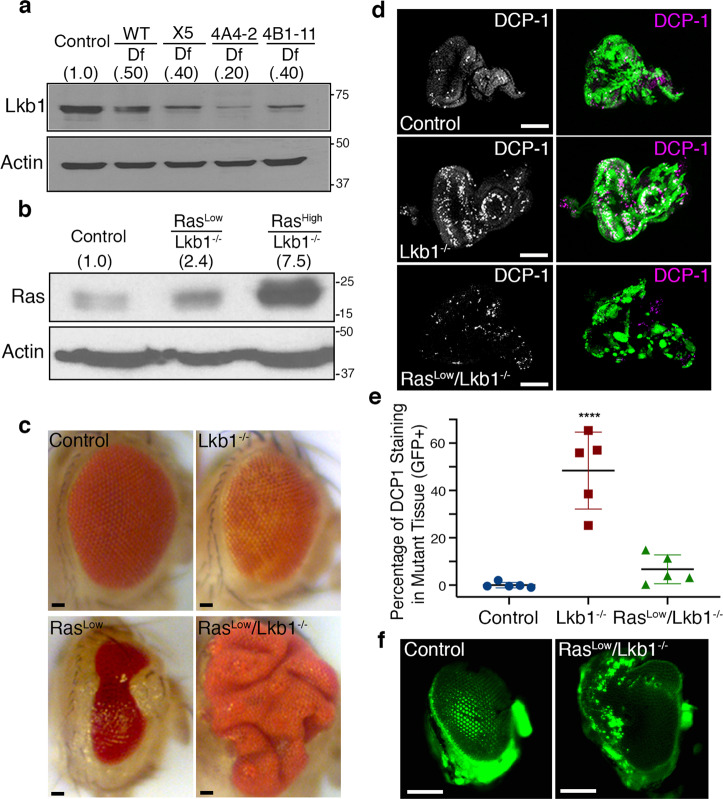
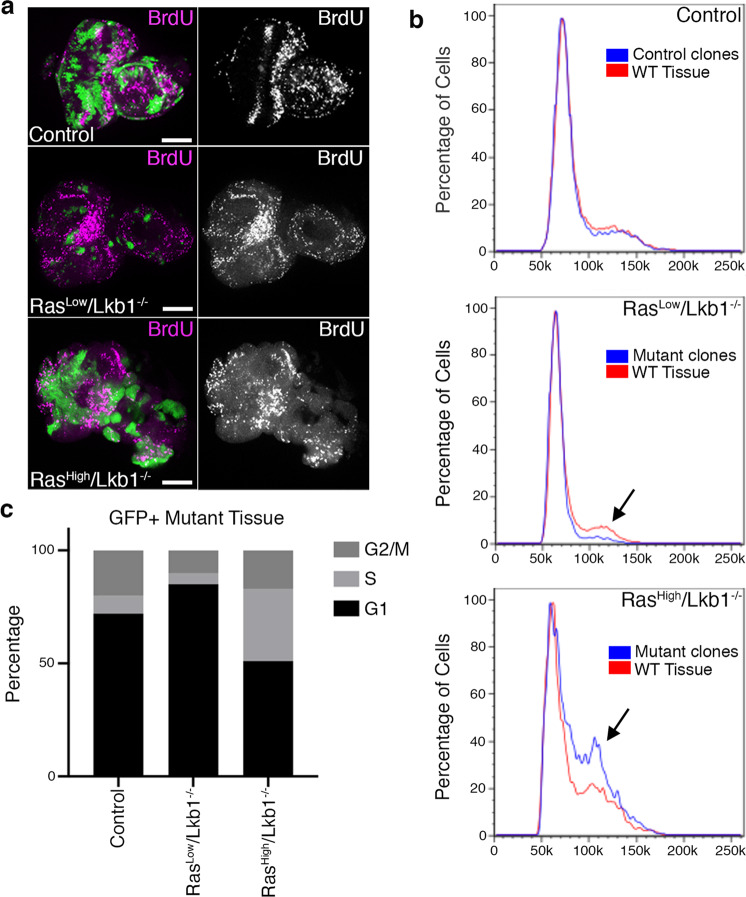
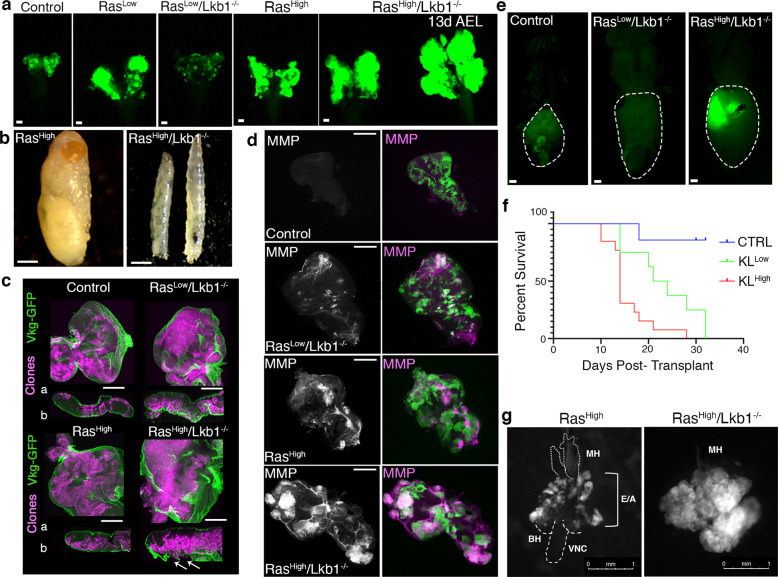
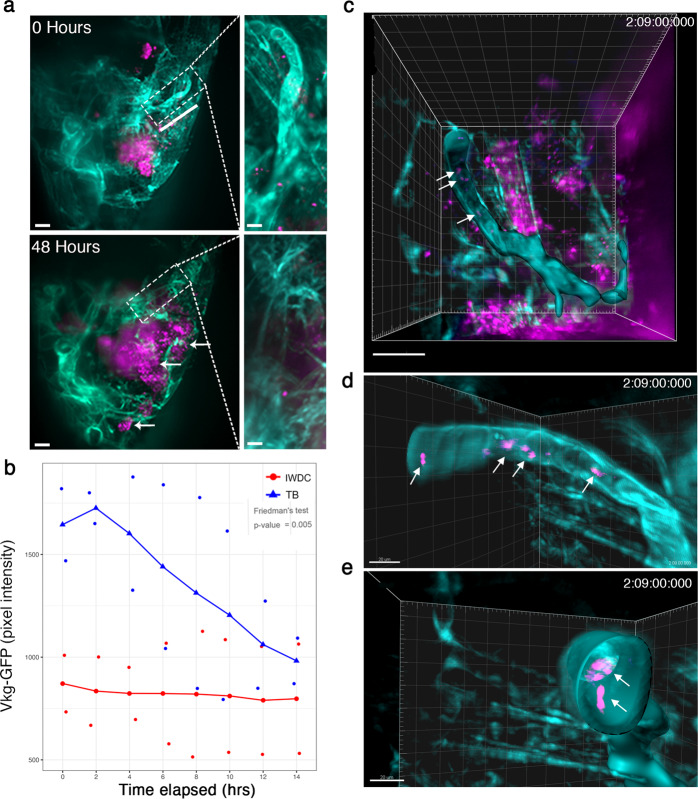
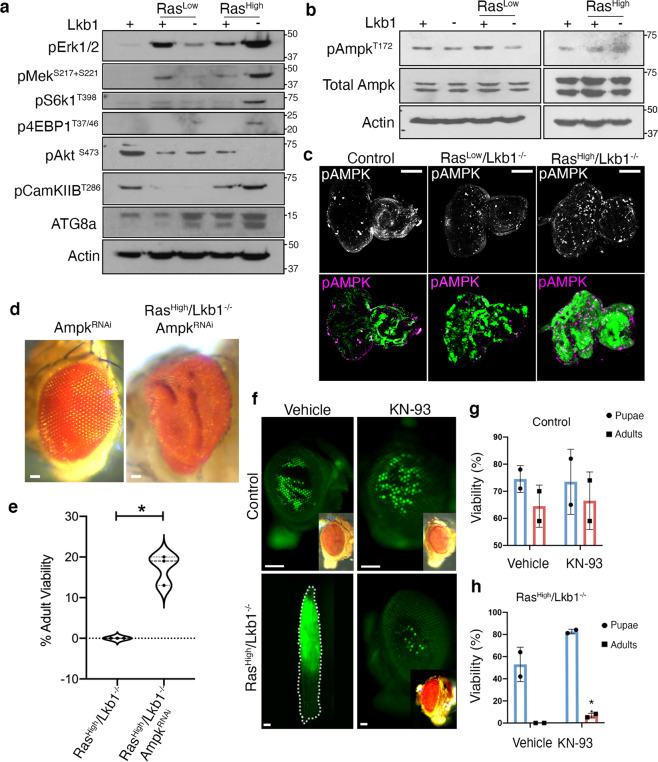
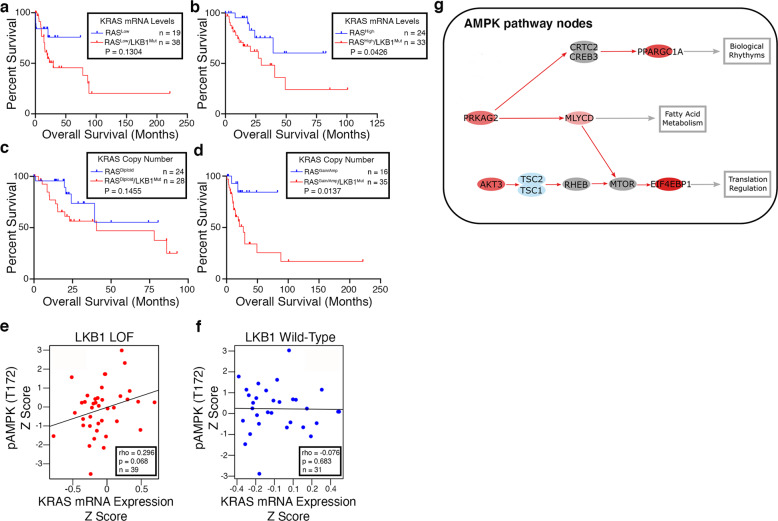
The genetic and metabolic heterogeneity of RAS-driven cancers has confounded therapeutic strategies in the clinic. To address this, rapid and genetically tractable animal models are needed that recapitulate the heterogeneity of RAS-driven cancers in vivo. Here, we generate a Drosophila melanogaster model of Ras/Lkb1 mutant carcinoma. We show that low-level expression of oncogenic Ras (RasLow) promotes the survival of Lkb1 mutant tissue, but results in autonomous cell cycle arrest and non-autonomous overgrowth of wild-type tissue. In contrast, high-level expression of oncogenic Ras (RasHigh) transforms Lkb1 mutant tissue resulting in lethal malignant tumors. Using simultaneous multiview light-sheet microcopy, we have characterized invasion phenotypes of Ras/Lkb1 tumors in living larvae. Our molecular analysis reveals sustained activation of the AMPK pathway in malignant Ras/Lkb1 tumors, and demonstrate the genetic and pharmacologic dependence of these tumors on CaMK-activated Ampk. We further show that LKB1 mutant human lung adenocarcinoma patients with high levels of oncogenic KRAS exhibit worse overall survival and increased AMPK activation. Our results suggest that high levels of oncogenic KRAS is a driving event in the malignant transformation of LKB1 mutant tissue, and uncovers a vulnerability that may be used to target this aggressive genetic subset of RAS-driven tumors.


Conflict of interest statement

The authors declare no competing interests.

Figures

Fig. 1
Fig. 1. Clonal loss of Lkb1 in vivo results in autonomous cell death.
a Western analysis of Lkb1 protein in larvae transheterozygous for a deletion (Df(3R)Exel6169) that removes the Lkb1 gene, and either a wild-type third chromosome or three loss-of-function alleles of Lkb1 (X5, 4A4-2, 4B1-11). b Western analysis of Ras levels in mosaic eye-imaginal disks from the indicated genotypes (control = FRT82B). Note the Ras antibody detects both endogenous and oncogenic Ras. c Representative brightfield images of mosaic adult eyes with clones of the indicated genotypes. Scale bar, 20 µm. d Confocal maximum intensity projections of third instar mosaic eye discs carrying GFP-tagged clones of the indicated genotypes, and stained for endogenous death caspase 1 (DCP1, magenta). Scale bar, 100 µm. e Percentage of DCP1 staining in GFP-positive mutant tissue was quantified from n = 5 imaginal discs per condition using thresholding in FIJI (ImageJ). Data are represented as mean with error bars representing standard deviation (****p = 0.000006, one-way ANOVA with multiple comparisons). f Fluorescent images of adult eyes carrying GFP-labeled clones of the indicated genotypes. Images are representative of n = 10 independent flies per genotype. Scale bar, 100 µm.
Fig. 2
Fig. 2. The level of oncogenic Ras determines distinct autonomous vs. non-autonomous cell-cycle phenotypes in Lkb1 mutant tissue.
a Confocal images of mosaic eye-imaginal discs carrying GFP+ clones of the indicated genotypes (control = FRT82B), and stained for BrdU incorporation (magenta). Images are representative of n = 10 independent eye-imaginal discs per genotype. Scale bar, 100 µm. b Fluorescence-activated cell sorting (FACS) analysis of mosaic eye-imaginal discs with GFP-labeled clones of the indicated genotypes. Black arrows point to shifts in relative cell-cycle phasing. Analysis is representative of n = 3 independent experiments of 20 mutant imaginal discs/genotype and 40 imaginal discs/genotype for control. c Histogram showing percentage of GFP-labeled control or mutant cells in each phase of the cell cycle.
Fig. 3
Fig. 3. Oncogenic RasHigh promotes the malignant transformation of Lkb1 mutant tissue.
a Fluorescent images of 3rd instar larval eye-imaginal discs (exception labeled ‘13d AEL’) carrying GFP+ clones of the indicated genotypes (control = FRT82B). Images are representative of n = 10 independent eye-imaginal discs per genotype. Scale bar, 20 µm. AEL = after egg-lay. The stage ‘13 days AEL’ is indicative of a larva that failed to pupate at day ~5d AEL, and is a classic neoplastic phenotype. b Representative brightfield image of the lethal stage of a fly carrying RasHigh clones (left) and RasHigh/Lkb1−/− clones (right). Note that both age-matched third instar and giant larvae are shown for the RasHigh/Lkb1−/− genotype. c Confocal images of eye-imaginal discs carrying RFP+ clones (magenta) of the indicated genotypes and expressing type IV collagen-GFP (Vkg-GFP). White arrow indicates breaks in Vkg-GFP. a = apical, b = basal. Images are representative of n = 5 independent eye-imaginal discs per genotype. Scale bar, 100 µm. d Confocal images of third instar eye discs carrying GFP+ clones of the indicated genotypes, and stained for matrix metalloproteinase 1 (MMP1, magenta in overalay). Images are representative of n = 10 independent eye-imaginal discs per genotype. Scale bar, 100 µm. e Fluorescent images of w1118 adult virgin female hosts carrying transplanted allografts of 3rd instar eye-imaginal discs with GFP+ clones of the indicated genotypes. Scale bar, 100 µm. f Quantification of survival post-transplant in allograft assay. Survival was measured from 7 days post-transplant to time of death. CTRL (FRT82B, n = 7), KLLow (RasLow/Lkb1−/−, n = 8), and KLHigh (RasHigh/Lkb1−/−, n = 13) (CTRL-KLLow, **p = 0.0030, CTRL-KLHigh, ***p = 0.0001, KLLow- KLHigh, *p = 0.0129, Log-rank test). g Representative fluorescent images of dissected cephalic complexes and ventral nerve cord (VNC) from larvae carrying GFP+ clones (white) of the indicated genotypes. BH = brain hemispheres; E/A = eye/antennal discs, MH = mouth hooks. The RasHigh/Lkb1−/− tissue completely invades and obscures contiguous organs. Scale bar, 1 mm. Images are representative of n = 10 cephalic complexes/genotype.
Fig. 4
Fig. 4. SiMView light-sheet microscopy allows visualization of collagen IV degradation by tumor cells over time.
a Maximum intensity projection from a 48 h SiMView imaging session on the anterior end of a RasHigh/Lkb1−/− tumor-bearing ‘giant’ larva (13 days AEL). Mutant cells express RFP (magenta) and Vkg-GFP (collagen IV-GFP, teal) is expressed throughout the organism. Scale bar, 20 µm. White dashed box is a representative region of interest (ROI, tracheal branch) and is magnified in the panels on the right. Scale bar, 300 µm. White arrows indicate RFP-positive RasHigh/Lkb1−/− cells that have invaded dorsally. b The effect of tracheal branch (TB; blue) vs. internal wing disc control (IWDC; red) groups on Viking-GFP pixel intensity on time elapsed. The group effect was measured using Friedman’s test. c An Imaris Surface object of Vkg-GFP (teal) was generated from the ROI (above) using min and max thresholds of 250 and 385, respectively. White arrows indicate RFP-positive tumor cells (magenta) that appear embedded within the tracheal collagen matrix. d, e Zoom and rotated data channels were duplicated with voxels outside the Imaris object set to 0 in order to allow for better visualization with a maximum intensity projection view and clipping plane to show presence of RFP-positive cells within the tracheal matrix. Scale bar, 20 µm.
Fig. 5
Fig. 5. Neoplastic RasHigh/Lkb1−/− tumors depend on the genetic dose of ampk and are targetable with a CaMK inhibitor.
a Western analysis to assay activation of the indicated molecular pathways in mosaic larval eye-imaginal discs of the indicated genotypes. b Western analysis of Ampk activation from mosaic larval eye-imaginal discs of the indicated genotypes. c Confocal images of eye-imaginal discs carrying GFP+ clones of the indicated genotypes (control = FRT82B), and stained for phosphorylated Ampk. Images are representative of n = 10 independent eye-imaginal discs per genotype. Scale bar, 100 µm. d Representative brightfield images of adult eyes carrying clones of the indicated genotypes. e Violin plot showing % adult viability from the RasHigh/Lkb1−/− (n = 204) and RasHigh/Lkb1−/−/ampkRNAi (n = 139) genotypes from three independent experiments, *p-value = 0.0155 using a Welch’s t-test. Dashed line represents the median, dotted lines represent the upper and lower quartiles. f Representative fluorescent and brightfield (inset) images of either flies carrying control (FRT82B) or GFP+ RasHigh/Lkb1−/− clones that were pharmacologically treated with vehicle or the pan CaMK inhibiter KN-93 (5 µM) as 1st instar larvae. Scale bars, 100 µm. g, h The percent survival to pupal and adult stages was quantified for control (FRT82B) and RasHigh/Lkb1−/− vehicle and KN-93 treated larvae. Data are represented as mean percent survival with error bars representing standard deviation. n = 50 biologically independent animals/genotype/condition/2 independent experiments. *p-value = 0.0493 computed from Unpaired t-test.
Fig. 6
Fig. 6. High levels of oncogenic KRAS drive decreased patient survival and is associated with AMPK activation in LKB1 mutant patients.
a, b Analysis of patient survival using the TCGA Pan Lung Cancer study. Kaplan–Meier plots stratified by KRASLow (a) or KRASHigh (b) using oncogenic (codon 12) KRAS mRNA expression and further stratified based on LKB1 deletion and loss-of-function mutation status. c, d Analysis of patient survival using the TCGA Pan Lung Cancer study. Kaplan–Meier plots stratified by KRASLow or KRASHigh using oncogenic (codon 12) KRAS copy number data and further stratified based on LKB1 deletion and loss-of-function mutation status. e, f Analysis of phosphorylated AMPK (T172) expression as it correlates with KRAS mRNA expression and LKB1 mutation status. g Canonical circuit activity analysis was used to estimate the activity of AMPK signaling pathway (hsa04152) that result in functional cell activities. Red color represents significantly (p < 0.05) upregulated genes (or paths) in KRASHigh/LKB1Mut lung adenocarcinoma patients with respect to KRASHigh patients, and blue represents downregulated genes (or paths). The activity of three effector circuits is significantly (FDR < 0.05) upregulated in KRASHigh/LKB1Mut patients, one ending in the node that contains the protein PPARGC1A (p = 0.005; FDR = 0.037; Uniprot function Biological rhythms/Mitochondrial biogenesis), the second one ending in the node with the MLYCD protein (p = 0.0064; FDR = 0.045; Uniprot function Fatty acid metabolism), and the third ending in the node containing EIF4EBP1 (p = 0.001; FDR = 0.013; Uniprot function Translation regulation).

References

    1. Ryan MB, Corcoran RB. Therapeutic strategies to target RAS-mutant cancers. Nat. Rev. Clin. Oncol. 2018;15:709–720. doi: 10.1038/s41571-018-0105-0. - DOI - PubMed
    1. Skoulidis F, Heymach JV. Co-occurring genomic alterations in non-small-cell lung cancer biology and therapy. Nat. Rev. Cancer. 2019;19:495–509. doi: 10.1038/s41568-019-0179-8. - DOI - PMC - PubMed
    1. Kerr EM, Martins CP. Metabolic rewiring in mutant Kras lung cancer. FEBS J. 2018;285:28–41. doi: 10.1111/febs.14125. - DOI - PMC - PubMed
    1. Cairns RA, Harris IS, Mak TW. Regulation of cancer cell metabolism. Nat. Rev. Cancer. 2011;11:85–95. doi: 10.1038/nrc2981. - DOI - PubMed
    1. Momcilovic M, Shackelford DB. Targeting LKB1 in cancer—exposing and exploiting vulnerabilities. Br. J. Cancer. 2015;113:574–584. doi: 10.1038/bjc.2015.261. - DOI - PMC - PubMed

Publication types

MeSH terms

Substances

LinkOut - more resources