. 2021 Jan 29;4(1):145.
doi: 10.1038/s42003-021-01667-4.

Plexin-B2 facilitates glioblastoma infiltration by modulating cell biomechanics

Affiliations

Plexin-B2 facilitates glioblastoma infiltration by modulating cell biomechanics

Yong Huang et al. Commun Biol. .

Abstract

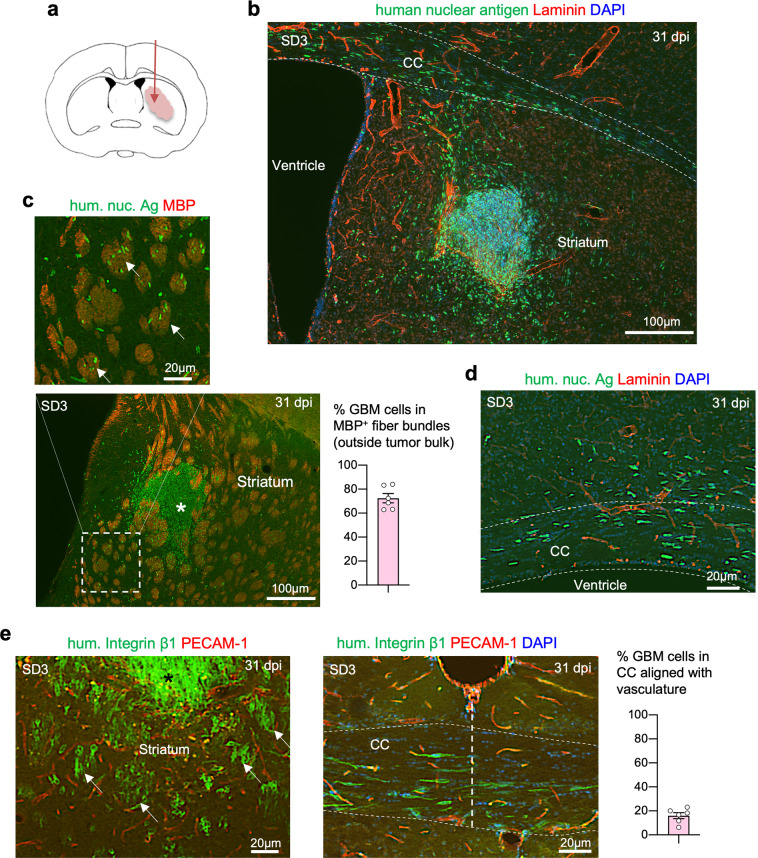
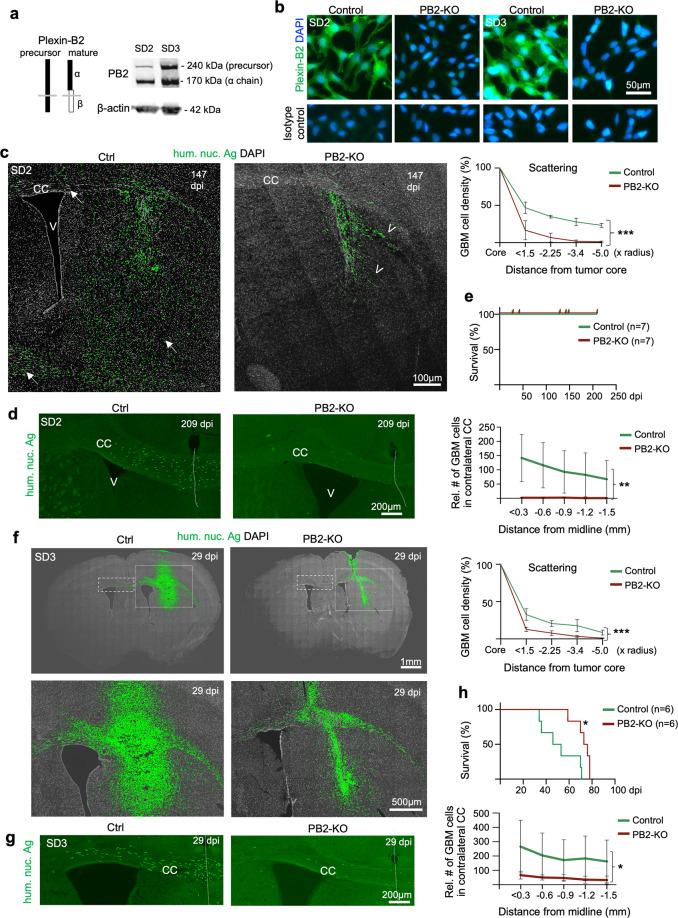
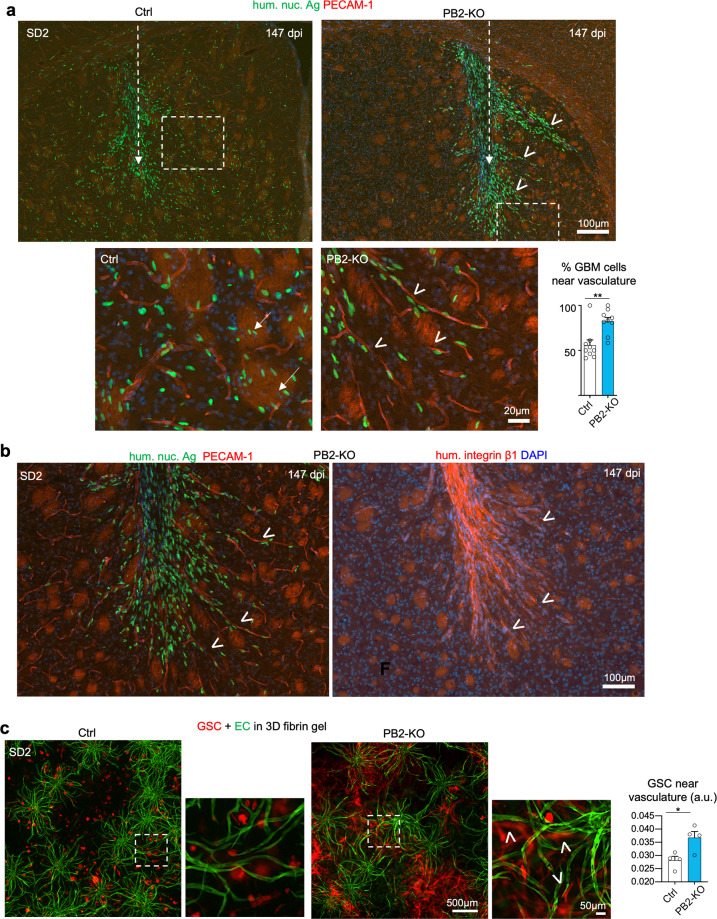
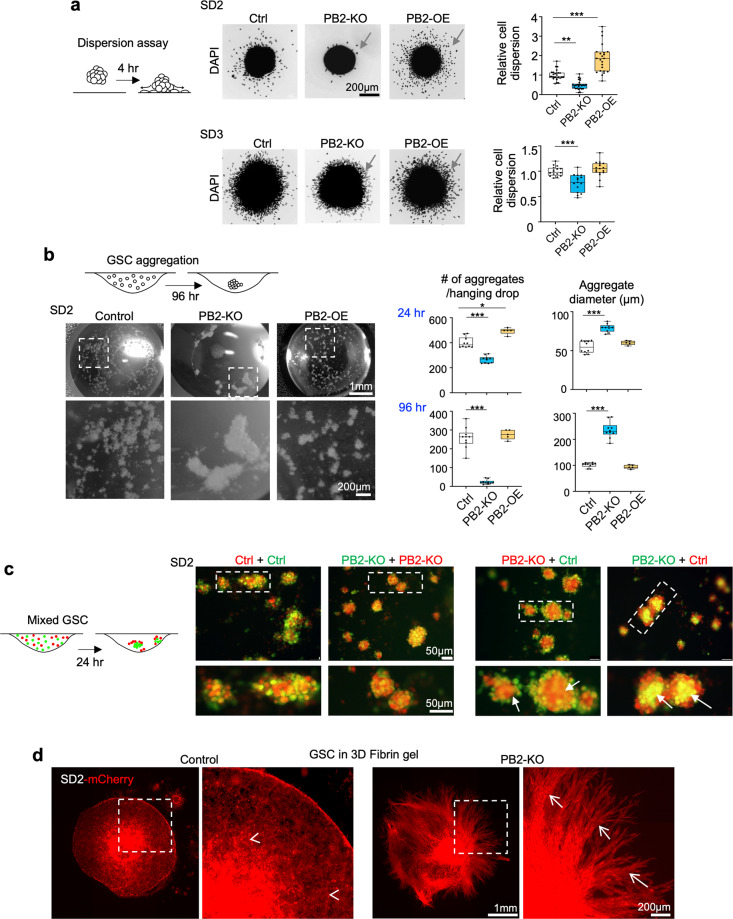
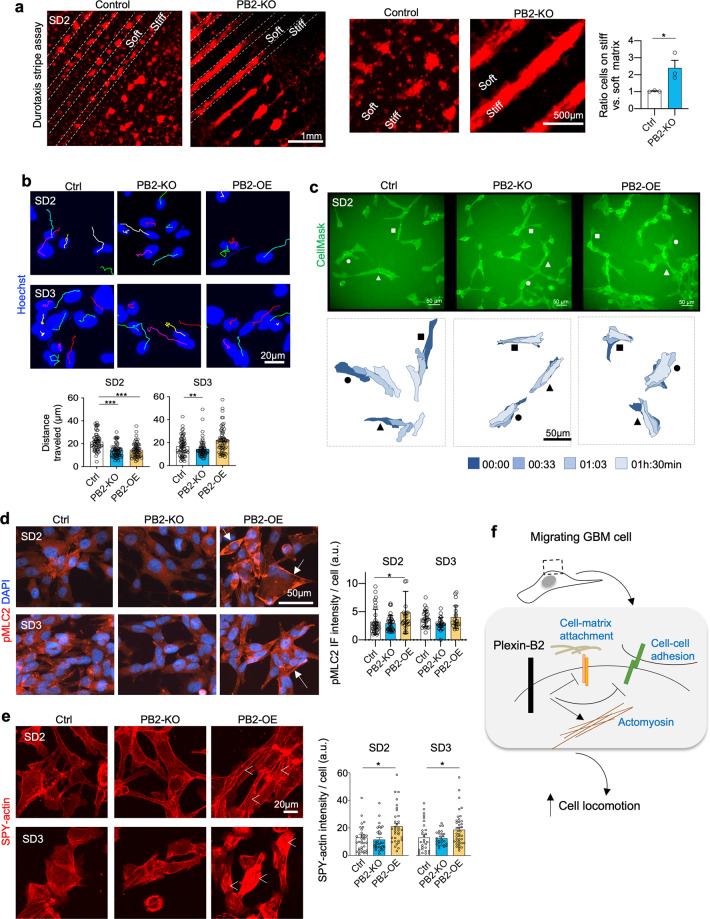
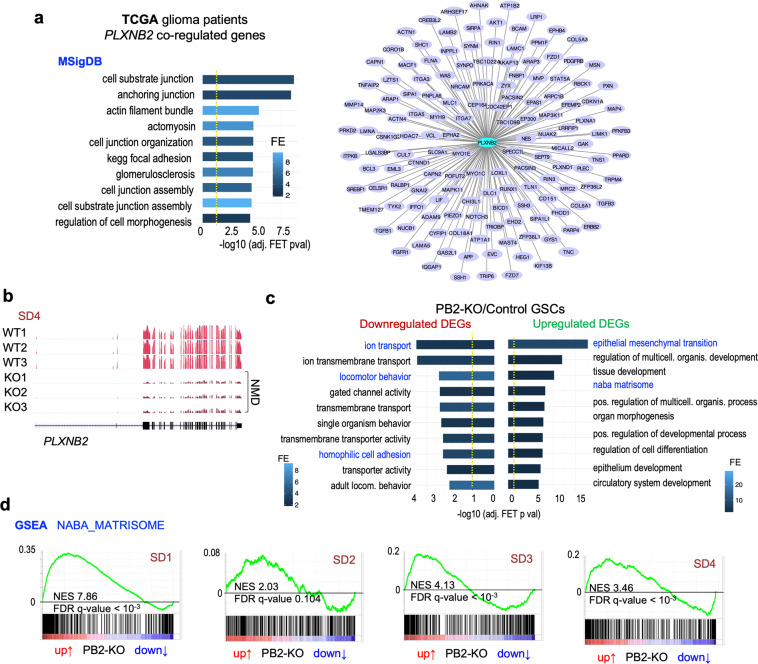
Infiltrative growth is a major cause of high lethality of malignant brain tumors such as glioblastoma (GBM). We show here that GBM cells upregulate guidance receptor Plexin-B2 to gain invasiveness. Deletion of Plexin-B2 in GBM stem cells limited tumor spread and shifted invasion paths from axon fiber tracts to perivascular routes. On a cellular level, Plexin-B2 adjusts cell adhesiveness, migratory responses to different matrix stiffness, and actomyosin dynamics, thus empowering GBM cells to leave stiff tumor bulk and infiltrate softer brain parenchyma. Correspondingly, gene signatures affected by Plexin-B2 were associated with locomotor regulation, matrix interactions, and cellular biomechanics. On a molecular level, the intracellular Ras-GAP domain contributed to Plexin-B2 function, while the signaling relationship with downstream effectors Rap1/2 appeared variable between GBM stem cell lines, reflecting intertumoral heterogeneity. Our studies establish Plexin-B2 as a modulator of cell biomechanics that is usurped by GBM cells to gain invasiveness.


Conflict of interest statement

The authors declare no competing interests.

Figures

Fig. 1
Fig. 1. Diffuse GBM infiltration along axon fiber tracts in intracranial GSC transplants.
a Diagram of orthotopic transplantation of patient-derived GSCs into the striatum of SCID mouse host. All images in this figure panel are from GSC line SD3 at 31 days post implantation (dpi). b Immunofluorescence (IF) image of coronal brain section with SD3 GSC transplant at 31 dpi, showing diffuse infiltration of tumor cells expressing human nuclear antigen (hum. nuc. Ag) in the striatum and along corpus callosum (CC, outlined by dashed lines). Laminin IF highlights the basal lamina ensheathing blood vessels. c Enlarged IF image shows a clear preference of invading GBM cells (hum. nuc. Ag+) for striatal axon fiber bundles (arrows), highlighted by IF for myelin basic protein (MBP). Numerous individual tumor cells had migrated away from tumor bulk (asterisk). Quantification indicates that in areas outside tumor bulk, greater than 70% of infiltrating cells are found in MBP+ fiber bundles (n = 6 fields from three animals; mean ± SEM). d IF image of the ipsilateral area of SD3 GSC transplant shows GBM cells invading along fiber tracks of the corpus callosum (CC). Note the orientation of elongated nuclei of the invading GBM cells aligned with axon fiber trajectory, but not with blood vessel axis (laminin+). e IF images of ipsilateral striatum (left) and CC at the midline (right) from brain transplanted with SD3 GSCs. Tumor cells stained for human integrin β1, which highlights cell surfaces, show diffuse dissemination within striatal axon fiber bundles (arrows) surrounded at the periphery by microvasculature (PECAM-1+). Note that the orientation of striatal fiber bundles and adherent GBM cells appeared perpendicular to the coronal plane. Also note the fusiform shape of the invading GBM cells in the CC, with cell axes aligned with axon trajectory, but not with microvasculature. Quantification on the right indicates the percentage of cells in the corpus callosum that are aligned with vessels (n = 6 fields from three animals; mean ± SEM).
Fig. 2
Fig. 2. Plexin-B2 ablation limits GBM spread.
a Diagram illustrating structure of Plexin-B2 precursor and mature form (during maturation, Plexin-B2 is cleaved into a non-covalently linked complex of α and β chains). WB with an antibody against the extracellular domain of Plexin-B2 shows a robust expression of Plexin-B2 in SD2 and SD3 GSCs. Note that cells typically express both precursor and mature forms of Plexin-B2, hence the double band pattern. b IF images of cultured GSCs demonstrate the absence of surface expression of Plexin-B2 (PB2) in cells with CRISPR KO. IF images of cells stained with isotype IgG control are shown in the bottom panels. c IF images of coronal brain sections with SD2 GSC transplants at 147 days post injection (dpi). Note the diffuse infiltration of tumor cells (hum. nuc. Ag+) in striatum and corpus callosum (CC) (arrows) in the control transplant, while PB2-KO GBM cells were mainly confined near the injection site. Also note tumor cell aggregation in collective migration streams at the tumor periphery in PB2-KO transplant (arrowheads), in contrast to the diffuse invasion pattern in control transplant. Quantifications on the right show the relative density of GBM cells (normalized to tumor core) in rings of increasing radius from the tumor core. n = 3 mice per genotype. Two-way ANOVA, ***P < 0.001. d IF images of the CC region show abundant tumor cells (hum. nuc. Ag+) crossing midline (dotted line) in control transplant at 209 dpi, but much fewer detectable tumor cells in contralateral CC in PB2-KO transplant. Quantifications show the relative abundance of GBM cells found in segments of 0.3 mm increment in contralateral CC. n = 4 mice per genotype. Two-way ANOVA, **P < 0.01. e Kaplan–Meier survival curves of mice transplanted with control or PB2-KO SD2 GSCs. No mice died for up to 209 dpi for either cohort (n = 7 mice per cohort), reflecting slow tumor expansion of SD2 GSCs in vivo. f IF images of coronal brain sections from mice transplanted with SD3 GSCs at 29 dpi. GBM cells with PB2-KO were more restricted in their infiltration than control cells. Quantifications on the right show the relative density of GBM cells (normalized to tumor core) in rings of increasing radius from the tumor core. n = 3 mice per genotype. Two-way ANOVA, ***P < 0.001. g Enlarged images of contralateral CC are shown for SD3 transplant. Midline is denoted by a dotted line. Quantifications show the relative abundance of GBM cells found in segments of 0.3 mm increment in contralateral CC. n = 3 mice per genotype. Two-way ANOVA, *P < 0.05. h Kaplan–Meier survival analysis shows that mice bearing intracranial transplants of PB2-KO SD3 GSCs survived significantly longer than mice with transplants of control GSCs: n = 6 mice per cohort; median survival 74.5 days vs. 49.5 days; *P = 0.014, Log-rank test.
Fig. 3
Fig. 3. Plexin-B2 deletion shifts preferred migratory path from axon tracts to the microvasculature.
a Representative IF images of coronal sections of brains with SD2 transplants at 147 dpi (dashed arrows indicate injection tract). While tumor cells (hum. nuc. Ag+) in the control cohort had invaded diffusely in the striatum as individual cells, they were largely confined to the transplant site in the PB2-KO cohort, revealing increased aggregation and collective invasion into neighboring brain tissue in bundles (arrowheads). Bottom, enlarged images of boxed areas show that invading GBM cells in control transplant displayed a predilection for striatal fiber tracts (arrows), while PB2-KO cells shifted their preference to perivascular invasion (arrowheads). Note that the nuclear orientation of the migrating PB2-KO cells is closely aligned with vascular axes (PECAM-1+). The bar graph shows quantification of the invading tumor cells along vasculature, defined as cells that are one or less than one cell diameter apart from the vessel. n = 9 areas from three independent transplants; unpaired t test; **P < 0.01. b IF images of adjacent brain sections near striatum from mice transplanted with PB2-KO SD3 GSCs at 147 dpi. Left image: at the invasion front, mutant GBM cells showed a clear preference for perivascular invasion (PECAM-1) with nuclear orientation aligned with the vessel axis (arrowheads). Right image: IF for human-specific integrin β1 shows collective chain migration of PB2-KO cells in bundles (arrowheads) that clearly avoided striatal fiber tracts, visible by background fluorescence signals. Note that migrating GBM cells closely adhere to blood vessels at the invasion front (compare images in the left and right panels). c Images from 3D vascular network cultures (containing human brain microvascular endothelial cells (GFP+), pericytes, and astrocytes) that were seeded with control or PB2-KO SD2 GSCs expressing mCherry. Photos were taken 14 days after cell seeding. PB2-KO cells displayed a bias toward vascular adherence (arrowheads). Quantification on the right indicates the relative abundance of tumor cells that were in close proximity to the vasculature (0–20 µm distance). n = 4 independent experiments per group. unpaired t test; *P < 0.05.
Fig. 4
Fig. 4. Plexin-B2 lowers cell adhesiveness in GSCs.
a Left, diagram of cell dispersion assay with 3D aggregates plated on the laminin-coated surface and analyzed after 4 h for dispersion of cell from aggregates. Center, micrographs of DAPI stained aggregates and surrounding dispersed cells (arrows). Right, quantifications of cell dispersion, normalized to mean of the control condition. Box plots and whiskers indicate quartiles, center lines indicate median. n = 18–34 spheres per group; one-way ANOVA with Dunnett’s multiple comparison test of each group against control; *P < 0.05, **P < 0.01, ***P < 0.001. b Diagram illustrates the hanging drop cell aggregation assay. Photos of drops show aggregates formed by SD2 GSCs with the indicated Plexin-B2 manipulation, 96 h after seeding. Right, quantifications of aggregate numbers and sizes at 24 and 96 h. n = 5–11 hanging drops per group; one-way ANOVA with Dunnett’s multiple comparison test of each group against control; *P < 0.05, ***P < 0.001. c Left, diagram of differential hanging drop cell aggregation assay with GSCs of different genotypes labeled with green or red CellTracker dyes, and mixed 1:1 before seeding. Right, fluorescence images of SD2 aggregates after 24 h, revealing that PB2-KO cells congregated in the center (arrows), while control cells were mainly at the periphery, illustrating stronger adhesiveness between PB2-KO cells. The mixture of GSCs with identical genotypes (Ctrl + Ctrl, or KO + KO) leads to evenly distributed aggregates. d Fluorescence images of SD2 GSCs expressing mCherry that had been embedded as aggregates in 3D fibrin gel matrix. Note the striking differences in the growth/invasion patterns after 27 days: control cells invaded diffusively as individual cells (arrowheads), whereas PB2-KO GSCs invaded the surrounding matrix collectively as fasciculated migration streams (arrows).
Fig. 5
Fig. 5. Plexin-B2 counters durotaxis and enhances cell locomotion and actomyosin network.
a Durotaxis stripe assay. SD2 GSCs expressing mCherry were cultured for 10 days on alternating stripes of soft (~25 kPa) vs. stiff (~30 kPa) PEG substrates. While control GSCs spread on both soft and stiff stripes, PB2-KO cells aggregated only on stiffer stripes. Enlarged images are shown on the right. Quantification measures mCherry fluorescence signals from soft vs. stiff stripes. n = 3 independent experiments per group. *P < 0.05, unpaired t test. b Still frames captured from time-lapse live imaging of GSCs, tracked with Hoechst nuclear dye (colored lines track individual nuclei). Quantifications reveal reduced migration distance over 90 min for PB2-KO GSCs as compared to controls (see Supplementary Videos). SD2 PB2-OE GSCs also had reduced speed of locomotion, but no significant change for SD3 was detected. n = 90 tracked nuclei per condition; one-way ANOVA with Dunnett’s multi-comparison test; *P < 0.05; **P < 0.01. c Top, still frames from time-lapse live imaging of the indicated SD2 GSCs labeled with CellMask membrane dye. Bottom, three selected cells in each group shown in overlapping contour plots at 30 min-intervals over 90 min. Note the dynamic movement of control cells as compared to both PB2-KO and -OE conditions (see supplementary videos). d IF images show increased levels of phospho-myosin light chain 2 (pMLC2, arrows) in PB2-OE SD2 GSCs as compared to control cells. Right, quantifications show increased levels of IF intensity for pMLC2 per cell (corrected total fluorescence quantification; a.u., arbitrary unit). n > 30 cells for each condition. One-way ANOVA with Dunnett’s multi-comparison test; *P < 0.05. Differences for SD3 GSC did not reach statistical significance. e Live-cell imaging of GSCs stained with F-actin dye SPY-actin. Overexpression of PB2 in SD2 and SD3 GSCs leads to increased actin filament formation (arrowheads). Quantification indicates corrected total cell fluorescence; a.u., arbitrary unit. n > 30 cells for each condition. One-way ANOVA with Dunnett’s multi-comparison test; *P < 0.05. f Working model. Plexin-B2 controls actomyosin dynamics and interactions of invading GBM cells with neighboring cells and matrix substrates along migratory paths.
Fig. 6
Fig. 6. Gene expression analyses link Plexin-B2 to biomechanical gene signatures in GBM.
a Genes that are correlated with PLXNB2 expression levels in GBM patients (Spearman correlation FDR < 10%, TCGA database) are enriched for pathways concerning cell adhesion, cell-substrate junctions, and actomyosin. Left, top 10 significant functional terms (MSigDB) are shown. Right, diagram of connectivity of coregulated genes with PLXNB2 in human GBMs, filtered for genes involved in cell adhesion, motility/invasion, and EMT. b Examples of RNA-seq read tracks for PLXNB2 mRNA in three GSC clonal lines of wild-type and PB2-KO genotypes from SD4 GSCs. Frameshift mutations in the PB2-KO lines lead to the reduction of PLXNB2 mRNA levels by nonsense-mediated decay (NMD). c Pathway enrichment analyses of up- and downregulated DEGs in response to Plexin-B2 KO (union of all DEGs from four GSC lines; FDR < 20%). Top ten significantly enriched terms (MSigDB) are shown. Dashed yellow lines denote −log10 (adjusted P value) = 0.05. d GSEA of expression changes in PB2-KO vs. control GSCs shows enrichment of Matrisome gene set (Naba et al.) for all four GSC lines. The sinusoidal shapes of enrichment scores (green line) indicate enrichment of both up- and downregulated genes.
Fig. 7
Fig. 7. Plexin-B2 signaling engages the Ras-GAP domain.
a Cartoon of Plexin-B2 domain structure. Cell membrane shown as a gray bar; dashed line indicates proteolytic cleavage into α and β chains. Sema, Sema domain; PSI, plexin-semaphorin-integrin domain; IPT, Ig-like fold shared by plexins and transcription factors; RBD, Rho-binding domain; GAP, GTPase activating protein; VTDL, PDZ-domain binding site formed by four C-terminal amino acids for docking of PDZ-Rho-GEF or LARG proteins. b Diagrams of lentiviral vectors encoding cDNA of wild-type or signaling mutants of Plexin-B2. PB2* is CRISPR-resistant cDNA, due to synonymous mutations (X) at sgRNA target site. dEcto lacks extracellular domain, mGAP has mutated GTPase activation domain, mRBD has mutated Rho-binding domain, and dVTDL has deleted PDZ-binding motif. c Cell aggregation assay in hanging drops used for Plexin-B2 (PB2) rescue experiments. Photos and enlargements show aggregates formed from GSCs with the indicated Plexin-B2 mutations in hanging drops after 96 h. Quantifications of aggregate numbers and sizes in hanging drops at 24 or 96 h are shown below. The mGAP and dEcto Plexin-B2 mutants failed to rescue the KO phenotype (marked as blue). n = 5–11 drops per group; one-way ANOVA with Dunnett’s multiple comparison test of each group against SD2-Ctrl; *P < 0.05, ***0.001. d Left, representative micrographs of cell dispersion assay with GSCs expressing mutant Plexin-B2 rescue constructs. Dispersed cells from aggregates were visualized at 4 h with DAPI nuclear stain. Bottom, quantifications show the number of nuclei detached from spheres normalized to mean in the control condition. The PB2 mGAP mutant failed to rescue the KO phenotype (marked as blue). Box plots and whiskers indicate quartiles, center lines indicate median. n = 18–34 spheres per group; one-way ANOVA with Dunnett’s multiple comparison test of each group against control; *P < 0.05, ***P < 0.001. e Model depicting Plexin-B2 signaling through Ras-GAP domain to affect cell biomechanics during GBM invasion.

References

    1. Drappatz J, Norden AD, Wen PY. Therapeutic strategies for inhibiting invasion in glioblastoma. Expert Rev. Neurother. 2009;9:519–534. doi: 10.1586/ern.09.10. - DOI - PubMed
    1. Holland EC. Glioblastoma multiforme: the terminator. Proc. Natl Acad. Sci. USA. 2000;97:6242–6244. doi: 10.1073/pnas.97.12.6242. - DOI - PMC - PubMed
    1. Cuddapah VA, Robel S, Watkins S, Sontheimer H. A neurocentric perspective on glioma invasion. Nat. Rev. Neurosci. 2014;15:455–465. doi: 10.1038/nrn3765. - DOI - PMC - PubMed
    1. Scherer HJ. Structural development in gliomas. Am. J. Cancer. 1938;34:333–351.
    1. Lo CM, Wang HB, Dembo M, Wang YL. Cell movement is guided by the rigidity of the substrate. Biophys. J. 2000;79:144–152. doi: 10.1016/S0006-3495(00)76279-5. - DOI - PMC - PubMed

Publication types

MeSH terms