. 2021 Jan 29;4(1):146.
doi: 10.1038/s42003-020-01636-3.

Single-cell transcriptomics following ischemic injury identifies a role for B2M in cardiac repair

Affiliations

Single-cell transcriptomics following ischemic injury identifies a role for B2M in cardiac repair

Bas Molenaar et al. Commun Biol. .

Abstract

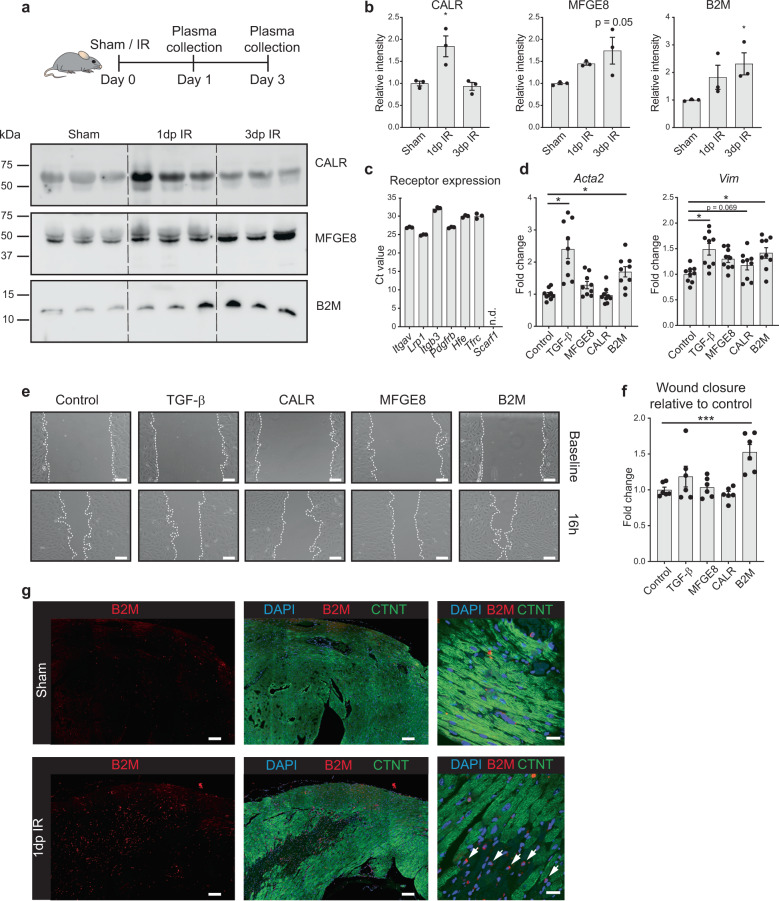
The efficiency of the repair process following ischemic cardiac injury is a crucial determinant for the progression into heart failure and is controlled by both intra- and intercellular signaling within the heart. An enhanced understanding of this complex interplay will enable better exploitation of these mechanisms for therapeutic use. We used single-cell transcriptomics to collect gene expression data of all main cardiac cell types at different time-points after ischemic injury. These data unveiled cellular and transcriptional heterogeneity and changes in cellular function during cardiac remodeling. Furthermore, we established potential intercellular communication networks after ischemic injury. Follow up experiments confirmed that cardiomyocytes express and secrete elevated levels of beta-2 microglobulin in response to ischemic damage, which can activate fibroblasts in a paracrine manner. Collectively, our data indicate phase-specific changes in cellular heterogeneity during different stages of cardiac remodeling and allow for the identification of therapeutic targets relevant for cardiac repair.


Conflict of interest statement

The authors declare no competing interests.

Figures

Fig. 1
Fig. 1. Single-cell sequencing reveals changes in the cellular composition of the myocardium at different time points after ischemic injury.
a Schematic of the study outline indicating time points of tissue harvest after ischemia/reperfusion (IR) injury and representation of the known cellular composition and function at these time points. b Determination of cell viability by DAPI negativity following dissociation and FACS procedure. c Schematic of the experimental setup to determine the percentage cells that are DAPI− but are nucleated as determined by DRAQ5 positivity. d Heatmap of the cell-to-cell transcriptome similarities (1 − Pearson’s correlation coefficient) of 2201 cells obtained from all conditions combined. Cells are clustered based on transcriptome similarity using k-medoids clustering. e t-Distributed Stochastic Neighbor Embedding (tSNE) plot indicating transcriptome similarities across individual cells. Different colors and numbers highlight the clusters identified by k-medoids clustering in (d). f Table highlighting cell types that were characterized by the clustering analysis. g Bar graph showing the proportion of cells originating from the different condition per cluster. CM cardiomyocytes, FB fibroblasts, MP macrophages, NP neutrophils, EC endothelial cells.
Fig. 2
Fig. 2. Single-cell sequencing indicates cardiomyocyte heterogeneity.
a tSNE plot indicating transcriptomic similarities across cardiomyocytes obtained from all conditions. Different colors, symbols and numbers highlight the clusters as determined by k-medoids clustering of 1 − Pearson’s correlation coefficient. b Bar graph showing the proportion of cardiomyocytes originating from the different condition per cluster. c Heatmap showing expression of all genes significantly enriched in at least one cluster. Examples of genes enriched per cluster are depicted on the right side of the heatmap. d Bubble plot of top GO terms in gene ontology analysis on genes significantly enriched within the cluster. bd Numbers highlighted in red depict a cluster that mainly contains 3 dp IR and 14 dp IR cardiomyocytes (cluster 5). e, f Cell trajectory analysis of cardiomyocytes, showing pseudotime on a color-coded scale (e) or highlighting the k-medoids cluster of each cardiomyocyte in the trajectory plot (f). The regions in the branches of the trajectory plot that contain mostly cells from k-medoids clusters 1,2,3 or cluster 4 or cluster 5 are highlighted by number.
Fig. 3
Fig. 3. Macrophages show transcriptional heterogeneity after ischemia and shift from a pro-inflammatory to a wound healing transcriptional profile.
a tSNE plot indicating transcriptomic similarities across macrophages obtained from all conditions. Different colors, symbols and numbers highlight the clusters as determined by k-medoids clustering of 1 −  Pearson’s correlation coefficient. Stars highlight a cell cluster formed by macrophages from all conditions; triangles highlight clusters containing mainly 1 dp IR macrophages and circles depict clusters containing mainly 3 dp IR macrophages. b Bar graph showing the proportion of macrophages originating from the different conditions per cluster. c Heatmap showing expression of all genes significantly enriched in at least one cluster. Examples of genes enriched per cluster are depicted on the right side of the heatmap. d Bubble plot of top GO terms in gene ontology analysis on genes significantly enriched within either cluster one, in at least one of the 1 dp IR enriched clusters or in at least one of the 3 dp IR clusters. e, f Cell trajectory analysis of macrophages, showing pseudotime on a color-coded scale (e) or highlighting the k-medoids cluster of each macrophage in the trajectory plot (f). The branches in the trajectory plot that contain mostly cells from cluster 1, from the 1 dp IR clusters or from the 3 dp IR clusters are highlighted by number or tekst. g RT-qPCR analysis on the infarcted cardiac tissue at different time points post IR for Arg1 and Gpnmb. Per time point post IR, expression levels are relative to the corresponding time point post sham surgery (n = 6 animals). Data are presented as mean ± SEM. *P < 0.05, **P < 0.01, Two-sample t-test vs corresponding time point post sham, with Holm–Sidak adjustment for multiple comparisons. n.d. not determined.
Fig. 4
Fig. 4. Transcriptome-wide changes in fibroblasts at different stages after ischemic injury suggest dynamic fibroblasts function during wound healing.
a tSNE plot indicating transcriptomic similarities across fibroblasts obtained from all conditions. Different colors and numbers highlight the clusters as determined by k-medoids clustering of 1 −  Pearson’s correlation coefficient. b Bar graph showing the proportion of fibroblasts originating from the different conditions per cluster. c Heatmap showing expression of all genes significantly enriched in at least one cluster. Examples of genes enriched per cluster are depicted on the right side of the heatmap. d Bubble plot of gene ontology analysis on genes significantly enriched within a cluster. bd Numbers highlighted in red depict clusters that mainly contain 1 dp IR (cluster 4) or 3 dp IR (cluster 3) fibroblasts. e, f, Cell trajectory analysis of fibroblasts, showing pseudotime on a color-coded scale (e) or highlighting the k-medoids cluster of each fibroblast in the trajectory plot (f). The branches in the trajectory plot that contain mostly cells from k-medoids cluster 1, 3 or 4 are highlighted by number. g RT-qPCR analysis on the infarcted cardiac tissue at different time points post IR for Ccl2 and Col1a1. Per time point post IR, expression levels are relative to the corresponding time point post sham surgery (n = 6 animals). Data are presented as mean ± SEM. *P < 0.05, **P < 0.01, ***P < 0.001, Two-sample t-test vs the corresponding time point post sham, with Holm–Sidak adjustment for multiple comparisons.
Fig. 5
Fig. 5. Intercellular communication by autocrine and paracrine signaling in the ischemic heart.
a tSNE plot of all cells obtained 1 dp IR. Colors indicate different cell types. CM cardiomyocytes, FB fibroblasts, MP macrophages, NP neutrophils, EC endothelial cells. To determine potential autocrine/paracrine signaling after ischemia, expression of ligands in one cell type was determined (e.g. cardiomyocytes highlighted by circle). Subsequently, the expression of cognate receptors was determined per cell type (highlighted by dashed arrows). b Spider graph illustrating the potential intercellular communications between cell types by ligand-receptor signaling. The line color depicts ligand expression in the cell type with the same color. Lines connect to cell types that express the corresponding receptor. Line thickness is proportional to the number of ligands expressed in one population for which the receptor is expressed in the other cell type, with loop indicating autocrine signaling. c Potential intercellular ligand-receptor signaling between cell types, described for each cell type separately. Numbers depict the number of ligand-receptor couples between inter-cell type links. d Schematic of the screening strategy used to identify potential ligands involved in autocrine/paracrine signaling between stressed cardiomyocytes and other cell types 1 dp IR. e Bubble plot showing ligands selected for downstream functional study with their cognate receptor(s). A positive control (Nppb) is depicted in red. The size of the bubble represents the expression of each receptor across all identified cardiac cell types 1 dp IR.
Fig. 6
Fig. 6. B2M is secreted by stressed cardiomyocytes to activate fibroblasts.
a Western blot on mice plasma at different time points post IR or 1 day post sham (n = 3 animals). Equal loading of plasma proteins was confirmed by Coomassie staining (Supplementary Fig. 9). b Quantification of immunoblots in (a); *P < 0.05 compared to sham, Kruskal–Wallis test with Dunnett’s multiple comparison post-hoc test. c Cognate receptor expression of selected ligands in NIH/3T3 fibroblasts is shown by RT-qPCR. d Upregulation of two myofibroblast (Acta2 and Vim) markers in NIH/3T3 cells after treatment with B2M, TGF-β served as positive control (n = 9 from 3 independent experiments). e Increased wound healing of NIH/3T3 cells after treatment with B2M, assessed by scratch assay. Images show representative pictures for each condition. Dashed lines indicate gap size. f Quantification of wound healing assay relative to corresponding control (n = 6 from 2 independent experiments). Scale bars, 200 μm. g Immunohistochemistry images of heart slices after IR or sham surgery. White arrows indicate cardiomyocytes (larger cells with diminished CTNT staining) within the infarct zone that show B2M expression. CTNT cardiac troponin T. Scale bars, 100 μm (left and middle panels) and 20 μm (right panels). Data are presented as mean ± SEM. *P < 0.05, ***P < 0.001. One-way ANOVA with multiple comparison vs control and Dunnett’s adjustment for multiple hypothesis testing.

References

    1. Rosamond WD, et al. Twenty-two-year trends in incidence of myocardial infarction, coronary heart disease mortality, and case fatality in 4 US communities, 1987-2008. Circulation. 2012;125:1848–1857. doi: 10.1161/CIRCULATIONAHA.111.047480. - DOI - PMC - PubMed
    1. Thygesen K, et al. Fourth universal definition of myocardial infarction (2018) Eur. Heart J. 2019;40:237–269. doi: 10.1093/eurheartj/ehy462. - DOI - PubMed
    1. Levy DKS, et al. Long-term survival in the incidence of and survival with heart failure. N. Engl. J. Med. 2002;347:1397–1402. doi: 10.1056/NEJMoa020265. - DOI - PubMed
    1. Epelman S, Liu PP, Mann DL. Role of innate and adaptive immune mechanisms in cardiac injury and repair. Nat. Rev. Immunol. 2015;15:117–129. doi: 10.1038/nri3800. - DOI - PMC - PubMed
    1. Forte E, Furtado MB, Rosenthal N. The interstitium in cardiac repair: role of the immune-stromal cell interplay. Nat. Rev. Cardiol. 2018;15:601–616. doi: 10.1038/s41569-018-0077-x. - DOI - PubMed

Publication types

MeSH terms

Substances