. 2021 Mar;18(3):735-745.
doi: 10.1038/s41423-020-00615-2. Epub 2021 Jan 29.

A novel CD4+ CTL subtype characterized by chemotaxis and inflammation is involved in the pathogenesis of Graves' orbitopathy

Affiliations

A novel CD4+ CTL subtype characterized by chemotaxis and inflammation is involved in the pathogenesis of Graves' orbitopathy

Yue Wang et al. Cell Mol Immunol. 2021 Mar.

Abstract

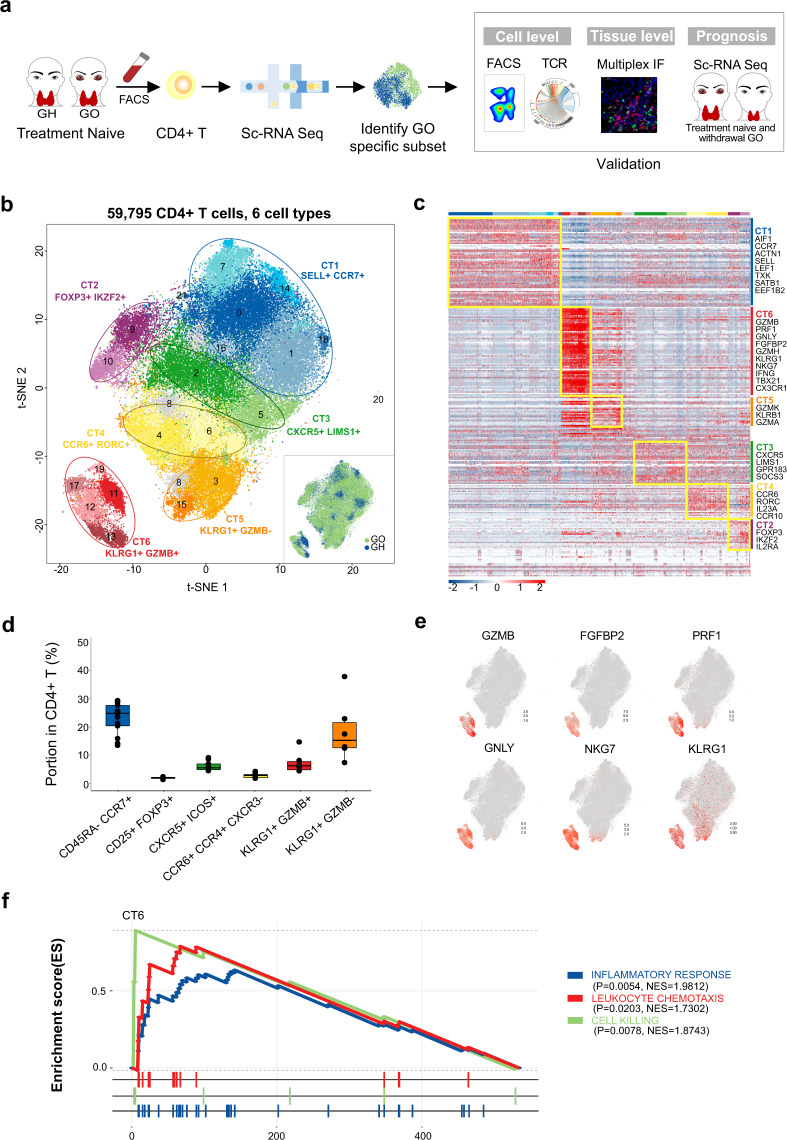
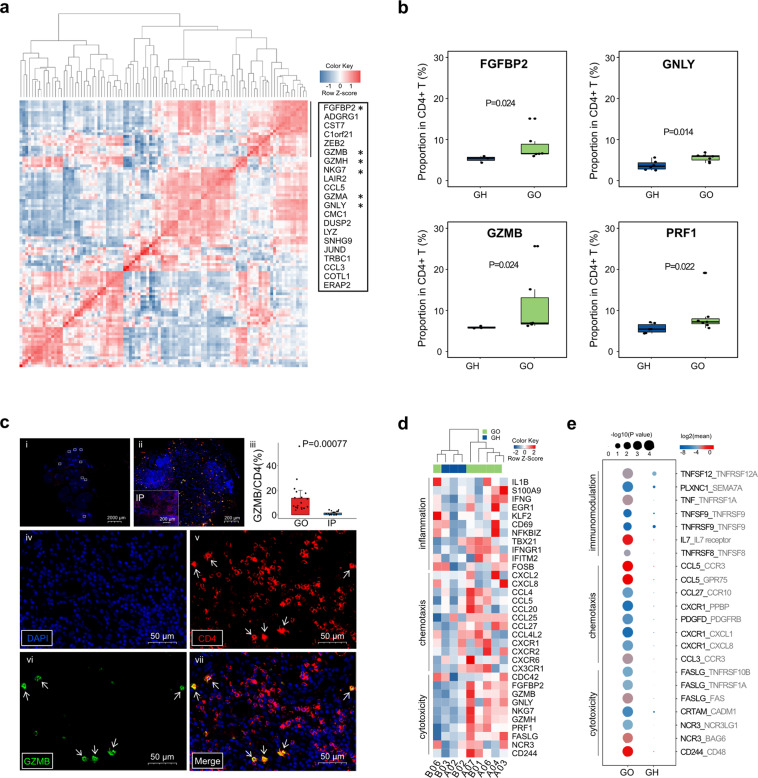
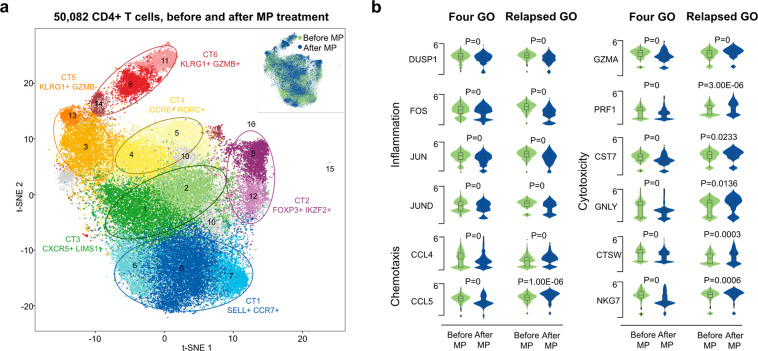
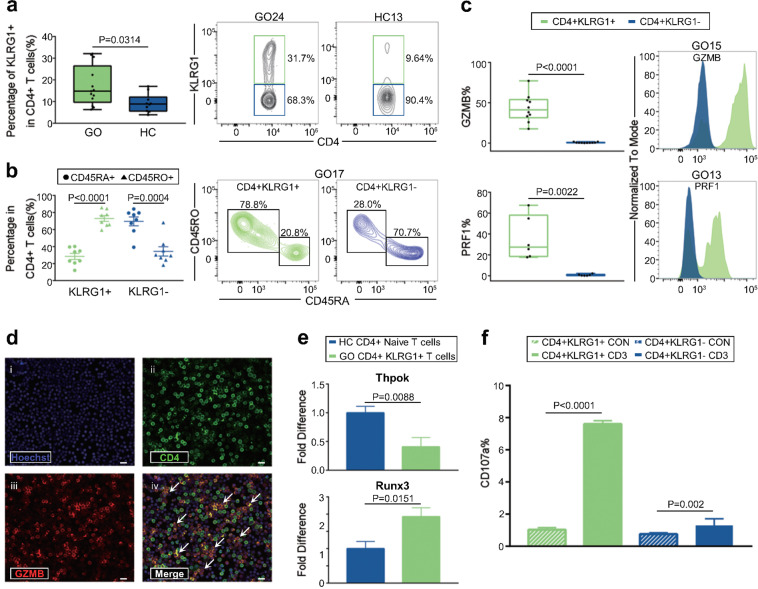
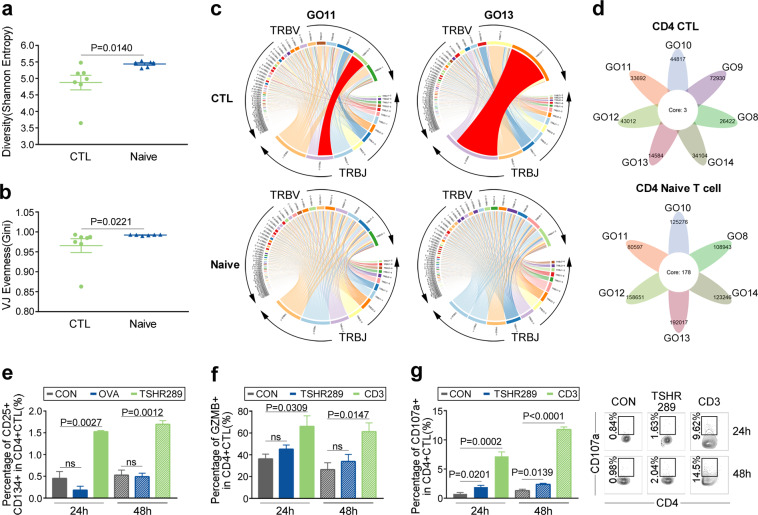
Graves' orbitopathy (GO), the most severe manifestation of Graves' hyperthyroidism (GH), is an autoimmune-mediated inflammatory disorder, and treatments often exhibit a low efficacy. CD4+ T cells have been reported to play vital roles in GO progression. To explore the pathogenic CD4+ T cell types that drive GO progression, we applied single-cell RNA sequencing (scRNA-Seq), T cell receptor sequencing (TCR-Seq), flow cytometry, immunofluorescence and mixed lymphocyte reaction (MLR) assays to evaluate CD4+ T cells from GO and GH patients. scRNA-Seq revealed the novel GO-specific cell type CD4+ cytotoxic T lymphocytes (CTLs), which are characterized by chemotactic and inflammatory features. The clonal expansion of this CD4+ CTL population, as demonstrated by TCR-Seq, along with their strong cytotoxic response to autoantigens, localization in orbital sites, and potential relationship with disease relapse provide strong evidence for the pathogenic roles of GZMB and IFN-γ-secreting CD4+ CTLs in GO. Therefore, cytotoxic pathways may become potential therapeutic targets for GO.

Keywords: CD4+ cytotoxic T lymphocytes; Graves’ orbitopathy; single-cell RNA sequencing.


Conflict of interest statement

The authors declare no competing interests.

Figures

Fig. 1
Fig. 1
Identification of the GO-specific T cell type: a novel CD4+ CTL subtype with properties of chemotaxis and inflammation. a Flow chart of the overall study design. b Graph-based clustering and the t-SNE algorithm were applied to 59,795 CD4+ T cells from the peripheral blood of 6 GO and 3 GH patients. Clusters denoted by the same color scheme were labeled with inferred cell types. The clusters in the bottom right denoted by green and blue are labeled with disease types. c Heat map from single-cell analysis via expression data of the top ten genes differentially expressed for each cluster with cells grouped into cell types (indicated by colored bars at the top). Key genes for each cell type are shown on the right margin. d Expression level of canonical lineage markers for terminal effect cytotoxic T cells (CT6) across 59,795 CD4+ T cells illustrated in t-SNE plots. e GSEA plots for the indicated gene sets in the transcriptome of CT6 from GO versus GH. The positive enrichment score indicated a positive correlation with the GO group. NES, normalized enrichment score
Fig. 2
Fig. 2
The characteristics of GO-specific CD4+ T cell types included cytotoxicity, chemotaxis and inflammation. a Pearson correlation with cytotoxic expression in CT6 cells. Pearson correlation plot showing the coexpression of the top 100 CT6-specific transcripts in GO. The black solid line shows a cluster of transcripts showing a high correlation; the list of these transcripts is shown in the text box on the right, and stars highlight the genes with cytotoxic functions. b Boxplots showing the proportions of the cytotoxic molecules FGFBP2, GNLY, GZMB and PRF1 in CD4+ T cells by flow cytometry (n = 7 in GO; and n = 6 in GH). Boxplots with the plot center and box corresponding to the median and IQR, respectively, and include individual data points. c Representative example of orbital tissue from GO patients and inflammatory pseudotumor (IP) patients by fluorescent multiplex immunohistochemistry showing coexpression of CD4 and GZMB. (i) Low-magnification image of whole orbital tissue. (ii) Image at 10× magnification with a proportion of GZMB in CD4+ T cells higher in GO than in IP patients. (iii) Quantification of the GZMB proportion in CD4+ cells for n = 6 independent cases, including representative cases. Error bars are mean ± SEM. Data points, each representing one case, are shown by solid circles. (iv-vii) Images at 40× magnification of a single section stained for DAPI, CD4 and GZMB, illustrating coexpression of CD4 and GZMB (small arrows). Information on the other samples is shown in Supplementary Fig. 11. d Hierarchical clustering of CT6 among 6 GO and 3 GH patients by genes involved in inflammation, chemotaxis and cytotoxicity activities. The heatmap shows, for each gene, the scaled average expression over all cells of each patient. e Selected ligand–receptor interactions between CT6 and CT4 cells in GO and GH, respectively. The black and gray fonts represent the ligands or receptors from CT6 and CT4, respectively. P values are indicated by the circle size. The means of the average expression levels of interacting molecules in CT6 and CT4 are indicated by color
Fig. 3
Fig. 3
GO relapse was related to increased levels of chemotaxis and cytotoxicity molecules in proinflammatory CD4+ CTLs after treatment. a Graph-based clustering and the t-SNE algorithm were applied to 50,082 CD4+ T cells from 4 GO patients before and after treatment (n = 8). Clusters denoted by the same color scheme were labeled with inferred cell types. The clusters in the top right denoted by green and blue were labeled before and after treatment, respectively. b Violin plots showing the single-cell expression pattern of the indicated marker genes involved in inflammation, chemotaxis and cytotoxicity of CT6 from four GO patients and one relapsed GO patient (A04) before and after treatment. The shapes represent the distribution of cells based on the gene expression
Fig. 4
Fig. 4
Functional CD4+ CTLs were contained in CD4+ KLRG1+ T cells. a Boxplot (left) showing the proportion of KLRG1+ CD4+ T cells (n = 13 in GO and n = 10 in HC). Boxplot with the plot center and box corresponding to median and extremum, respectively and include individual data points. Representative flow cytometry plots (middle and right) of CD4+ KLRG1+ T cells gated in CD4+ T cells from samples GO24 and HC13. The numbers denote the percentage of cells in each rectangular gate. b The percentage of CD45RA+ (round) and CD45RO+ (triangle) cells in CD4+ KLRG1+ (green) and CD4+ KLRG1− (blue) T cells, respectively (n = 8 in GO). Data are means ± SEMs and individual values. Representative flow cytometry plots (middle and right) of CD45RA+ and CD45RO+ cells in CD4+ KLRG1+ and CD4+ KLRG1− T cells in sample GO17. The numbers denote the percentage of cells in each rectangular gate. c Boxplots (left) showing the ratio of GZMB (upper) and PRF1 (bottom) in CD4+ KLRG1+ (green) and CD4+ KLRG1− (blue) T cells (n = 10 in GO). Boxplots with plot center and box corresponding to median and extremum, respectively and include individual data points. Representative histograms (right) of GZMB (upper) and PRF1 (bottom) in CD4+ KLRG1+ (green) and CD4+ KLRG1− (blue) T cells in samples GO15 and GO13, respectively. d Representative example of CD4 and GZMB coexpression (small arrows) detected by confocal microscopy with staining for (i) Hoechst, (ii) CD4, (iii) GZMB, and (iv) merged CD4+ KLRG1+ T cells from GO patients. Scale bars 20 μm. e Bar plots showing the levels of Thpok (upper) and Runx3 (bottom) in CD4+ KLRG1+ T cells (green) from GO patients and CD4+ naïve T cells (blue) from HCs (n = 13 in GO; and n = 10 in HC). Error bars show SEM. f Bar plot showing the percentage of CD107a in CD4+ KLRG1+ T cells (green) and CD4+ KLRG1− T cells (blue) from GO patients after treatment with blank (control, slash) and anti-human CD3 (filled) antibodies for 6 h. Error bars show SEM. The data are representative of at least three biological replicates
Fig. 5
Fig. 5
CD4+ KLRG1+ CTLs in GO exhibited marked clonal expansions. Whisker plot showing TCR VJ diversity (a) and evenness (b) by the Shannon entropy and Gini coefficient in CD4+ KLRG1+ CTLs (green, n = 7) and CD4+ naïve T cells (blue, n = 6) from GO patients. Data are presented as the mean with SEM of individual values. c TRBV and TRBJ gene segment usage and V-J recombination are illustrated by circos plots in samples GO11 and GO13. The TRBV and TRBJ genes were arranged clockwise in the order of their frequency from low to high. A VJ recombination is illustrated by colored curved paths whose thickness represents their frequencies in the TCR repertoires. d Flower plots present the amount of overlap (core) and individual overlap (petal) in TCR clonotypes in CD4+ KLRG1+ CTLs (upper, n = 7) and CD4+ naïve T cells (bottom, n = 6), respectively. e–g Isolated CD4+ T cells and mitomycin-treated non-CD4+ T cells were cocultured at a 1:3 ratio with blank control (gray), 25 μg/mL human TSHR289 protein (green or blue), 25 μg/mL ovalbumin (OVA) (blue) or 10 μg/mL anti-human CD3 (green) for 24 h (filled) and 48h (slash). Comparisons of the CD25+ CD134+ (e), GZMB+ (f) and CD107a+ (g) ratios in CD4+ KLRG1+ CTLs are shown by bar plots to detect the TSHR-specific response. Error bars show the SEM. All data are representative of at least three biological replicates. Representative flow cytometry plots (right) of the CD107a+ cell ratio in CD4+ KLRG1+ CTLs after coculturing for 24 h and 48 h in the control, TSHR289 protein and anti-human CD3 groups. The numbers denote the percentage of cells in each rectangle

References

    1. Smith TJ, Hegedüs L. Graves’ Disease. N. Engl. J. Med. 2016;375:1552–1565. - PubMed
    1. Bahn RS. Graves’ ophthalmopathy. N. Engl. J. Med. 2010;362:726–738. - PMC - PubMed
    1. Taylor PN, et al. New insights into the pathogenesis and nonsurgical management of Graves orbitopathy. Nat. Rev. Endocrinol. 2020;16:104–116. - PubMed
    1. Ye X, et al. Efficacy and safety of mycophenolate mofetil in patients with active moderate-to-severe Graves’ orbitopathy. Clin. Endocrinol. 2017;86:247–255. - PubMed
    1. Kahaly GJ, et al. Mycophenolate plus methylprednisolone versus methylprednisolone alone in active, moderate-to-severe Graves’ orbitopathy (MINGO): a randomised, observer-masked, multicentre trial. Lancet Diabetes Endocrinol. 2018;6:287–298. - PubMed

Publication types

MeSH terms

Substances