. 2021 Jan 29;11(1):2692.
doi: 10.1038/s41598-021-82164-w.

Inhibition of HIV-1 gene transcription by KAP1 in myeloid lineage

Affiliations

Inhibition of HIV-1 gene transcription by KAP1 in myeloid lineage

Amina Ait-Ammar et al. Sci Rep. .

Abstract

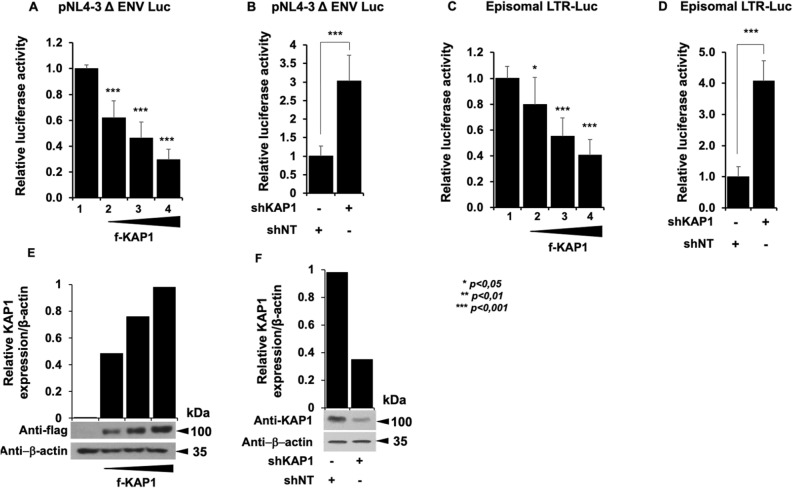
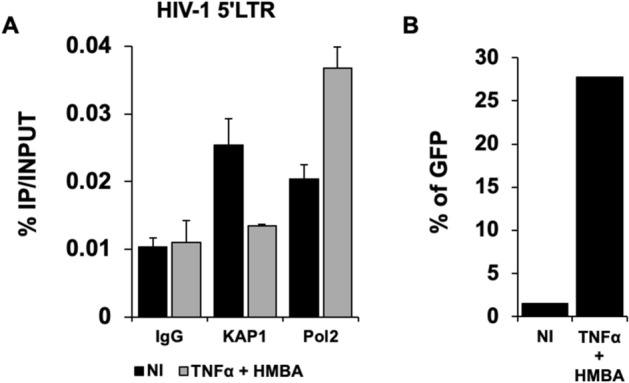
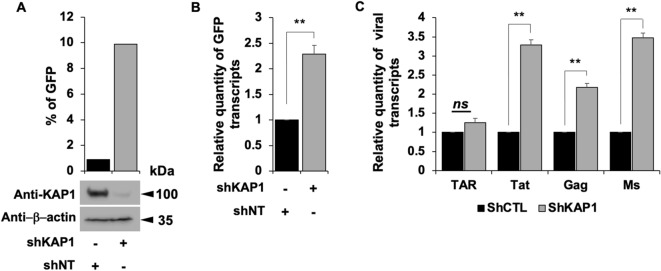
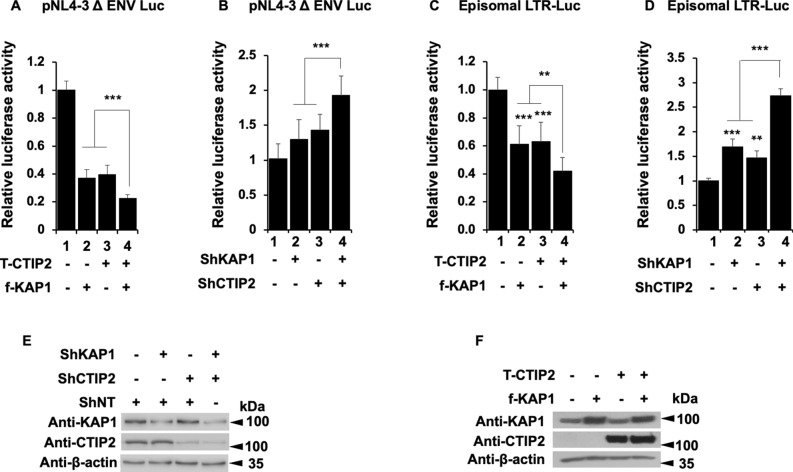
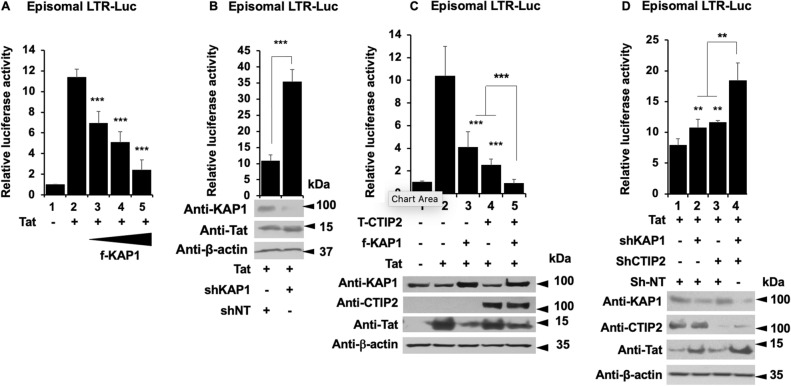
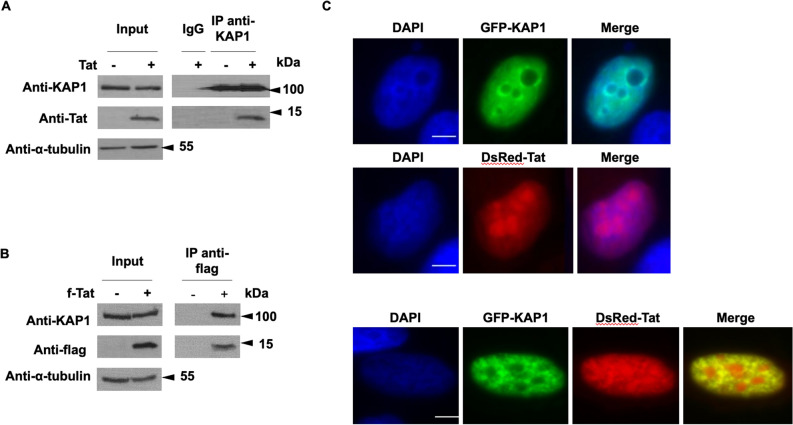
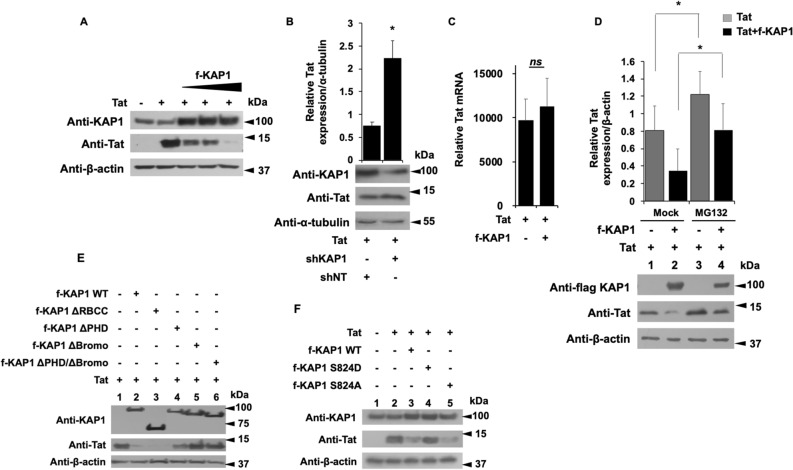
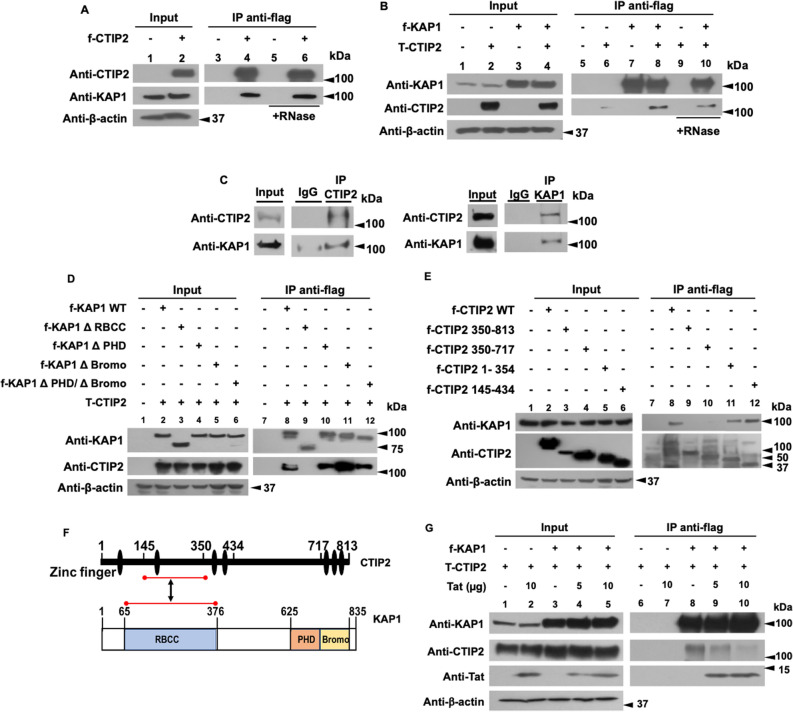
HIV-1 latency generates reservoirs that prevent viral eradication by the current therapies. To find strategies toward an HIV cure, detailed understandings of the molecular mechanisms underlying establishment and persistence of the reservoirs are needed. The cellular transcription factor KAP1 is known as a potent repressor of gene transcription. Here we report that KAP1 represses HIV-1 gene expression in myeloid cells including microglial cells, the major reservoir of the central nervous system. Mechanistically, KAP1 interacts and colocalizes with the viral transactivator Tat to promote its degradation via the proteasome pathway and repress HIV-1 gene expression. In myeloid models of latent HIV-1 infection, the depletion of KAP1 increased viral gene elongation and reactivated HIV-1 expression. Bound to the latent HIV-1 promoter, KAP1 associates and cooperates with CTIP2, a key epigenetic silencer of HIV-1 expression in microglial cells. In addition, Tat and CTIP2 compete for KAP1 binding suggesting a dynamic modulation of the KAP1 cellular partners upon HIV-1 infection. Altogether, our results suggest that KAP1 contributes to the establishment and the persistence of HIV-1 latency in myeloid cells.


Conflict of interest statement

The authors declare no competing interests.

Figures

Figure 1
Figure 1
KAP1 suppresses HIV-1 expression (AD) Microglial cells were transfected with the pNL4-3 Δ ENV Luc vectors (A,B) or with episomal vector LTR-Luc (C,D) in the presence of an increasing dose of KAP1 (A,C), or with a KAP1 knockdown (shKAP1) (B,D). Luciferase activity was measured 48 h post-transfection and after lysis of the cells. Luciferase values were normalized to those obtained with LTR-Luc or pNL4-3 Δ ENV Luc alone. A t-test was performed on 3 independent experiments P (*P < 0.05, **P < 0.01, ***P < 0.001). (E,F) Overexpressions of KAP1, as well as knockdown efficiencies, were validated by Western blotting. KAP1 expression levels were quantified and presented relatively to β-actin expression, using image J software. Full-length blots are presented in Supplementary Figure 1.
Figure 2
Figure 2
KAP1 binds to the latent HIV-1 promoter (A) Microglial cells latently infected with HIV-1 containing the GFP reporter gene were treated for 24 h with TNFα and HMBA. Cells were subjected to ChIP-qPCR experiments targeting the binding to the HIV-1 5′LTR promoter (B) The same microglial cells were also analyzed by flow cytometry. The results are presented as percentages of immunoprecipitated DNA compared to the input DNA (% IP/INPUT). This figure is representative of 3 independent experiments.
Figure 3
Figure 3
Reactivation of HIV-1 gene transcription in myeloid models of latency upon KAP1 depletion (AC) The HIV-1 infected monocytic (THP89) cells containing a GFP reporter gene were transduced either with non-targeting shRNA (indicated as shNT) or shKAP1. (A) The GFP expression was examined by flow cytometry and the KAP1 protein expression level was assessed on total cellular extract by Western blot. (B,C) Total RNA products from shNT or shKAP1 THP89 transduced cells were retrotranscribed. GFP and HIV-1 gene transcripts as Initiated (TAR region), elongated (gag, tat), and multiple-spliced RNA (Ms RNA) were quantitated by real-time RT–PCR. The relative mRNA level was first normalized to GAPDH then to the shNT-transduced condition. Results are means from duplicate. Full-length blots are presented in Supplementary Figure 2.
Figure 4
Figure 4
Kap1 and CTIP2 together contribute to the silencing of HIV-1 gene expression (AD) Microglial cells were transfected with the pNL4-3 Δ ENV Luc vectors (A,B) or LTR-Luc (C,D) under the indicated conditions. The cells were lysed after 48 h of transfection. The luciferase activities were measured and normalized to the conditions where the pNL4-3 Δ ENV Luc and LTR-Luc vectors were transfected alone. A t-test was performed on 3 independent experiments P (*P < 0.05, **P < 0.01, ***P < 0.001). (E,F) Over-expression and knockdown of the indicated proteins were validated by Western blot. Full-length blots are presented in Supplementary Figure 3.
Figure 5
Figure 5
KAP1 inhibits Tat activity and cooperates with CTIP2 for this purpose (AD) Microglial cells were transfected with LTR-Luc vector under the indicated conditions. After 48 h of transfection, the luciferase activities were measured after cell lysis and normalized under conditions where LTR-Luc vector were transfected alone. A t-test was performed on 3 independent experiments P (*P < 0.05, **P < 0.01, ***P < 0.001). (C,D) Over-expression and knockdown of the indicated proteins were validated by Western blot. Full-length blots are presented in Supplementary Figure 5.
Figure 6
Figure 6
KAP1 interacts and colocalize with Tat (A,B) HEK cells were transfected with the indicated vectors. After 48 h of transfection, the nuclear protein extracts were immunoprecipitated with KAP1 (A) and flag (B) antibodies. The eluted protein complexes were analyzed by Western blotting for the presence of the indicated proteins. (C) Microglial cells were transfected for 48 h with the indicated vectors and subjected to observation under a fluorescence microscope. Scale bars are set to 5 µm. Full-length blots are presented in Supplementary Figure 6.
Figure 7
Figure 7
The Bromo domain of KAP1 promotes Tat degradation via the proteasome pathway (A,B,E,F) HEK cells were transfected with the indicated vectors. 48 h later, the nuclear proteins were analyzed by Western blot for the presence of the indicated proteins. (B) Tat expression level whose relative quantification to the α-tubulin was carried out using the image J software. (C) The RNA extracts from HEK cells transfected with the indicated plasmids were submitted to RT-qPCR experiments against Tat. The relative mRNA level of Tat was normalized to the GAPDH gene. (D) HEK cells were transfected with the indicated vectors. After 18 h of transfection, the cells were treated or not with 50 μM of MG132 for 6 h. 24 h post-transfection, the total protein extracts were analyzed by Western blot for the presence of KAP1 and Tat. Tat expression level was quantified relatively to β-actin expression, using image J software. A t-test was performed on 3 (B,C) and 5 (D) independent experiments P (*P < 0.05, **P < 0.01, ***P < 0.001). Full-length blots are presented in Supplementary Figure 7.
Figure 8
Figure 8
CTIP2 interacts with KAP1 in an RNA independent manner and competes with Tat for KAP1 binding (A,B) HEK cells were transfected with flag-CTIP2 (A) or flag-KAP1 and Tap-CTIP2 (B). 48 h post-transfection, the nuclear protein extracts, treated or not with RNase, were subjected to immunoprecipitation with the flag antibody. The immunoprecipitated complexes were tested by Western blot for the presence of KAP1 (A) and CTIP2 (B). (C) The nuclear protein extracts of microglial cells were analyzed by Western blot for the expression of CTIP2 and KAP1 and submitted to immunoprecipitation experiments with CTIP2 and KAP1 antibodies. (D) The HEK cells were transfected with Tap-CTIP2 and one of the vectors encoding f-KAP1 WT: wild type, or KAP1 deleted from the RBCC domain (ΔRBCC), or PHD (ΔPHD), or Bromo (ΔBromo) or both PHD and Bromo domains (ΔPHD/ΔBromo), or with f-CTIP2 deletion mutants, as indicated (E). After 48 h, the nuclear protein extracts were immunoprecipitated with flag antibody. The eluted protein complexes were analyzed by Western blot for the presence of CTIP2 and KAP1. (F) The interface between CTIP2 and KAP1 structural domains are presented. (G) HEK cells were transfected with the indicated vectors in the presence of an increasing dose of Tat. After 48 h, the nuclear protein extracts were treated as in (D). The results are representative of at least two independent experiments. Full-length blots are presented in Supplementary Figure 9.

References

    1. Kumar A, Abbas W, Herbein G. HIV-1 latency in monocytes/macrophages. Viruses. 2014;6:1837–1860. doi: 10.3390/v6041837. - DOI - PMC - PubMed
    1. Kandathil AJ, Sugawara S, Balagopal A. Are T cells the only HIV-1 reservoir? Retrovirology. 2016;13:86. doi: 10.1186/s12977-016-0323-4. - DOI - PMC - PubMed
    1. Honeycutt JB, et al. HIV persistence in tissue macrophages of humanized myeloid-only mice during antiretroviral therapy. Nat. Med. 2017;23:638–643. doi: 10.1038/nm.4319. - DOI - PMC - PubMed
    1. Gelman BB, et al. Neurovirological correlation with HIV-associated neurocognitive disorders and encephalitis in a HAART-era cohort. J. Acquir. Immune Defic. Syndr. 2013;62:487–495. doi: 10.1097/QAI.0b013e31827f1bdb. - DOI - PMC - PubMed
    1. Clements JE, Gama L, Graham DR, Mankowski JL, Zink MC. A simian immunodeficiency virus macaque model of highly active antiretroviral treatment: Viral latency in the periphery and the central nervous system. Curr. Opin. HIV AIDS. 2011;6:37–42. doi: 10.1097/COH.0b013e3283412413. - DOI - PMC - PubMed

Publication types

MeSH terms

Substances