. 2021 Jan 29;4(1):11.
doi: 10.1038/s41746-020-00369-1.

Deep COVID DeteCT: an international experience on COVID-19 lung detection and prognosis using chest CT

Affiliations

Deep COVID DeteCT: an international experience on COVID-19 lung detection and prognosis using chest CT

Edward H Lee et al. NPJ Digit Med. .

Abstract

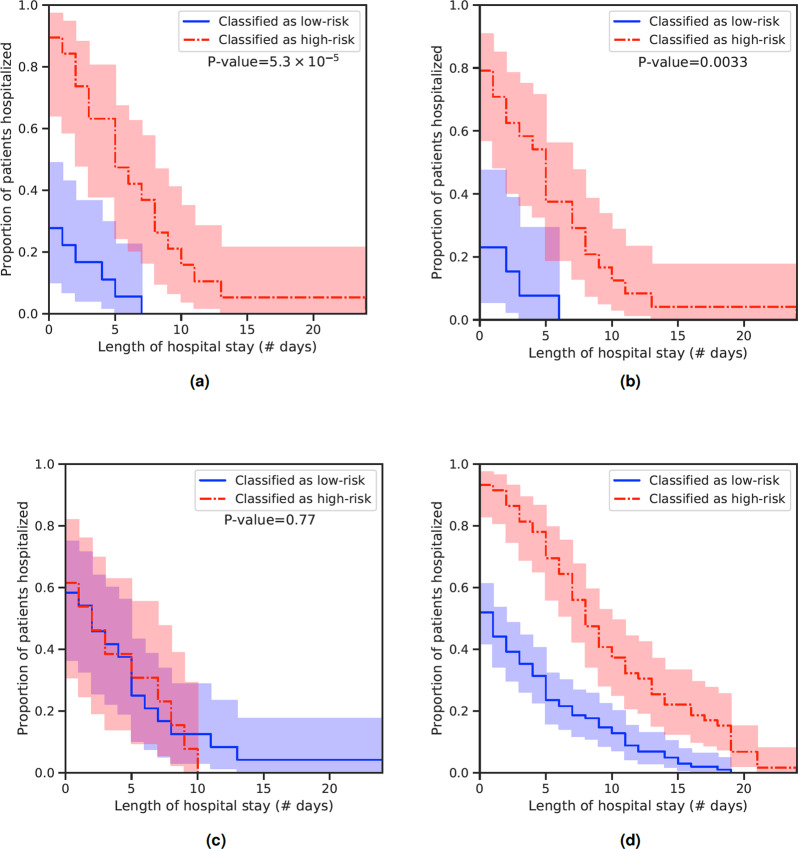
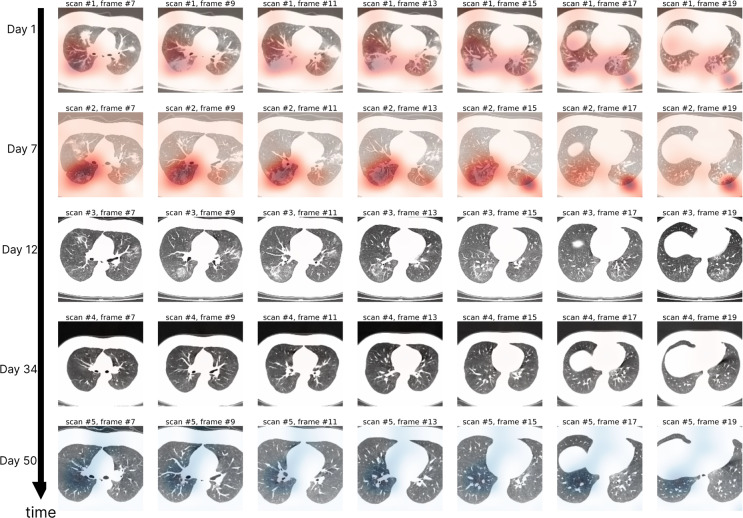
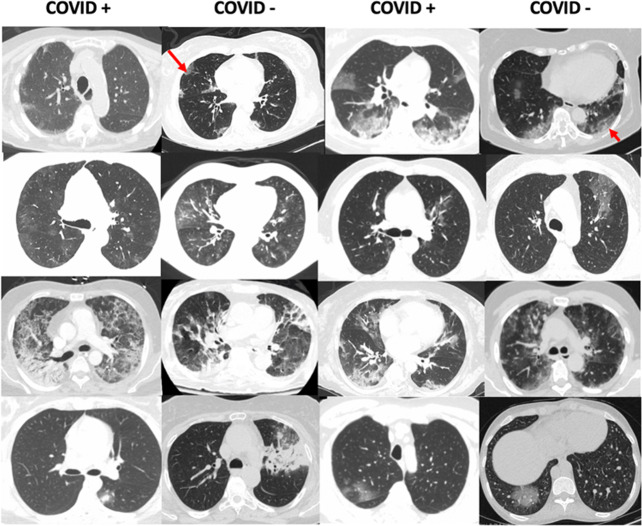
The Coronavirus disease 2019 (COVID-19) presents open questions in how we clinically diagnose and assess disease course. Recently, chest computed tomography (CT) has shown utility for COVID-19 diagnosis. In this study, we developed Deep COVID DeteCT (DCD), a deep learning convolutional neural network (CNN) that uses the entire chest CT volume to automatically predict COVID-19 (COVID+) from non-COVID-19 (COVID-) pneumonia and normal controls. We discuss training strategies and differences in performance across 13 international institutions and 8 countries. The inclusion of non-China sites in training significantly improved classification performance with area under the curve (AUCs) and accuracies above 0.8 on most test sites. Furthermore, using available follow-up scans, we investigate methods to track patient disease course and predict prognosis.


Conflict of interest statement

The authors declare no competing interests.

Figures

Fig. 1
Fig. 1. Institutions used in our study.
Our AI model (DCD) captures the diversity of patients, labels, and scanners from around the world. Permission was sought and granted by all relevant institutions to use their logos.
Fig. 2
Fig. 2. Characteristics of patients by institution and country.
This table summarizes the patient demographics used in our study.
Fig. 3
Fig. 3. Receiver operating characteristics (ROC) curves and area under the curve (AUC) for different external test sites.
The sites are: China-1 (a), China-2 (b), Stanford (c), Unity Health (d), Koç (e), Rajaie (f), UNIFESP (g), Henry Ford (h), TUMS-1 (i), MosMedData (j). ROC curves were not plotted for sites with imbalanced data: Kyungpook, GUMS, and TUMS-2. The confusion matrix for our model trained on all sites and finetuned on 20% of site China-1 (15% train, 5% validation) and evaluated on the remaining 80% of China-1 (k).
Fig. 4
Fig. 4. DCD predictions for Site 7.
Histogram of model outputs on external hold-out test site 7 (Einstein) with only COVID+ cases.
Fig. 5
Fig. 5. DCD predictions for Site 12.
Histogram of model outputs on external hold-out test site 12 (GUMS) with only COVID+ cases.
Fig. 6
Fig. 6. DCD predictions for Site 13.
Histogram of model outputs on external hold-out test site 13 (TUMS-2) with only COVID+ cases.
Fig. 7
Fig. 7. Two-dimensional manifold of features generated using t-distributed stochastic neighbor embedding (TSNE) on the DCD model.
DCD evaluated on the test set of China-1 (80% of China-1). It was trained on sites 1 to 11 and finetuned on the training set of China-1 (20% of China-1).
Fig. 8
Fig. 8. Grad-CAM over CT scans of COVID19+ and COVID19- pneumonia patients.
On top right, DCD correctly diagnosed the scan of a COVID19- patient with PNA who showed signs of ground glass opacity.
Fig. 9
Fig. 9. 3D view of a model-generated 3D Grad-CAM superimposed on the CT of a COVID+ case with bilateral peripheral ground glass opacities and consolidation.
The map was generated from only 1 forward and 1 backward pass of 1 example in the test set.
Fig. 10
Fig. 10. Features from DCD for the follow-up patients over time.
Scans with high scores indicate high similarity to the COVID+ PNA population. Many patients show a representative feature trajectory with increasing COVID+ PNA intensity peaking near the time of discharge followed by a subsequent decrease after discharge. a Time-series of COVID-19 survivors with 2 or more follow-up scans, and (b) 3D plot of selected survivor scores that reveal similar trajectories.
Fig. 11
Fig. 11. Kaplan–Meier plots on COVID disease course.
Different configurations of DCD: (a) 1 prior +1 follow-up scans, (b) 1 scan only, (c) age and sex only, (d) 1 prior +1 follow-up scans (combines 5 validation folds in a 5-fold cross-validation experiment).
Fig. 12
Fig. 12. Case study using DCD on a follow-up patient (24 years old) with 5 scans.
This patient was discharged on day 13. Modified gradient heat maps, H(x, y, z, t) for all pixel coordinates (x, y, z), are superimposed onto the original CT, and color-coded (red for H(x, y, z) > 0 and blue for H(x, y, z) < 0). The model was originally trained on task 1 and evaluated on these unseen examples. Severity predicted by DCD was highest on day 7 (as indicated by the visual difference between H on day 7 and day 1). On day 12, DCD’s H(x, y, z, t = 12) ≈ 0 indicates significant recovery.
Fig. 13
Fig. 13. Examples of COVID− PNA patients in our study that show heterogeneous features, some that are similar to COVID+ PNA.
For example, two COVID− patients with influenza PNA (red arrows), including H1N1 (long red arrow), show peripheral ground glass opacities similar to COVID+.

References

    1. Zhou P, et al. A pneumonia outbreak associated with a new coronavirus of probable bat origin. Nature. 2020;579:270–273. doi: 10.1038/s41586-020-2012-7. - DOI - PMC - PubMed
    1. Chen, N. et al. Epidemiological and clinical characteristics of 99 cases of 2019 novel Coronavirus Pneumonia in Wuhan, China: a descriptive study. Lancet395, 507–513 (2020). - PMC - PubMed
    1. Wang, D. et al. Clinical characteristics of 138 hospitalized patients with 2019 Novel Coronavirus-infected Pneumonia in Wuhan, China.JAMA323, 1061–1069 (2020). - PMC - PubMed
    1. Li, Q. et al. Early transmission dynamics in Wuhan, China, of novel Coronavirus-Infected Pneumonia.NewEngl. J. Med. 382, 1199–1207 (2020). - PMC - PubMed
    1. Liu, R. et al. Positive rate of RT-PCR detection of SARS-CoV-2 infection in 4880 cases from one hospital in Wuhan, China, from Jan to Feb 2020. Clinica chimica acta; international journal of clinical chemistry505, 172–175 (2020). - PMC - PubMed

LinkOut - more resources