. 2021 Mar;16(3):1343-1375.
doi: 10.1038/s41596-020-00469-y. Epub 2021 Jan 29.

Revealing nascent RNA processing dynamics with nano-COP

Affiliations

Revealing nascent RNA processing dynamics with nano-COP

Heather L Drexler et al. Nat Protoc. 2021 Mar.

Abstract

During maturation, eukaryotic precursor RNAs undergo processing events including intron splicing, 3'-end cleavage, and polyadenylation. Here we describe nanopore analysis of co-transcriptional processing (nano-COP), a method for probing the timing and patterns of RNA processing. An extension of native elongating transcript sequencing, which quantifies transcription genome-wide through short-read sequencing of nascent RNA 3' ends, nano-COP uses long-read nascent RNA sequencing to observe global patterns of RNA processing. First, nascent RNA is stringently purified through a combination of 4-thiouridine metabolic labeling and cellular fractionation. In contrast to cDNA or short-read-based approaches relying on reverse transcription or amplification, the sample is sequenced directly through nanopores to reveal the native context of nascent RNA. nano-COP identifies both active transcription sites and splice isoforms of single RNA molecules during synthesis, providing insight into patterns of intron removal and the physical coupling between transcription and splicing. The nano-COP protocol yields data within 3 d.


Figures
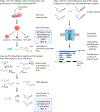
Figure 1.
Figure 1.. nano-COP schematic.
Outline of the nano-COP procedure, providing an overview of the critical experimental and computational steps in the protocol. Created with BioRender.com.
Figure 2.
Figure 2.. Direct RNA sequencing of 4sU-labeled chromatin-associated RNA provides the most accurate measurement of the nascent transcriptome.
a) Distribution of splicing patterns obtained with different library preparation methods in human K562 cells. Among reads spanning at least two introns, “all spliced” represents reads in which every intron within the read is spliced, “intermediate” represents reads in which at least one intron is spliced and one intron is unspliced, and “all unspliced” represents reads in which every intron is present and therefore unspliced. b) Global analysis of distance transcribed from the 3’ SS and the percent of spliced molecules in human K562 cells using the indicated library preparation methods (N=72,937 4sU-chr RNA; N=14,227 chr RNA; N=34,463 4sU-chr cDNA). c) Global analysis of distance transcribed from the 3’SS and the percent of spliced molecules separated by intron length for RNA or cDNA sequencing of 4sU-chr RNA (N=37,489 < 1 kb 4sU-chr RNA; N=32,246 1–10 kb 4sU-chr RNA; N=3,202 > 10 kb 4sU-chr RNA; N=15,952 < 1 kb 4sU-chr cDNA; N=16,149 1–10 kb 4sU-chr cDNA; N=2,362 > 10 kb 4sU-chr cDNA). Similar trends were observed across transcript lengths (data not shown). Shaded regions in b) and c) represent standard deviation across two to five biological replicates. Each category includes both poly(A)- and poly(I)-tailed replicates. d) Cumulative distribution plot of read lengths passing the default base calling threshold for one representative sample from each library preparation method using poly(A) tailing. The methods employed for the preparation of libraries other than nano-COP are detailed in Supplementary Methods. Abbreviations: “chr”: chromatin purification; “4sU”: 4sU labeling and purification; “seq”: sequencing. Nano-COP samples shown in this figure were previously published in.
Figure 3 |
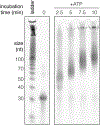
Figure 3 |. Troubleshooting the incubation time for 3’ end poly(A) tailing with oGAB11.
oGAB11 was polyadenylated using Clontech E.coli poly(A) polymerase in the presence of ATP as described in Box 2. Tailing resulted in a time-dependent size shift of oGAB11. After 7.5 minutes, the incubation time selected for nano-COP, >40 adenosines have been added to most RNAs, which is more than sufficient for ligation of the direct RNA sequencing RTA containing 10 T’s. The unprocessed image is shown in Source Data.
Figure 4 |
Figure 4 |. Detection of poly(A) and poly(I) tails in ONT direct RNA sequencing data.
a) Ionic current traces (from 3’ to 5’) for reads obtained from sequencing of ERCC-00048 with a poly(A) tail (left), a poly(I) tail (middle), or poly(A) and poly(I) tails (right). Poly(A) tails result in a low variance region near the 3’ end (highlighted in blue), whereas poly(I) tails result in a similar signal with higher variance (highlighted in red). Only the first 20000 samples of each read are shown. b) Detection of tail identity using nanopolish-detect-polyI on reads obtained from sequencing of ERCC-00048 with the three tailing conditions described in a). c) Detection of tail identity using nanopolish-detect-polyI on nano-COP with poly(I) tailing and direct mRNA-seq following poly(I) tailing of polyA+ RNA (Supplementary Methods). Both types of samples were from K562 cells. Tail identity is shown for reads ending in gene bodies, at poly(A) sites, or up to 500 nt downstream of poly(A) sites.
Figure 5 |
Figure 5 |
Representative RT-qPCR plots of RNA purified by cellular fractionation with varying incubation times in the presence of the splicing inhibitor pladienolide B (PlaB). a) The forward “spliced” primer is designed over a splice junction, whereas the forward “unspliced” primer is just upstream of the 3’ intron–exon junction. The reverse primer is the same for both PCR reactions in the downstream exon. The proportions of spliced and unspliced molecules for intron 5 of the BRD2 gene are measured for the indicated durations of incubation with 100 mM PlaB before chromatin RNA purification, and are represented as fold change relative to the DMSO sample. Black dots represent individual qPCR reactions and error bars represent values calculated from standard deviation of the triplicate samples. b) Percent spliced is determined by calculating the proportion of spliced molecules to total molecules. For intron 5 of the BRD2 gene, percent spliced was compared between cytoplasmic and chromatin-associated RNA for the indicated durations of incubation with 100 mM PlaB.
Figure 6 |
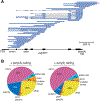
Figure 6 |. Nano-COP captures the nascent transcriptome.
a) Representative nano-COP reads aligned to the GSTP1 gene in human K562 cells. The gene structure is represented from the transcription start site (TSS) to the poly(A) site, with black boxes representing exons and lines representing introns. Within the reads, blue boxes represent read coverage, black lines represent skipped coverage due to splicing, and the start of the read (3’ end of RNA) is represented with an arrow. Dashed lines represent reads that continue beyond the region displayed. b) Distribution of nano-COP 3’ ends in human K562 cells with enzymatic poly(A) tail addition (left) and poly(I) tail addition (right). “Poly(A)” sites are defined as regions within 50 nucleotides of the end coordinate of annotated genes or of RNA-PET annotations from cytoplasm and chromatin fractions in K562 ENCODE data (ENCODE Project Consortium, 2012). “Post-poly(A)” sites are defined as the region between 50–550 nucleotides after the end of annotated genes. “Splice sites” are defined as 50 nucleotides upstream and 10 nucleotides downstream of annotated 5’ splice sites. “Undetermined” indicate reads that align to more than one category and “other” represents read ends that do not align in the sense direction of annotated gene features (e.g., antisense transcripts, noncoding RNAs, intergenic transcription, etc.). Figure adapted from ref.

References

    1. Keohavong P, Gattoni R, LeMoullec JM, Jacob M & Stévenin J The orderly splicing of the first three leaders of the adenovirus-2 major late transcript. Nucleic Acids Res. 10, 1215–1229 (1982). - PMC - PubMed
    1. Mariman EC, van Beek-Reinders RJ & van Venrooij WJ Alternative splicing pathways exist in the formation of adenoviral late messenger RNAs. J. Mol. Biol 163, 239–256 (1983). - PubMed
    1. Beyer AL & Osheim YN Splice site selection, rate of splicing, and alternative splicing on nascent transcripts. Genes Dev. 2, 754–765 (1988). - PubMed
    1. Audibert A, Weil D & Dautry F In vivo kinetics of mRNA splicing and transport in mammalian cells. Mol. Cell. Biol 22, 6706–6718 (2002). - PMC - PubMed
    1. Singh J & Padgett RA Rates of in situ transcription and splicing in large human genes. Nat. Struct. Mol. Biol 16, 1128–1133 (2009). - PMC - PubMed

Publication types

MeSH terms