Clinical Trial
. 2021 May;64(5):1079-1092.
doi: 10.1007/s00125-020-05376-1. Epub 2021 Jan 30.

Oral insulin immunotherapy in children at risk for type 1 diabetes in a randomised controlled trial

Affiliations
Clinical Trial

Oral insulin immunotherapy in children at risk for type 1 diabetes in a randomised controlled trial

Robin Assfalg et al. Diabetologia. 2021 May.

Abstract

Aims/hypothesis: Oral administration of antigen can induce immunological tolerance. Insulin is a key autoantigen in childhood type 1 diabetes. Here, oral insulin was given as antigen-specific immunotherapy before the onset of autoimmunity in children from age 6 months to assess its safety and immune response actions on immunity and the gut microbiome.

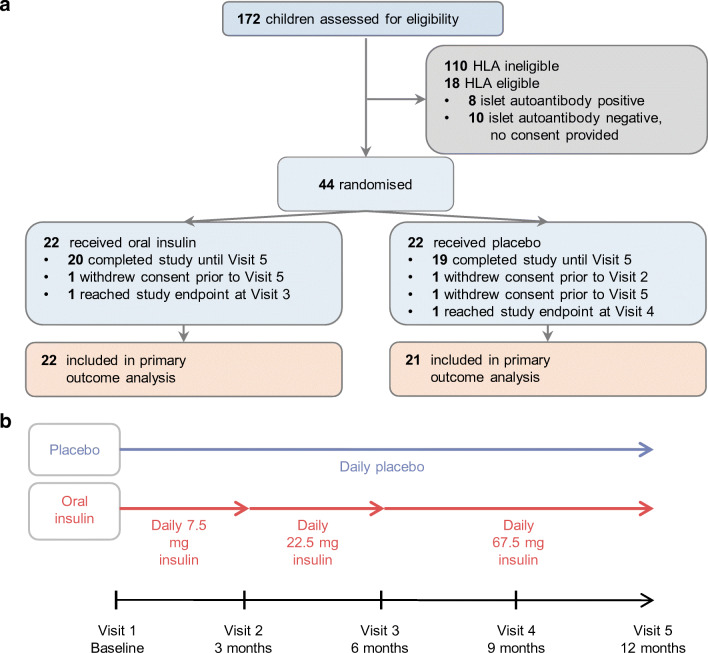
Methods: A phase I/II randomised controlled trial was performed in a single clinical study centre in Germany. Participants were 44 islet autoantibody-negative children aged 6 months to 2.99 years who had a first-degree relative with type 1 diabetes and a susceptible HLA DR4-DQ8-containing genotype. Children were randomised 1:1 to daily oral insulin (7.5 mg with dose escalation to 67.5 mg) or placebo for 12 months using a web-based computer system. The primary outcome was immune efficacy pre-specified as induction of antibody or T cell responses to insulin and measured in a central treatment-blinded laboratory.

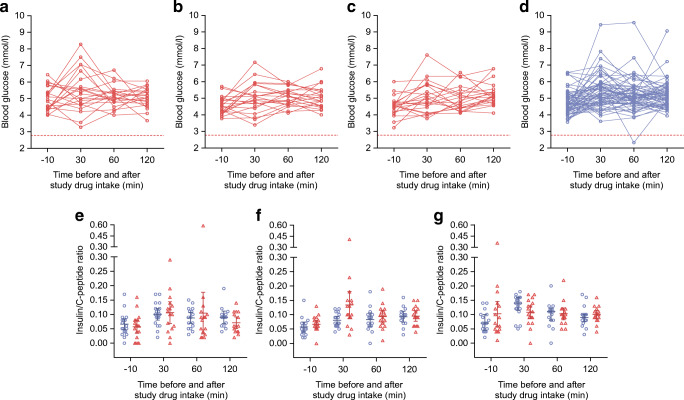
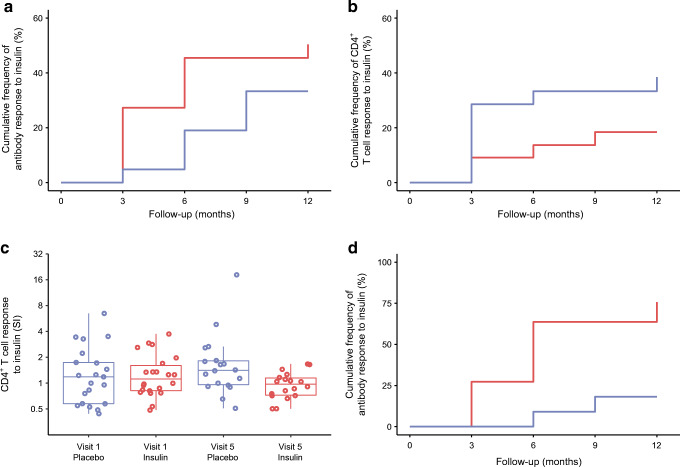
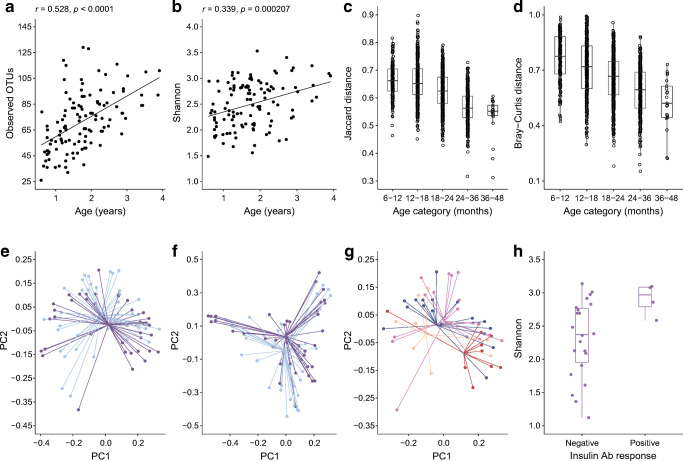
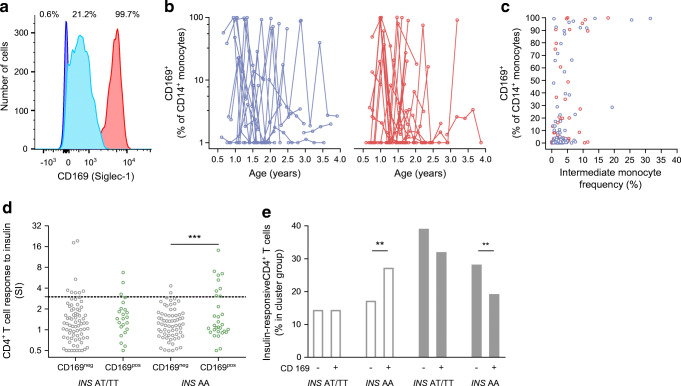
Results: Randomisation was performed in 44 children. One child in the placebo group was withdrawn after the first study visit and data from 22 insulin-treated and 21 placebo-treated children were analysed. Oral insulin was well tolerated with no changes in metabolic variables. Immune responses to insulin were observed in children who received both insulin (54.5%) and placebo (66.7%), and the trial did not demonstrate an effect on its primary outcome (p = 0.54). In exploratory analyses, there was preliminary evidence that the immune response and gut microbiome were modified by the INS genotype Among children with the type 1 diabetes-susceptible INS genotype (n = 22), antibody responses to insulin were more frequent in insulin-treated (72.7%) as compared with placebo-treated children (18.2%; p = 0.03). T cell responses to insulin were modified by treatment-independent inflammatory episodes.

Conclusions/interpretation: The study demonstrated that oral insulin immunotherapy in young genetically at-risk children was safe, but was not associated with an immune response as predefined in the trial primary outcome. Exploratory analyses suggested that antibody responses to oral insulin may occur in children with a susceptible INS genotype, and that inflammatory episodes may promote the activation of insulin-responsive T cells.

Trial registration: Clinicaltrials.gov NCT02547519 FUNDING: The main funding source was the German Center for Diabetes Research (DZD e.V.).

Keywords: Autoimmunity; Insulin; Oral immunotherapy; Primary prevention; Type 1 diabetes.


Figures

Fig. 1
Fig. 1
Schematics of participant disposition, design and treatment groups. (a) Disposition of the participants. All children had a first-degree family history of type 1 diabetes. Study endpoint was the development of persistent antibodies to GAD, IA-2 or ZnT8. (b) Study design and treatment groups
Fig. 2
Fig. 2
Blood glucose concentration and insulin/C-peptide ratio over time. (ad) Blood glucose concentrations were measured in children before and after intake of oral insulin at a dose of 7.5 mg at baseline visit 1 (a; n = 22), 22.5 mg at 3 months visit 2 (b; n = 22), and 67.5 mg at 6 months visit 3 (c; n =22), or placebo at visits 1–3 (d; n = 63). The concentrations for individual children are connected by lines. The dashed line indicates the threshold for hypoglycaemia at 2.78 mmol/l (ad). (eg) The insulin/C-peptide ratio is plotted for each time point at visit 1 (e), visit 2 (f) and visit 3 (g) for children receiving oral insulin (red triangles) or placebo (blue circles)
Fig. 3
Fig. 3
Responses to treatment and analysis of responses. (a, b) Immune response to oral insulin or placebo. Kaplan–Meier analysis of a positive antibody response to insulin (a) and CD4+ T cell response to insulin (b) as defined by the primary outcome criteria in children who received placebo (blue line; n = 21) or oral insulin (red line; n = 22). The follow-up time is calculated from the first day of treatment (a, b). (c) CD4+ T cell response to insulin calculated as the SI relative to medium control at baseline (visit 1) and at 12 months (visit 5) in children who received placebo (blue circles; n = 21 at baseline, n = 18 at 12 months) or oral insulin (red circles; n = 22 at baseline, n = 18 at 12 months). (d) Kaplan–Meier analysis of a positive antibody response to insulin as defined by the primary outcome criteria in children with the INS AA genotype who received placebo (blue line; n = 11) or oral insulin (red line; n = 11; p = 0.0085)
Fig. 4
Fig. 4
Microbiome alterations in relation to age, INS genotype and treatment. (a, b) Alpha diversity in relation to age over the time of study participation in samples from baseline (n = 40), 6 months (n = 40) and 12 months (n = 35); shown are richness (observed OTU) (a) and evenness (Shannon) (b). (c, d) Beta diversity in relation to age over time of study participation (baseline, 6 months, 12 months); shown are Jaccard distance (c; p < 0.0001) and Bray–Curtis distance (d; p < 0.0001). Each dot represents the distance between two samples within the age range (c, d). (eg) Beta diversity differences by PCoA (baseline, 6 months, 12 months); shown are Jaccard distance in children with the INS AA genotype (purple dots and lines) or the INS AT or TT genotype (bright-blue dots and lines) (e; p = 0.0258), Bray–Curtis distance in children with the INS AA genotype (purple dots and lines) or the INS AT or TT genotype (bright-blue dots and lines) (f; p = 0.0422), and Jaccard distance in children with the INS AA genotype who received placebo (dark-blue dots and lines) or oral insulin (red dots and lines), and in children with the INS AT or TT genotype who received placebo (bright-orange dots and lines) or oral insulin (fuchsia dots and lines) (g; p = 0.0069). (h) Alpha diversity (Shannon) in children with the INS AA genotype who had a negative (n = 22 samples) or positive (n = 4 samples) antibody response to insulin (6 months, 12 months) (p = 0.0395). Unless indicated, the plots include both placebo- and oral insulin-treated children. For treatment-related analyses, only post-baseline samples at 6 and 12 months were included. Ab, antibody; PC1, principal component 1; PC2, principal component 2; PCoA, principal coordinates analysis
Fig. 5
Fig. 5
T cell responses to insulin in relation to INS genotype and monocyte CD169 expression. (ad) Monocyte CD169 expression and CD4+ T cell responses to insulin over the time of study participation (baseline, 3, 6, 9, 12 months) in all study participants. (a) Representative flow cytometry histograms of CD169 staining intensity on monocytes. Shown are three samples with low (blue; 0.6% positive cells), moderate (light blue, 21.2% positive cells) and high monocyte CD169 expression (red, 99.7% positive cells). A threshold of >5% positive monocytes was used as the threshold for defining monocyte CD169+ samples. (b) Percentage of CD169+ cells out of CD14+ monocytes in relation to age over the time of study participation in children who received placebo (blue lines; n = 21) or oral insulin (red lines; n = 22); plotted on a log scale. (c) Correlation between the frequency of CD169+ monocytes and the frequency of intermediate monocytes in peripheral blood from children who received placebo (blue circles; n = 102 samples) or oral insulin (red circles; n = 104 samples; r = 0.52, p < 0.0001). (d) CD4+ T cell responses to insulin (SI) in samples from 20 children with the INS AT or TT genotype and 22 children with the INS AA genotype and stratified by monocyte CD169 expression as negative (CD169neg, grey circles; n = 148 samples) or positive (CD169pos, green circles; n = 58 samples) in all study visits; plotted on a log scale. (e) The frequencies of insulin-responsive CD4+ T cells (n = 1036 cells from 22 samples) in the Th1/Th21-like cell clusters 2 and 3 (left; white bars) and the Treg-like clusters 9, 10 and 11 (right; grey bars) according to whether cells were from children with the INS AT/TT (n = 550 cells) or INS AA (n = 486 cells) genotype and samples that were monocyte CD169 negative (n = 559 cells) or positive (n = 477 cells). **p < 0.01, ***p < 0.001

References

    1. Atkinson MA, Eisenbarth GS, Michels AW. Type 1 diabetes. Lancet. 2014;383:69–82. doi: 10.1016/S0140-6736(13)60591-7. - DOI - PMC - PubMed
    1. Bonifacio E, Achenbach P. Birth and coming of age of islet autoantibodies. Clin Exp Immunol. 2019;198:294–305. doi: 10.1111/cei.13360. - DOI - PMC - PubMed
    1. Ziegler AG, Hummel M, Schenker M, Bonifacio E. Autoantibody appearance and risk for development of childhood diabetes in offspring of parents with type 1 diabetes: The 2-year analysis of the German BABYDIAB study. Diabetes. 1999;48:460–468. doi: 10.2337/diabetes.48.3.460. - DOI - PubMed
    1. Ilonen J, Hammais A, Laine AP, et al. Patterns of beta-cell autoantibody appearance and genetic associations during the first years of life. Diabetes. 2013;62:3636–3640. doi: 10.2337/db13-0300. - DOI - PMC - PubMed
    1. Krischer JP, Lynch KF, Schatz DA, et al. The 6 year incidence of diabetes-associated autoantibodies in genetically at-risk children: The TEDDY study. Diabetologia. 2015;58:980–987. doi: 10.1007/s00125-015-3514-y. - DOI - PMC - PubMed

Publication types

MeSH terms

Associated data